
ABSTRACT
Mastitis is among the main reasons women cease breastfeeding. In farm animals, mastitis results in significant economic losses and the premature culling of some animals. Nevertheless, the effect of inflammation on the mammary gland is not completely understood. This article discusses the changes to DNA methylation in mouse mammary tissue caused by lipopolysaccharide-induced inflammation after in vivo intramammary challenges and the differences in DNA methylation between 1st and 2nd lactations. Lactation rank induces 981 differential methylations of cytosines (DMCs) in mammary tissue. Inflammation in 1st lactation compared to inflammation in 2nd lactation results in the identification of 964 DMCs. When comparing inflammation in 1st vs. 2nd lactations with previous inflammation history, 2590 DMCs were identified. Moreover, Fluidigm PCR data show changes in the expression of several genes related to mammary function, epigenetic regulation, and the immune response. We show that the epigenetic regulation of two successive physiological lactations is not the same in terms of DNA methylation and that the effect of lactation rank on DNA methylation is stronger than that of the onset of inflammation. The conditions presented here show that few DMCs are shared between comparisons, suggesting a specific epigenetic response depending on lactation rank, the presence of inflammation, and even whether the cells had previously suffered inflammation. In the long term, this information could lead to a better understanding of the epigenetic regulation of lactation in both physiological and pathological conditions.
Abbreviations: RRBS, reduced representation bisulphite sequencing; RT-qPCR, real-time quantitative polymerase chain reaction; MEC, mammary epithelial cells; MaSC, mammary stem cell; TSS, transcription start site; TTS, transcription termination site; UTR, untranslated region; SINE, short interspersed nuclear element; LINE, long interspersed nuclear element; CGI, CpG island; DEG, differentially expressed gene; DMC, differentially methylated cytosine; DMR, differentially methylated region; GO term, gene ontology term; MF, molecular function; BP, biological process
Introduction
The mammary gland is an organ that is unique to mammals and essential to the survival of their young, as it produces the milk necessary to feed them. In contrast to most other organs, the mammary gland mainly develops after birth. Several key stages cause important functional and morphological changes; thus, the gland can go through repeated cycles of development and cell differentiation related to reproduction throughout the life of a mammal. Just like in most other mammals, the first postnatal phase of allometric development in the mouse occurs during puberty under the effects of multiple hormones and local growth factors [Citation1–4]. This assures that the gland is prepared for the next stage of development – pregnancy, during which functional differentiation begins [Citation5]. Ultimately, this process is finalized and the production of milk begins at parturition and continues during lactation [Citation4,Citation6]. Finally, at the end of lactation, the mammary epithelial cells (MECs), which synthesized and secreted milk components, either die as a result of apoptosis or dedifferentiate during a process known as involution [Citation5]. Involution does not completely reset MECs to their initial pre-pregnancy state. In this way, the development and function of mammary cells in a second or third lactation are affected by the very first lactation.
In order to maintain a functional organ, multiple cell types, such as epithelial, adipose, fibroblast, immune, lymphatic, and vascular cells, work together in the adult mammary gland [Citation7]. The two main cell types form the mammary epithelial bilayer: luminal and basal cells [Citation8]. Luminal cells give rise to the ductal epithelium and, during pregnancy, differentiate into alveolar cells that produce milk at parturition [Citation7]. The basal cell population contains progenitor cells [Citation9,Citation10] and differentiates into myoepithelial cells that line mammary ducts and alveoli [Citation7]. The contraction of these myoepithelial cells in response to the sucking stimulus by the progeny and the secretion of oxytocin [Citation11] is what causes the expulsion of milk from the alveoli to the mammary ducts and, ultimately, the nipple [Citation7].
Hormones, such as progesterone and prolactin, control alveologenesis and lactation by activating different signalling pathways and altering gene and protein expression [Citation12,Citation13]. This is an example of regulation of physiological processes that occurs on the molecular level; however, one type of molecular regulation is of particular interest as it is not completely understood – epigenetic regulation of the mammary gland. Recent articles have assessed the potential implications of epigenetic control in alveologenesis and lactation. Epigenetic mechanisms enhance or repress gene expression through their control of chromatin structure. These mechanisms include DNA methylation, histone modifications such as ubiquitination, methylation, phosphorylation, and microRNAs [Citation14,Citation15]. One example of epigenetics involved in the regulation of lactation is TET2, a protein involved in the modulation of DNA methylation. It is the most highly expressed TET family protein in the mammary gland [Citation16]. TET2 plays an important role in directing luminal differentiation, therefore affecting the formation of alveoli [Citation17]. Another example is PITX1, paired-like homeodomain 1, involved in the regulation of growth hormone, prolactin, and thyroid-stimulating hormone expression [Citation18]. A PITX1 CpG island is known to be hypomethylated during lactation and hypermethylated during the dry period (a period of rest between two lactations) in goats [Citation19]. DNA methylation is at least partially responsible for the regulation of lactation performance [Citation15]; however, a comprehensive study of the epigenetic changes that take place during lactation is yet to be published.
Mammals can go through multiple cycles of lactation throughout their lifetime. The number of cycles they go through can depend on their health and longevity. Thus, increasing the longevity of ruminants is very important in terms of both ethics and sustainability. Animals with a long productive life span exhibit efficient, consistent milk production and few health problems. A dairy cow usually only starts to make profit for the farmer after the second lactation and reaches its full earning potential in the third lactation [Citation20]; therefore, early culling incurs important economic losses. As such, it is important to be able to identify resilient animals, that is, animals that have high chances of completing multiple lactations.
Not all lactations are identical. For example, studies have linked survival and milk yield, showing that data collected from 1st lactation lead to more accurate predictions compared to data from 2nd lactation [Citation21–23]. Moreover, parous mammary glands, glands that have undergone a complete differentiation cycle, have a permanently altered gene expression profile because of pregnancy and lactation. This is true for multiple species. Rat parous mammary glands were shown to have a different gene expression profile compared to nulliparous glands, with an increase in markers of differentiation, cell–cell contact, and milk proteins [Citation22,Citation24]. Similar results were described in humans [Citation25] and a mouse model of parity [Citation26,Citation27].
Previously, we looked at whether inflammation disrupted these changes in either 1st or 2nd lactations, using a mammary gland inflammation mouse model described in our article [Citation28]. Briefly, mice at different lactation ranks received intramammary injections of lipopolysaccharides in order to induce inflammation, and mammary tissue was obtained 4 h post-exposure ensuring very few immune cells had infiltrated the mammary gland, thus the tissue contained mostly mammary epithelial cells. We found that while inflammation alone increased DNA methylation in either 1st or 2nd lactations, previous history of inflammation decreased DNA methylation of mammary tissue from mice in their 2nd lactation. Moreover, we reported that DMCs and DMRs we observed differed greatly depending on the current inflammation state and the previous history of the animal.
In view of these results, in this article, we aim to describe the DNA methylation and transcription pattern changes in the mouse mammary gland related to lactation and whether they persist or not during successive lactations. This allows a potential link to the longevity associated with multiple lactations. To do this we studied samples obtained from our mouse model that allowed three comparisons: physiological lactation (1st vs. 2nd lactations), lactation in pathological conditions (1st vs. 2nd lactations with inflammation), and pathological lactation with a previous history of inflammation (1st vs. 2nd lactations with inflammation in 1st lactation). These comparisons were necessary as analysis of differential DNA methylation can only be conducted in pairs; nevertheless, this analysis allowed us to study the epigenetic changes related to lactation rank in both physiological and pathological conditions.
Materials and Methods
Animals and sample collection
This study was performed in compliance with the French regulations on animal experimentation and with the authorization of the French Ministry of Agriculture. All protocols were approved by an Ethics Committee registered within the French Comité National de Réflexion Ethique sur l’Expérimentation Animale. The protocol is referenced here (visa APAFIS#12809-2017112817204811 v4) by the Comité d’éthique appliqué à l’Expérimentation Animale (COMETHEA Ethics Committee).
FVB/N mice from Janvier Labs, Le Genet-Saint-Isle, France, were housed in a specific pathogen-free (SPF) environment. Mice were allowed to mate naturally, once a female mouse reached lactation Day 7 (L7), its pups were removed 3 h before administering an analgesic (Fynadine, 10 µg/g body weight) to the mother via intraperitoneal injection. Gaseous anaesthetic (isoflurane, flow rate of 0.8 L/min O2 complemented with 1.5–2% isoflurane) was then administered to the female mouse for the length of the following procedure: intramammary injection of either 10 µL of LPS (LPS-EB Ultrapure InvivoGen, San Diego, CA, USA) at 1 mg/mL to induce inflammation or 10 µL of PBS (phosphate-buffered saline) at 1× as a control. A Hamilton syringe equipped with a metal Nanofil 100 µL tip was used to administer LPS or PBS in the inguinal mammary gland. After intramammary injection, the mouse was woken and placed in its cage. The pups were reunited with their mother 1 h postinjection (hpi) to allow the LPS or PBS to diffuse in the gland before the pups started to suck milk. Mice were observed to ensure that the injected mammary glands were suckled before sampling.
Mammary glands were removed at 4 hpi. For the first lactation, the right mammary gland was removed via surgical biopsy under gas anaesthesia, and the animal was then returned to its cage. Thirty days later, the mice were mated once again. At L7 of the second lactation, LPS was injected into the left inguinal mammary gland. After 4 h, the mice were euthanized, and the glands were removed (a schematic representation is available in our previous article [Citation28]). This allowed us to obtain samples from first (L1) or second (L2) lactation, with (I) or without (NI) inflammation: L1-I (n = 5), L1-NI (n = 7), L2-I (L1-NI) (n = 5), L2-NI (L1-NI) (n = 7), L2-I (L1-I) (n = 7), and L2-NI (L1-I) (n = 5) (Figure. S1). All cases of inflammation discussed in this article correspond to this 4-h exposure of the mammary gland to LPS.
The lymphatic ganglion was removed from each mammary gland. For nucleotide extraction, tissues were frozen in liquid nitrogen and stored at −80°C.
Genomic DNA extraction
Thirty to 40 mg of frozen mammary tissue was ground using a mortar and pestle. The powder was then transferred to Eppendorf tubes and stored at −80°C until DNA extraction. On the day of the extraction, the entirety of the powdered mammary tissue was transferred to a 5 mL Eppendorf tube and incubated overnight at 55°C in 1 mL lysis buffer (10 mM Tris-HCl, pH 7.4, 0.2% SDS, 10 mM EDTA, 50 mM NaCl) in the presence of 200 µg/mL proteinase K. After incubation with 25 µg/mL RNase A for 1 h at 37°C, 200 µg/mL proteinase K was added for 90 min at 42°C to inactivate the RNase A. DNA was then extracted using 1 volume (vol) of phenol:chloroform:isoamyl alcohol (50:49:1) for every volume of lysis buffer. The aqueous phase was recovered after centrifugation for 5 min at 12 000 g and at room temperature (RT). One volume of chloroform was added to every 1 vol of lysis buffer, and the liquid phase was again recovered after centrifugation for 5 min at 12 000 g and RT. Then, 0.2 M NaCl was added, followed by 2.5 vol of cold 100% ethanol. The precipitated gDNA was recovered using the tip of a Pasteur pipette and dried; it was then placed into a new tube containing 150 µL of sterile water, and the gDNA was left to dissolve for 24–48 h at 4°C. DNA concentration was measured using Nanodrop and Qubit (dsDNA BR assay kit, Invitrogen, Waltham, MA, USA) according to the manufacturer’s instructions. The integrity of the extracted DNA was verified using 0.7% agarose gel electrophoresis in 1× TBE and migration for 1 h at 100 V. Genomic DNA was stored at 4°C in the short term and −20°C in the long term.
RNA extraction
Two hundred milligrams of frozen mammary tissue was placed in a tube containing 1 mL of RNA NOW and then homogenized using an Ultra-Turrax® (IKA, Staufen, Germany) to lyse the cells. This solution was transferred to a different tube containing 200 µL of chloroform, mixed gently, and incubated for 5 min on ice. The samples were then centrifuged for 10 min at 15 000 g, and the liquid phases were transferred to tubes containing 1 mL of isopropanol and then mixed gently. Samples were then incubated overnight at −20°C before a second centrifugation for 10 min at 15 000 g and 4°C. The supernatant was eliminated, and 1 mL of 75% ethanol was added to wash the RNA pellet. The tubes were vortexed and centrifuged for 5 min at 5000 g and 4°C. The supernatant was removed, and the pellet was dried for 10–15 min at RT. The RNA pellet was dissolved in 100 µL of sterile water. The RNA concentration was measured using a NanoDropTM OneTM (Thermo Scientific, Waltham, MA, USA).
Extracted RNA was treated with DNase using the rDNase set kit (Macherey-Nagel, Düren, Germany) according to the manufacturer’s instructions. Treated RNA was then purified using the NucleoSpin RNA Clean-up kit (Macherey-Nagel, Düren, Germany) according to the manufacturer’s instructions. RINs were calculated for each sample using the RNA 6000 Nano kit (Agilent, Santa Clara, CA, USA) and the 2100 Bioanalyzer (Agilent, Santa Clara, CA, USA) according to the manufacturer’s instructions. Samples with RIN higher than 8 were used for further experiments [Citation29].
Reverse transcription and real-time quantitative PCR
The primers used in this study as well as reaction efficiencies are listed in our previous paper [Citation28]. PCR-primer pairs were designed from mRNA sequences of the studied genes provided by the National Center for Biotechnology Information (NCBI) gene database using PrimerBlast. Results were retained if the reaction efficiency was between 80% and 110%. The optimal Tm at 60°C and exon junction span were selected. The primers were ordered at 100 µM concentration from Eurofins Genomics, Ebersberg, Germany.
One microgram of extracted RNA was retrotranscribed using the SuperScriptTM VILOTM cDNA synthesis kit (Thermo Fisher, Waltham, MA, USA) according to the manufacturer’s instructions. For Fluidigm PCR, cDNA was preamplified according to Fluidigm’s protocol (quick reference PN 100–5875 B1). Preamplified cDNA was then diluted fivefold with Tris-EDTA buffer. Gene expression levels were measured on 48 × 48 GE Dynamic Array IFC using the Fluidigm BioMarkTM HD System. Fold changes were calculated by the ∆∆Ct method using ‘Fluidigm Real-Time PCR Analysis’ software. The reference genes used were GAPDH, CPR2, and HPRT1 [Citation30]. Each expression value was normalized to one reference sample – mammary tissue from the first lactation with inflammation. This allowed for a more reliable reference for genes whose expression is activated by inflammation.
Reduced Representation Bisulfite Sequencing (RRBS)
RRBS libraries were prepared according to [Citation31] modified by [Citation31,Citation32]. Briefly, RRBS libraries were prepared using an RRBS-adapted protocol for which all the steps were automated on a robot (NGS STARlet, Hamilton, Bonaduz, Switzerland) as previously described [Citation33]. After MspI cleavage of gDNA (200 ng), end-repair and ligation to 55 bp Illumina adapters for subsequent PCR amplification and paired-end sequencing, size selection was performed using SPRIselect magnetic beads (Beckman Coulter Life Sciences, Villepinte, France). Fragments ranging from 150 to 400 bp (genomic fragments of 40–290 bp with adapters) were selected and submitted to two consecutive bisulphite conversions with the EpiTect bisulphite kit (Qiagen, Les Ulis, France) following the manufacturer’s instructions. The libraries were produced by amplification with Pfu Turbo Cx hotstart DNA polymerase (Agilent Technologies, Les Ulis, France) using 14 PCR cycles and purified using AMPure XP beads (Beckman Coulter Life Sciences, Villepinte, France). All libraries were sequenced on an Illumina HiSeq4000 sequencer to produce 75 bp paired-end reads (Integragen SA, Evry, France).
Bioinformatics and statistical analyses
Bioinformatics and statistical analyses were performed using a home-made pipeline according to Perrier J-P et al. [Citation32] and Costes et al. [Citation34]. Quality checks and trimming were performed using TrimGalore v0.4.5, which removed adapter sequences, poor-quality bases and reads (Phred score below 20), and reads shorter than 20 nucleotides. High-quality reads were aligned to the mouse reference genome GRCm38 primary assembly (Ensembl 100) using Bismark_v0.20.0 [Citation35], which uses Bowtie 1.2.1.1 alignment software [Citation36]. The bisulphite conversion rate was estimated from the unmethylated cytosine added in vitro during the end-repair step and was ≥99.5%. The CpGs were then selected based on their coverage by uniquely mapped reads. Around 1,273,950 CpGs covered by at least 10 uniquely mapped reads (CpG10) were retained for subsequent analyses. The total of these CpGs was named ‘background.’ Each CpG10 was assigned a methylation percentage per sample calculated from Bismark methylation calling (Bismark v0.20.0). Quality control values (mapping efficiency, coverage, and average methylation at CpG10) were analysed for each library group: L1-I, L1-NI, L2-I (L1-NI), L2-NI (L1-NI), L2-I (L1-I), and L2-NI (L1-I), summed up in our previous article [Citation28]. Correlation hierarchical clustering was computed on the matrix of methylation percentages for each CpG10 covered in at least four mice per group.
Only CpGs covered by at least 20 uniquely mapped reads (CpG20) were retained for differential methylation analysis performed using methylKit [Citation37]. A CpG20 was considered a DMC when the adjusted P value was less than 0.1 and the methylation difference between the two groups was at least 15%. A DMR was constituted by a minimum of three DMCs with a maximum inter-DMC distance of 100 bp.
The annotation of the DMCs, DMRs, and the ‘background’ was performed as described in [Citation33,Citation33] relative to gene features, CpG density, and repetitive elements using an in-house pipeline. The reference files were downloaded at the following sites http://ftp.ensembl.org/pub/release100/gtf/mus_musculus/Mus_musculus.GRCm38.100.gtf.gz,http://apr2020.archive.ensembl.org/biomart/martview/db614f58c20a42c0d2cb13bcedf364f8 [Ensembl Genes 100, mouse genes (GRCm38.p6)], http://hgdownload.soe.ucsc.edu/goldenPath/mm10/database/cpgIslandExt.txt.gz and http://hgdownload.soe.ucsc.edu/goldenPath/mm10/database/rmsk.txt.gz. The following criteria were applied: transcription start site (TSS), −100 to +100 bp relative to the TSS; promoter, −2000 to +100 bp relative to the TSS; transcription termination site (TTS): −100 to +100 bp relative to the TTS; shore, up to 2000 bp from a CpG island (CGI); and shelf, up to 2000 bp from a shore. A site/fragment was considered to belong to a CGI (respective shore and shelf) if an overlap of at least 75% was observed between the site/fragment and the CGI (respective shore and shelf). A site/fragment was considered overlapped by a repetitive element, regardless of the extent of this overlap. DMCs were subjected to enrichment analyses of the Database for Annotation, Visualization, and Integrated Discovery (DAVID) using the ‘background’ as a reference genome [Citation38,Citation39].
Results
Changes in the methylome of mammary tissue between first and second lactations
In order to find epigenetic marks related to lactation, we focused on the DNA methylation changes that occur naturally in mammary tissue during two successive physiological lactations. To do this, we analysed seven samples without inflammation (NI) from the first lactation and 7 NI samples from the second lactation using RRBS. The validation of our mouse model and the quality control of the RRBS libraries generated are described in our previous article [Citation28]. We identified lactation rank-related DMCs and DMRs by pairwise comparisons between L1-NI vs. L2-NI (L1-NI) (). The comparison of the first vs. second lactation resulted in the identification of 1981 DMCs and 97 DMRs from which 82.7% and 92.9%, respectively, were downmethylated for the L2-NI (L1-NI) group.
Table 1. The total number of DMCs and DMRs and the per cent upmethylation found in all three comparisons: 1st lactation (n = 7) vs. 2nd lactation (n = 7) (blue), 1st lactation (n = 5) vs. 2nd lactation with inflammation (n = 5) (green), and 1st lactation (n = 5) vs. 2nd lactation with inflammation and previous inflammation history (n = 7) (red).
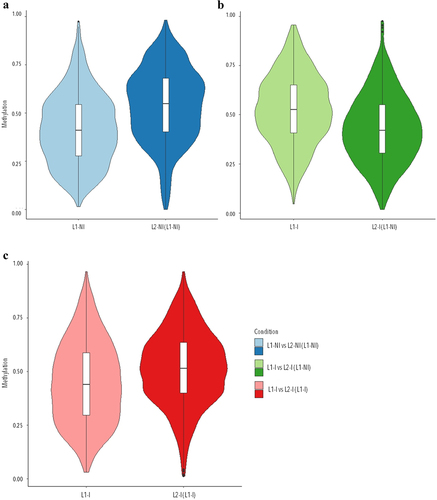
We then looked at the overall methylation levels in each condition (). We found few hypomethylated (methylation at <20%) or hypermethylated (methylation at >80%) DMCs, and instead we observed that the majority of DNA methylation in mammary tissue from 1st vs. 2nd lactation in physiological conditions remains at the intermediate level.
Figure 1. Violin plots of the overall distribution of methylation levels in all three comparisons: 1st lactation (n = 7) vs. 2nd lactation (n = 7) (blue), 1st (n = 5) vs. 2nd lactation with inflammation (n = 5) (green), and 1st (n = 5) vs. 2nd lactation with inflammation and previous inflammation history (n = 7) (red). The abscissa represents the different conditions in each comparison, the ordinate represents the level of methylation of the DMCs in that condition, and each violin represents the density of the point at that methylation level.
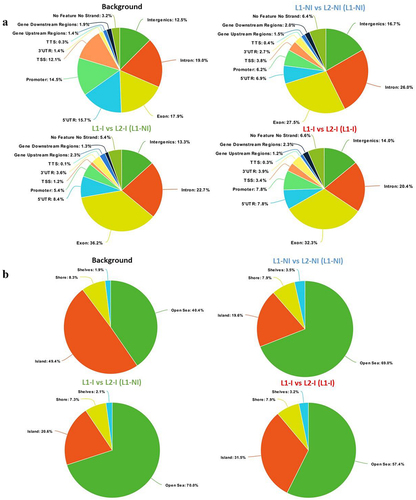
To characterize whether specific genomic features are enriched in the identified DMCs, we annotated the DMCs found for each comparison (). The background is the set of CpGs20 analysed by RRBS (total number of CpGs20) and serves as a control to research for enrichment in genomic regions targeted by DMCs. Compared to the genomic distribution of the background CpGs20, DMCs observed from comparing 1st and 2nd lactations more often targeted exons and introns (27.5% vs. 17.9% and 26% vs. 19%, respectively). On the other hand, promoters, TSS, and UTRs of genes were less represented. Furthermore, there was a depletion in CGIs accompanied by an enrichment in open sea (), indicating that the majority of identified DMCs are dispersed over the genome outside CpG islands. Annotating DMCs also showed a depletion in low complexity and simple repeats; meanwhile, LTRs and SINEs were enriched compared to the background (). A list of annotated DMCs and DMRs is available in Table S1.
Figure 2. Pie charts showing the distribution of DMCs for all three comparisons: 1st lactation (n = 7) vs. 2nd lactation (n = 7) (blue), 1st (n = 5) vs. 2nd lactation with inflammation (n = 5) (green), and 1st (n = 5) vs. 2nd lactation with inflammation and previous inflammation history (n = 7) (red). Distribution is shown according to gene regions (a), CpG density (b), and repeats (c). All three comparisons are discussed in comparison to the background (control comprised of all CpGs found after RRBS analysis).
To investigate whether specific gene ontology (GO) terms or signalling pathways were enriched because of lactation rank, we used DAVID functional clustering on DMCs from L1-NI vs. L2-NI (L1-NI). We focused on the GO terms corresponding to molecular function (MF) and biological processes (BP) (). Notably, DMCs identified from the comparison were significantly enriched for MFs such as DNA binding and transcription factor activity. As for BPs, the comparison was enriched for multicellular organism development, positive and negative regulation of transcription, as well as canonical Wnt signalling. When it came to signalling pathways (), DMCs specific to comparing two lactations (L1-NI vs. L2-NI (L1-NI)) were significantly enriched for Wnt, cAMP, and regulation of lipid metabolism by PPARα, all of which play a role in mammary gland development and lactation [Citation5,Citation27,Citation40].
Table 2. Molecular function and biological processes GO (gene ontology) terms (MF: molecular function; BP: biological process) as well as signalling pathways enriched by DAVID analysis for all three comparisons: 1st lactation (n = 7) vs. 2nd lactation (n = 7) (blue), 1st lactation (n = 5) vs. 2nd lactation with inflammation (n = 5) (green), and 1st lactation (n = 5) vs. 2nd lactation with inflammation and previous inflammation history (n = 7) (red).
Gene expression changes in mammary tissue between first and second lactations
To determine the effect of lactation rank on epigenetic regulation and mammary gland function, we analysed the expression of 33 genes via RT-qPCR. First, we looked at the expression of 13 genes known to be important in epigenetic regulation. Differentially expressed genes (DEGs) were identified by pairwise comparisons between 1st and 2nd lactations (L1-NI vs. L2-NI (L1-NI)) (). Of the 13 genes analysed, the expression of genes linked to DNA methylation regulation (Dnmt3A, Dnmt3B, Dnmt3L, Dnmt1) was not modified (data not shown). These results are in agreement with the limited modulation of methylation observed and the low number of DMCs identified. However, two genes linked to epigenetic regulation were differentially expressed, HMTset7 and JMJD2D. The average fold change for HMTset7 was 5.24 (±2.73) for L1-NI and 10.35 (±3.27) for L2-NI (L1-NI). For JMJ2D, the average fold change was 3.62 (±3.91) for L1-NI and 0.27 (±0.25) for L2-NI (L1-NI).
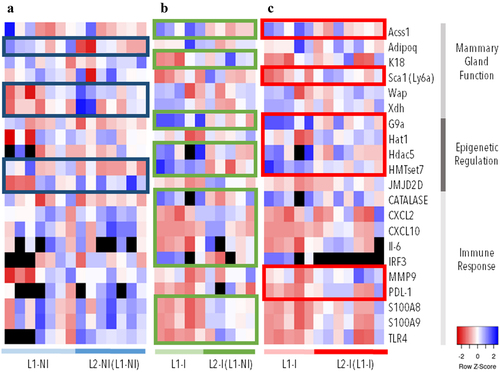
Figure 3. Gene expression (∆∆Ct) in three comparisons: 1st (n = 7) vs. 2nd lactations in physiological conditions (n = 7) (blue), 1st (n = 5) vs. 2nd lactations with inflammation (n = 5) (green), and 1st (n = 5) vs. 2nd lactations with inflammation and previous inflammation history (n = 7) (red). The expression of 60 genes was analysed. The genes listed in this figure are differentially expressed (p < 0.05) in at least one comparison (colour-coded rectangles). Each column represents one individual. Lowest gene expression is represented in blue (highest ∆∆Ct values), highest – in red (lowest ∆∆Ct values), no data available – in black.
Next, we looked at whether lactation rank affected mammary gland function by analysing the expression of 20 genes known to be important in lactation. Of the 20 genes analysed, 3 DEGs were identified between 1st and 2nd lactations, Adipoq, Wap, and Xdh (). Their average fold change was, respectively, 0.74 (±0.31), 8.05 (±10.08), and 2.21 (±0.61) for L1-NI and 1.53 (±0.8), 1.48 (±1.04), and 1.47 (±0.77) for L2-NI (L1-NI). The average ΔΔCt and fold change values for all DEGs are available in Table S2.
Changes in the methylome of mammary tissue between first and second lactations in the presence of inflammation
Next, we decided to focus on the DNA methylation changes induced by inflammation in interaction with the lactation rank. To do this, we compared five samples from 1st lactation with inflammation (L1-I) to five samples from 2nd lactation with inflammation (L2-I (L1-NI)). We also looked at whether previous inflammation history in 1st lactation would affect the results we observed in 2nd lactation (L1-I vs. L2-I (L1-I)).
We found that comparing the methylome of samples with inflammation in 1st or 2nd lactations (L1-I vs. L2-I (L1-NI)) resulted in the identification of 964 DMCs and 55 DMRs from which 76.1% and 81.8%, respectively, were upmethylated for the L1-I group ().
If the animals had also gone through previous inflammation during their 1st lactation (L1-I vs. L2-I (L1-I)), then 2590 DMCs and 153 DMRs were identified. From these, 33.4% and 22.2%, respectively, were upmethylated for the L1-I group (). This last comparison, which combined the effects of lactation rank, inflammation, and previous inflammation history, is the one that allowed the identification of the most DMCs and DMRs compared to other comparisons.
We looked at the methylation levels of DMCs from each condition in the comparisons (). Similarly, for methylation levels in mammary tissue from 1st vs. 2nd lactations in physiological conditions, the majority of DMCs were methylated at the intermediate level, which is between 20% and 80%. Interestingly, mammary tissue presented with a loss of methylation in 2nd lactation, in the presence of inflammation; this is the opposite of the gain of methylation in mammary tissue observed in physiological conditions. While the animals had also gone through a previous inflammation in 1st lactation, mammary tissue once again gained methylation in 2nd lactation.
As previously presented for the comparison of L1-NI vs. L2-NI (L1-NI), the genomic distribution of DMCs from these two new comparisons was analysed. When it came to the enrichment of genomic regions (), DMCs from the two comparisons with inflammation targeted more exonic regions (36.2% and 32.3%) compared to DMCs from physiological lactation (27.5%) and the background (17.9%). This enrichment came at the expense of TSS and promoter regions in comparison to the background, but, interestingly, not physiological lactation, which resembled the two other comparisons in terms of TSS and promoter regions. Moreover, 3’UTR were doubled in all comparisons compared to the background, whereas 5’UTR were reduced by at least one-third. The association with CpG islands was also described (). The percentage of DMCs found in shores and shelves was very similar between the background and all three comparisons. The percentage of DMCs in the open sea was increased in the comparisons compared to the background, at the expense of DMCs in CGIs. Interestingly, the comparison L1 vs. L2-I (L1-I) had the most DMCs in CGIs compared to the other two, suggesting that the presence of inflammation combined with a previous inflammation history affects CGI methylation level. As for the distribution of DMCs in genomic repeats regions (), all three comparisons had very similar profiles: enrichment in LTRs and SINEs, at the expense of low complexity and simple repeats regions.
To investigate whether specific gene ontology (GO) terms or signalling pathways were enriched as a result of lactation rank, inflammation, and inflammation history, we used DAVID functional clustering on DMCs from the comparisons related to pathological lactation: L1 vs. L2-I (L1-NI) and L1 vs. L2-I (L1-I) (). We first focused on GO terms related to MF and BP (). We found no significantly enriched MFs related to DNA binding or transcription for the L1 vs. L2-I (L1-NI) comparison. On the other hand, L1 vs. L2-I (L1-I) was also significantly enriched for DNA binding, as well as transcription factor activity. When it came to BPs, both comparisons in 2nd lactation with inflammation were significantly enriched for multicellular organism development. No other BPs were significantly enriched for the comparison of L1 vs. L2-I (L1-NI). L1 vs. L2-I (L1-I) was significantly enriched for most of the same BPs as for the comparison of two physiological lactations. The two exceptions were cell–cell signalling and lipid transport, which were only enriched when inflammation was present. We also looked at which signalling pathways were enriched in DMCs identified from our comparisons (). The comparison of pathological lactations (L1 vs. L2-I (L1-NI)) was enriched for Wnt signalling pathway, but lacked cAMP signalling pathway and regulation of lipid metabolism, which were enriched in physiological lactations. When inflammation history was an additional factor (L1 vs. L2-I (L1-I)), Wnt, CAMP and regulation of pluripotency of stem cells signalling pathways were enriched, but not regulation of lipid metabolism.
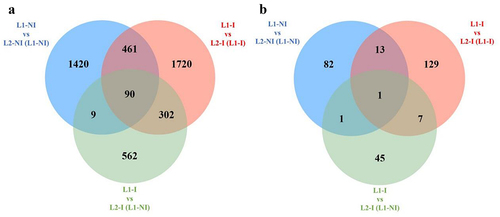
Finally, we examined whether our three comparisons had any DMCs and DMRs in common. We used a Venn diagram to show any shared epigenetic changes (). Only 90 DMCs were found to be common between all three comparisons, whereas more than five times that many (461) were found to be common between only L1-NI vs. L2-NI (L1-NI) and L1-I vs. L2-I (L1-I). Similarly, 302 DMCs were shared only between L1-I vs. L2-I (L1-NI) and L1-I vs. L2-I (L1-I). This suggests a similarity between L1-I vs. L2-I (L1-I) and the other two comparisons that is not shared between themselves, as shown by the very few (9) DMCs they have in common. When it comes to DMRs, only one was shared between all three comparisons. Once again, L1-I vs. L2-I (L1-I) is closer to the remaining two comparisons (13 and 7 DMRs in common) than they are between themselves (only 1 DMR in common).
Figure 4. Venn diagrams of the total number of differentially methylated cytosines (DMCs) as well as shared DMCs in three comparisons: 1st lactation (n = 7) vs. 2nd lactation (n = 7) (blue), 1st (n = 5) vs. 2nd lactation with inflammation (n = 5) (green), and 1st (n = 5) vs. 2nd lactation with inflammation and previous inflammation history (n = 7) (red) (a), as well as the total number of differentially methylated regions (DMRs) and shared DMRs in all three comparisons (b).
Gene expression changes in mammary tissue between first and second lactations in the presence of inflammation
To determine the effects of both lactation rank and inflammation on epigenetic regulation, mammary gland function, and the immune response, we analysed the expression of 63 genes via RT-qPCR. First, we looked at the expression of 13 genes known to be important in epigenetic regulation. Differentially expressed genes (DEGs) were identified by pairwise comparisons between 1st and 2nd lactations with inflammation (L1-I vs. L2-I (L1-NI)) () and 1st and 2nd lactations with previous inflammation history (L1-I vs. L2-I (L1-I)) (). Of the 13 genes analysed, 3 were differentially expressed in L1-I vs. L2-I (L1-NI) and 4 in L1-I vs. L2-I (L1-I). Three of these DEGs were shared between the two comparisons, G9a, Hdac5, and HMTset7. Only one DEG was shared between all three comparisons, HMTset7.
We then looked at whether lactation rank and inflammation affected mammary gland function by analysing the expression of 20 genes with an important role in lactation. Both comparisons of lactation in pathological conditions had 2 DEGs of the 20 genes analysed. For L1-I vs. L2-I (L1-NI) these were Acss1 and K18, whereas for L1-I vs. L2-I (L1-I), they were Acss1 and Sca1 (). Lactation in pathological conditions had no DEGs in common with physiological lactation.
Finally, we analysed the effect of lactation rank and inflammation on 27 genes involved in the immune response. Interestingly, the two comparisons of lactation in pathological conditions had no shared DEGs in this category, indicating that previous inflammation history influences future gene expression. L1-I vs. L2-I (L1-NI) had the most DEGs involved in the immune response, 8; whereas, L1-I vs. L2-I (L1-I) only had two. The average ΔΔCt and fold change values for all DEGs are available in Table S2.
Discussion
In this article, we aim to describe the main DNA methylation changes that occur in mammary tissue during lactation and to investigate whether they persist or differ in successive lactations (L1-NI vs. L2-NI (L1-NI)). Furthermore, we look at how these epigenetic changes are affected by the introduction of inflammation during lactation (L1-I vs. L2-I (L1-NI)) and whether inflammation history (L1-I vs. L2-I (L1-I)) changes the outcome.
In our previous article [Citation28], we focused on DNA methylation changes induced by inflammation in mammary tissue in either 1st or 2nd lactations. We concluded that lactation rank was just as, if not more important than inflammation in the regulation of DNA methylation in the mammary gland. We found that while inflammation alone increased DNA methylation in either 1st or 2nd lactations, previous history of inflammation decreased DNA methylation of mammary tissue from mice in their 2nd lactation. Moreover, we reported that DMCs and DMRs we observed differed greatly depending on the current inflammation state and the previous history of the animal.
Our data show that lactation rank could influence the response to induced inflammation. Therefore, we decided to examine the DNA methylation patterns that occur physiologically during two successive lactations (L1-NI vs. L2-NI (L1-NI)). In physiological conditions, the majority of DMCs exhibited an increase in methylation levels with the lactation rank (82.7% of DMCs were upmethylated in 2nd lactation compared to 1st), showing an important difference between two successive lactations. In pathological conditions, comparing 1st to 2nd lactations with inflammation (L1-I vs. L2-I (L1-NI)), we found half as many DMCs compared to physiological conditions (964 and 1981 DMCs, respectively). Moreover, these DMCs were majority downmethylated in the 2nd lactation group (76.1%). This shows that the evolution of methylation state between 1st and 2nd lactation exhibits contrasted patterns with a gain of methylation in physiological conditions and a loss of methylation in pathological conditions as illustrated in .
Our last comparison, 1st vs. 2nd lactations with inflammation and previous inflammation history (L1-I vs. L2-I (L1-I)), is where we found the most DMCs (2590). Furthermore, these DMCs were majority upmethylated in the 2nd lactation group (66.6%). This confirms our previous report that inflammation history changes the outcome of DNA methylation regulation in the mammary gland. Together, our results show that the methylome reflects the physiological changes occurring throughout the shift in lactation rank and inflammatory status.
It is interesting to note that comparing 1st to 2nd lactations with inflammation (L1-I vs. L2-I (L1-NI)) had 302 DMCs in common with 1st vs. 2nd lactation with inflammation and previous inflammation history (L1-I vs. L2-I (L1-I)), but only 9 DMCs in common with 1st vs. 2nd lactations in physiological conditions (L1-NI vs. L2-NI (L1-NI)). Meanwhile, L1-I vs. L2-I (L1-I) and L1-NI vs. L2-NI (L1-NI) had 461 DMCs in common. This along with the methylation levels shown in suggests that, at least in terms of methylation changes, mammary tissue of mice with previous inflammation history is more similar to mammary tissue in physiological lactation than mammary tissue with first-time inflammation. This could indicate that mammary cells that have experienced inflammation in 1st lactation are more resilient when confronted with inflammation in 2nd lactation, compared to mammary cells in 2nd lactation undergoing inflammation for the first time.
Out of all the DMCs we identified, 90 were shared between all three comparisons presented in this article (). This means that the majority of identified DMCs are specific to the comparison in which they were found 71% of DMCs were specific to L1-NI vs. L2-NI (L1-NI), 58% to L1-I vs. L2-I (L1-NI), and 67% to L1-I vs. L2-I (L1-I). Of the 90 shared DMCs, one DMR was identified corresponding to a predicted gene (Gm28802) whose role has not been studied. Outside of this one DMR, others were shared between two, but not all three comparisons presented in this article. These results show that, since few DMCs persist, DMCs in mammary tissue differ depending on lactation rank, presence of inflammation, and previous inflammation history.
When comparing successive physiological lactations (L1-NI vs. L2-NI (L1-NI)) and lactations with inflammation (L1-I vs. L2-I (L1-NI)), we identified nine DMCs. Of these, one DMR was found corresponding to the gene Fignl2 (fidgetin-like 2). This gene codes for a protein that enables microtubule-severing ATPase activity and is involved in microtubule organization [Citation41]. It modulates mitosis [Citation42], regulates the orientation of cell migration [Citation43] and plays a role in wound healing [Citation44]. There are no reports of the role of Fignl2 in the mammary gland.
On the other hand, comparing successive physiological lactations (L1-NI vs. L2-NI (L1-NI)) and lactations with inflammation and previous inflammation history (L1-I vs. L2-I (L1-I)) resulted in the identification of 13 DMRs. These included, H13 (histocompatibility minor 13) and Meg3 (maternally expressed 3). H13 is a protein-coding gene that plays a role in the immune response [Citation45] and Meg3 is a long non-coding RNA and a tumour suppressor [Citation46] in multiple cancers, including breast cancer.
Comparing successive lactations with inflammation (L1-I vs. L2-I (L1-NI)) and lactations with inflammation and previous inflammation history (L1-I vs. L2-I (L1-I)) gave us seven DMRs in common. These DMRs included PPARδ, a gene we discussed in our previous article [Citation28], that was differentially methylated when comparing inflammation vs. control in 1st lactation. This gene is involved in lipid metabolism [Citation47] and its inhibition leads to a reduction in milk fat synthesis [Citation48]. Multiple studies show that fat content in milk is reduced in women [Citation49], sheep [Citation50], and cows [Citation51] with mastitis. Our results suggest that DNA methylation may play a role in this process.
We used the DMCs identified in all three comparisons to perform enrichment analysis () and identify potential functions and signalling pathways of interest. We discovered that DMCs were only significantly enriched for the MFs DNA binding and transcription factor activity in successive physiological lactations (L1-NI vs. L2-NI (L1-NI)) and lactations with inflammation and previous inflammation history (L1-I vs. L2-I (L1-I)). This suggests transcription might be less affected in L1-I vs. L2-I (L1-NI), or affected later than 4 h post-exposure to LPS. Moreover, this once again shows that a history of mammary inflammation changes the epigenetic outcome and the molecular functions of mammary cells, making it more similar to physiological lactation (L1-NI vs. L2-NI (L1-NI)) than to first-time inflammation (L1-I vs. L2-I (L1-NI)). As for BPs, all three comparisons were significantly enriched for multicellular organism development. However, they differed when it came to regulation of transcription, cell–cell signalling, and lipid transport. This shows that DNA methylation is involved in multiple cellular processes regardless of lactation rank or the presence of inflammation. All three comparisons were also significantly enriched for the Wnt signalling pathway, suggesting a role for DNA methylation in mammary development [Citation52] through the Wnt pathway that is not affected by lactation rank or inflammation. Only the comparisons in pathological condition were significantly enriched for pathways involved in the regulation of the pluripotency of stem cells, suggesting a renewal of multiple types of mammary cells in order to compensate for any cells lost during the inflammation. Only successive physiological lactations (L1-NI vs. L2-NI (L1-NI)) were enriched for regulation of lipid metabolism. The loss of this methylation in the comparisons with inflammation could be explained by the changes in resource allocation in the mammary gland in order to account for the activation of inflammation pathways.
We found that even though all three comparisons presented important DNA methylation changes that did not affect mammary gland function. Out of the 20 genes whose expression is essential for mammary gland function, only 6 genes were differentially expressed. When comparing successive physiological lactations (L1-NI vs. L2-NI (L1-NI)), we found three DEGs, Adipoq, Wap, and Xdh, once again showing that the two lactations are not identical. Interestingly, when inflammation was involved (L1-I vs. L2-I (L1-NI) and L1-I vs. L2-I (L1-I)), these three DEGs were not found; instead, we found Acss1, K18 and Acss1, Sca1, respectively, to be differentially expressed.
We also focused on the expression of genes related to important epigenetic regulation. In successive physiological lactations (L1-NI vs. L2-NI (L1-NI)), we found that HMTset7 was overexpressed in 2nd lactation compared to 1st; whereas the opposite was true for JMJD2D, which was underexpressed in 2nd compared to 1st lactation. These two genes are a histone methylase and a lysine-specific demethylase, respectively. This suggests that other types of epigenetic regulation are also affected by lactation rank. The comparisons with inflammation (L1-I vs. L2-I (L1-NI) and L1-I vs. L2-I (L1-I)) contained more DEGs, 3 and 4, respectively. These include Hdac5, a histone deacetylase, which is overexpressed in 2nd lactation in both comparisons. We already know that histone acetylation and proteins in the HDAC family are involved in the regulation of inflammatory gene transcription [Citation53]. Our results confirm these findings and show that DNA methylation is not the only type of epigenetic regulation that plays a role in the mammary tissue response to inflammation. Moreover, this could explain why the two comparisons with inflammation have fewer DMCs than comparing successive physiological lactations.
Finally, we explored the expression of genes related to the immune response. We found no DEGs when comparing successive physiological lactations; however, we found eight DEGs when comparing 1st to 2nd lactations with inflammation (L1-I vs. L2-I (L1-NI)) and two DEGs when there was previous inflammation history (L1-I vs. L2-I (L1-I)). Interestingly, there were no DEGs in common between the two comparisons. The fact that there are fewer and different DEGs when there was previous inflammation history might suggest that mammary cells, having previously encountered LPS, are more resilient to a 2nd exposure during 2nd lactation.
The results presented in this article demonstrate that two successive lactations in physiological conditions are not identical; in fact, a 2nd lactation introduces more DNA methylation changes than the onset of inflammation. Moreover, the comparisons of 1st to 2nd lactations with and without previous inflammation history allowed us to determine that an exposure to inflammation in 1st lactation makes mammary cells more resilient to inflammation in 2nd lactation. In fact, in terms of DNA methylation, L1-I vs. L2-I (L1-I) is more similar to physiological lactation than L1-I vs. L2-I (L1-NI) is. Therefore, we conclude that few DNA methylation changes persist in successive lactations. Moreover, the introduction of inflammation further changes epigenetic marks with a difference in the DMCs observed in animals with previous inflammation history. It is important to note that the results presented here correspond to asymptomatic inflammation (4 h post-exposure to LPS) and that studying the methylation status of mammary tissue at a more advanced stage of the immune response could yield different results. Nevertheless, an in-depth analysis of changes in promoter regions, closely related to gene expression, and a functional validation of the DMRs mentioned here would expand on this research. In the long term, this information could lead to a better understanding of the epigenetic regulation of lactation in both physiological and pathological conditions. This, in turn, could lead to more informed choices in the early detection of mastitis.
Author contributions
Elitsa Ivanova performed experiments and wrote the manuscript. Clémence De Casanove, Johan Castille, and Johann Laubier performed the experiments. Aurélie Chaulot-Talmon conducted RRBS libraries construction and sequences banking. Anne Aubert-Frambourg helped with data analysis and generating manuscript figures. Pierre Germon and Hélène Jammes discussed the results and edited the manuscript. Cathy Hue-Beauvais and Fabienne Le Provost conceived the study, coordinated the experiments, and edited the manuscript.
Supplemental Material
Download Zip (1,014.9 KB)Acknowledgments
This work has benefitted from the facilities and expertise of @Bridge (GABI, INRAE, AgroParisTech, Université Paris-Saclay, 78350 Jouy-en-Josas, France). The mice used in this study were under the care of the staff of UE 0907 IERP Infectiologie Expérimentale des Rongeurs et Poissons (INRAE, Jouy-en-Josas, France).
Disclosure statement
No potential conflict of interest was reported by the authors.
Data availability statement
RRBS fastq files have been deposited in the European Nucleotide Archive (ENA) at EMBL-EBI under accession number PRJEB57878 https://www.ebi.ac.uk/ena/data/view/PRJEB57878.
Supplementary material
Supplemental data for this article can be accessed online at https://doi.org/10.1080/15592294.2023.2215620.
Additional information
Funding
References
- Hovey RC, Trott JF, Vonderhaar BK. Establishing a framework for the functional mammary gland: from endocrinology to morphology. J Mammary Gland Biol Neoplasia. 2002;7(1):17–17.
- Howlin J, McBryan J, Martin F. Pubertal mammary gland development: insights from mouse models. J Mammary Gland Biol Neoplasia. 2006;11(3–4):283–297.
- Kleinberg DL, Ruan W. IGF-I, GH, and sex steroid effects in normal mammary gland development. J Mammary Gland Biol Neoplasia. 2008;13(4):353–360.
- Oakes SR, Rogers RL, Naylor MJ, et al. Prolactin regulation of mammary gland development. J Mammary Gland Biol Neoplasia. 2008;13(1):13–28.
- Anderson SM, Rudolph MC, McManaman JL, et al. Key stages in mammary gland development. Secretory activation in the mammary gland: it’s not just about milk protein synthesis! Breast Cancer Res. 2007;9(1):204.
- Casey TM, Plaut K. The role of glucocorticoids in secretory activation and milk secretion, a historical perspective. J Mammary Gland Biol Neoplasia. 2007;12(4):293–304.
- Inman JL, Robertson C, Mott JD, et al. Mammary gland development: cell fate specification, stem cells and the microenvironment. Development. 2015;142(6):1028–1042.
- Lloyd-Lewis B, Harris OB, Watson CJ, et al. Mammary stem cells: premise, properties, and perspectives. Trends Cell Biol. 2017;27(8):556–567.
- Shackleton M, Vaillant F, Simpson KJ, et al. Generation of a functional mammary gland from a single stem cell. Nature. 2006;439(7072):84–88.
- Stingl J, Eirew P, Ricketson I, et al. Purification and unique properties of mammary epithelial stem cells. Nature. 2006;439(7079):993–997.
- Leng G, Caquineau C, Sabatier N. Regulation of Oxytocin Secretion. In: Vitamins & Hormones. Vol. 71. Elsevier; 2005. p. 27–58. DOI:10.1016/S0083-6729(05)71002-5
- Brisken C, Kaur S, Chavarria TE, et al. Prolactin controls mammary gland development via direct and indirect mechanisms. Dev Biology. 1999;210(1):96–106.
- Macias H, Hinck L. Mammary gland development: mammary gland development. WIRES Dev Biol. 2012;1(4):533–557.
- Holliday H, Baker LA, Junankar SR, et al. Epigenomics of mammary gland development. BCR. 2018;20(1):100.
- Ivanova E, Le Guillou S, Hue-Beauvais C, et al. Epigenetics: new Insights into Mammary Gland Biology. Genes (Basel). 2021;12(2):231.
- Karlsson M, Zhang C, Méar L, et al. A single-cell type transcriptomics map of human tissues. Sci Adv. 2021;7(31):eabh2169.
- Kim MR, Wu M-J, Zhang Y, et al. TET2 directs mammary luminal cell differentiation and endocrine response. Nat Commun. 2020;11(1):4642.
- Carvalho L, Ward RD, Brinkmeier ML, et al. Molecular basis for pituitary dysfunction: comparison of Prop1 and Pit1 mutant mice. Dev Biology. 2006;295(1):340.
- Zhao H, Zhang S, Wu X, et al. DNA methylation pattern of the goat PITX1 gene and its effects on milk performance. Archives Animal Breeding. 2019;62(1):59–68.
- Cabrera VE. Invited review: helping dairy farmers to improve economic performance utilizing data-driving decision support tools. Animal. 2018;12(1):134–144.
- Adriaens I, Friggens NC, Ouweltjes W, et al. Productive life span and resilience rank can be predicted from on-farm first-parity sensor time series but not using a common equation across farms. J Dairy Sci. 2020;103(8):7155–7171.
- Grayaa M, Vanderick S, Rekik B, et al. Linking first lactation survival to milk yield and components and lactation persistency in Tunisian Holstein cows. Archives Animal Breeding. 2019;62(1):153–160.
- Kessler EC, Bruckmaier RM, Gross JJ. Milk production during the colostral period is not related to the later lactational performance in dairy cows. J Dairy Sci. 2014;97(4):2186–2192.
- Ginger MR, Gonzalez-Rimbau MF, Gay JP, et al. Persistent Changes in Gene Expression Induced by Estrogen and Progesterone in the Rat Mammary Gland. Mol Endocrinol. 2001;15(11):1993–2009.
- Peri S, de Cicco RL, Santucci-Pereira J, et al. Defining the genomic signature of the parous breast. BMC Med Genomics. 2012;5(1):46.
- D’Cruz CM, Moody SE, Master SR, et al. Persistent Parity-Induced Changes in Growth Factors, TGF-β3, and Differentiation in the Rodent Mammary Gland. Mol Endocrinol. 2002;16(9):2034–2051.
- Ethier SP, Van De Velde RM, Cundiff KC. CAMP levels in proliferating rat mammary epithelial cells in vitro and in vivo. Exp Cell Res. 1989;182(2):653–658.
- Ivanova E, Hue-Beauvais C, Chaulot-Talmon A, et al. DNA methylation and gene expression changes in mouse mammary tissue during successive lactations: part I – the impact of inflammation. Epigenetics. 2023.
- Fleige S, Pfaffl MW. RNA integrity and the effect on the real-time Qrt-PCR performance. Mol Aspect Med. 2006;27(2–3):126–139.
- Kozera B, Rapacz M. Reference genes in real-time PCR. J Appl Genet. 2013;54(4):391–406.
- Gu H, Smith ZD, Bock C, et al. Preparation of reduced representation bisulfite sequencing libraries for genome-scale DNA methylation profiling. Nat Protoc. 2011;6(4):468–481.
- Perrier J-P, Kenny DA, Chaulot-Talmon A, et al. Accelerating Onset of Puberty Through Modification of Early Life Nutrition Induces Modest but Persistent Changes in Bull Sperm DNA Methylation Profiles Post-puberty. Front Genet. 2020;11:945.
- Perrier J-P, Sellem E, Prézelin A, et al. A multi-scale analysis of bull sperm methylome revealed both species peculiarities and conserved tissue-specific features. BMC Genomics. 2018;19(1):404.
- Costes V, Chaulot-Talmon A, Sellem E, et al. Predicting male fertility from the sperm methylome: application to 120 bulls with hundreds of artificial insemination records. Clin Epigenetics. 2022;14(1):54.
- Krueger F, Andrews SR. Bismark: a flexible aligner and methylation caller for Bisulfite-Seq applications. Bioinformatics. 2011;27(11):1571–1572.
- Langmead B, Trapnell C, Pop M, et al. Ultrafast and memory-efficient alignment of short DNA sequences to the human genome. Genome Bio. 2009;10(3):R25.
- Akalin A, Kormaksson M, Li S, et al. methylKit: a comprehensive R package for the analysis of genome-wide DNA methylation profiles. Genome Bio. 2012;13(10):R87.
- Huang DW, Sherman BT, Lempicki RA. Bioinformatics enrichment tools: paths toward the comprehensive functional analysis of large gene lists. Nucleic Acids Res. 2009a;37(1):1–13.
- Huang DW, Sherman BT, Lempicki RA. Systematic and integrative analysis of large gene lists using DAVID bioinformatics resources. Nat Protoc. 2009b;4(1):44–57.
- Nedvetsky PI, Kwon S-H, Debnath J, et al. Cyclic AMP regulates formation of mammary epithelial acini in vitro. ?Mol Biol Cell. 2012;23(15):2973–2981.
- Zhang D, Rogers GC, Buster DW, et al. Three microtubule severing enzymes contribute to the “Pacman-flux” machinery that moves chromosomes. J Cell Bio. 2007;177(2):231–242.
- Mukherjee S, Valencia JDD, Stewman S, et al. Human Fidgetin is a microtubule severing the enzyme and minus-end depolymerase that regulates mitosis. Cell Cycle. 2012;11(12):2359–2366.
- Charafeddine RA, Makdisi J, Schairer D, et al. Fidgetin-Like 2: a Microtubule-Based Regulator of Wound Healing. J Invest Dermatol. 2015;135(9):2309–2318.
- O’Rourke BP, Kramer AH, Cao LL, et al. Fidgetin-Like 2 siRNA Enhances the Wound Healing Capability of a Surfactant Polymer Dressing. Adv Wound Care. 2019;8(3):91–100.
- Brickner AG. Mechanisms of Minor Histocompatibility Antigen Immunogenicity: the Role of Infinitesimal versus Structurally Profound Polymorphisms. Immunol Res. 2006;36(1–3):33–42.
- Al-Rugeebah A, Alanazi M, Parine NR. MEG3: an Oncogenic Long Non-coding RNA in Different Cancers. Pathol Oncol Res. 2019;25(3):859–874.
- Fanale D, Amodeo V, Caruso S. The Interplay between Metabolism, PPAR Signaling Pathway, and Cancer. PPAR Res. 2017;2017:1–2.
- Moyes KM, Drackley JK, Morin DE, et al. Gene network and pathway analysis of bovine mammary tissue challenged with Streptococcus uberis reveals induction of cell proliferation and inhibition of PPARγ signaling as potential mechanism for the negative relationships between immune response and lipid metabolism. BMC Genomics. 2009;10(1):542.
- Say B, Dizdar EA, Degirmencioglu H, et al. The effect of lactational mastitis on the macronutrient content of breast milk. Early Hum Dev. 2016;98:7–9.
- Alba DF, da Rosa G, Hanauer D, et al. Subclinical mastitis in Lacaune sheep: causative agents, impacts on milk production, milk quality, oxidative profiles and treatment efficacy of ceftiofur. Microbial Pathogenesis. 2019;137:103732.
- Shangraw EM, Rodrigues RO, Witzke MC, et al. Intramammary lipopolysaccharide infusion induces local and systemic effects on milk components in lactating bovine mammary glands. J Dairy Sci. 2020;103(8):7487–7497.
- Jardé T, Dale T. Wnt signalling in murine postnatal mammary gland development. Acta Physiol (Oxf). 2012;204(1):118–127.
- Hargreaves DC, Horng T, Medzhitov R. Control of inducible gene expression by signal-dependent transcriptional elongation. Cell. 2009;138(1):129–145.