
ABSTRACT
Mastitis is among the main reasons women cease breastfeeding, which leads to them supplementing breast milk with artificial formula. In farm animals, mastitis results in significant economic losses and the premature culling of some animals. Nevertheless, researchers do not know enough about the effect of inflammation on the mammary gland. This article discusses the changes to DNA methylation in mouse mammary tissue caused by lipopolysaccharide-induced inflammation (4 h post-injection of lipopolysaccharide). We analysed the expression of some genes related to mammary gland function, epigenetic regulation, and the immune response. The analysis focused on three comparisons: inflammation during the first lactation, inflammation during second lactation with no history of inflammation, and inflammation during second lactation with previous inflammation. We identified differentially methylated cytosines (DMCs), differentially methylated regions (DMRs), and some differentially expressed genes (DEGs) for each comparison. The three comparisons shared some DEGs; however, few DMCs and only one DMR were shared. These observations suggest that inflammation is one of several factors affecting epigenetic regulation during successive lactations. Furthermore, the comparison between animals in second lactation with and without inflammation, with no inflammation history during first lactation showed a different pattern compared to the other conditions in this experiment. This indicates that inflammation history plays an important role in determining epigenetic changes. The data presented in this study suggest that lactation rank and previous inflammation history are equally important when explaining mammary tissue gene expression and DNA methylation changes.
Abbreviations: RRBS, reduced representation bisulfite sequencing; RT–qPCR, real-time quantitative polymerase chain reaction; MEC, mammary epithelial cells; TSS, transcription start site; TTS, transcription termination site; UTR, untranslated region; SINE, short interspersed nuclear element; LINE, long interspersed nuclear element; CGI, CpG island; DEG, differentially expressed gene; DMC, differentially methylated cytosine; DMR, differentially methylated region; GO term, gene ontology term; MF, molecular function; BP, biological process
Introduction
The mammary gland is a complex organ that undergoes significant modifications during its development and at each reproduction cycle. It is a unique glandular organ in that it reaches full development only after birth. Scholars have extensively studied the precise and complex regulation of mammary development at the genetic, physiological, and morphological levels. Studies focused on mammary development and function traditionally use mice as model subjects, as they have short periods of gestational and postnatal development and are easy to genetically modify in experiments [Citation1,Citation2].
The adult mammary gland comprises multiple cell types, such as epithelial, adipose, fibroblast, immune, lymphatic, and vascular cells, that work together to maintain a functional organ [Citation1]. The mammary epithelium itself is composed of two main cell lineages, luminal and basal cells, which form an epithelial bilayer [Citation3]. The basal cell population contains progenitor cells [Citation4,Citation5]. During the different stages of mammary development, luminal cells restructure mammary architecture by giving rise to the ductal epithelium. During pregnancy, luminal cells differentiate into alveolar cells that then produce milk at parturition [Citation1]. Alternatively, some basal cells differentiate into myoepithelial cells that line mammary ducts and alveoli [Citation1].
The inflammatory response is intrinsic and universal to all cells. Infection or tissue damage activates the immune response, which serves to eliminate the initial cause of cell injury, clear damaged cells and tissue, and initiate tissue repair [Citation6]. Maintaining a balance in inflammatory response activation is crucial for homoeostasis. An insufficient response leads to susceptibility to infections or tumour development, whereas an excessive response leads to allergies or autoimmune diseases. Therefore, a signal that activates the immune response is necessary. Most likely, the host cells recognize foreign features in infectious agents [Citation6,Citation7] through sensor proteins that detect the presence of pathogens via pattern recognition receptors (PRRs) and trigger the inflammatory response upon activation [Citation6,Citation8]. The receptors detect pathogen-associated molecular patterns (PAMPs), such as microbial nucleic acids, lipoproteins, carbohydrates, and damage-associated molecular patterns (DAMPs), from injured cells [Citation9].
The expression of serum cytokines, such as interleukins (IL) 1, 6, and 8 and tumour necrosis factor-alpha (TNFα), increases during inflammation and, therefore, during mastitis [Citation10,Citation11]. Some cytokines, such as IL-6, are produced not only by immune cells but also by mammary epithelial cells (MECs) [Citation12]. TNFα and IL-1β are expressed quickly during the initial stages of infection, as they have powerful proinflammatory functions [Citation13]. Other interleukins, IL-4, IL-6, IL-10, and IL-17, promote the resolution of the inflammatory cascade [Citation13]. Thus, cytokines regulate the intensity and duration of the immune response by enhancing or inhibiting the activation, proliferation, and differentiation of cells involved in it. In this paper, we study the early stages of the immune response, that is, changes induced four hours after the introduction of a pathogen, and we refer to this as inflammation.
Recent reports have assessed the potential implications of epigenetic control of inflammatory responses. In inflammation caused by bovine mastitis, cytokines are released that change gene expression regulation [Citation14]. Epigenetic mechanisms modulate chromatin structure and can either repress or enhance gene expression. These mechanisms include DNA methylation [Citation15,Citation16], histone modifications such as acetylation, ubiquitination, methylation, phosphorylation [Citation17], and microRNAs [Citation18]. DNA methylation is extensively studied and predominantly occurs at the 5’-position of cytosine in cytosine-phosphate-guanine (CpG) dinucleotides [Citation19]. In rare cases, methylation may also occur at isolated CpG dinucleotides in proximity to functional transcription factor-binding sites [Citation20] or even non-CpG cytosines [Citation21].
A better understanding of the epigenetic regulation of inflammation is necessary. Doing so would likely lead to earlier diagnosis and treatment, preventing the onset of potentially debilitating symptoms. In the mammary gland, the inflammatory response to infection leads to mastitis [Citation22,Citation23], a commonly occurring breast disease in lactating women and animals that causes pain, reduced milk synthesis, and the rapid onset of systemic symptoms such as fever, flu-like aches, chills, and fatigue [Citation24,Citation25]. Mastitis does not have a high mortality rate; however, in women, the symptoms lead to supplementation with formula to feed infants or cessation of breastfeeding altogether [Citation26–28]. In farm animals, the economic losses related to clinical mastitis are substantial due to multiple factors, such as decreased milk production, diagnostic tests, drug treatments, discarded milk, veterinary services, treatment labour, declines in product quality, and premature culling [Citation29,Citation30].
This article studies the effect of lipopolysaccharide (LPS)-induced inflammation on genome-wide DNA methylation and transcription patterns in the lactating mouse mammary gland. The focus on lactation, when the gland is fully developed, and early-stage inflammation allowed us to obtain results from mammary tissue mostly composed of MECs. To do this, we developed a mouse model of mammary gland inflammation. We then used the model to compare data from the 1st or 2nd lactation. The groups obtained formed three comparisons: inflammation during first lactation, inflammation during second lactation with no history of inflammation, and inflammation during second lactation with previous inflammation (Fig. S1).
Materials and methods
Animals and sample collection
This study was performed in compliance with the French regulations on animal experimentation and with the authorization of the French Ministry of Agriculture. All protocols were approved by an Ethics Committee registered within the French Comité National de Réflexion Ethique sur l’Expérimentation Animale. The protocol is referenced here (visa APAFIS#12809–2017112817204811 v4) by the Comité d’éthique appliqué à l’Expérimentation Animale (COMETHEA Ethics Committee).
FVB/N mice from Janvier Labs, Le Genet-Saint-Isle, France, were housed in a specific pathogen-free (SPF) environment. Mice were allowed to mate naturally and were isolated when pregnancy was visible (~14 days). Once a female mouse reached lactation Day 7 (L7), its pups were removed 3 h before administering an analgesic (Fynadine, 10 µg/g body weight) to the mother via intraperitoneal injection. Gaseous anaesthetic (isoflurane, rate of flow 0.8 L/min O2 complemented with 1.5–2% isoflurane) was then administered to the female mouse for the length of the following procedure: intramammary injection of either 10 µL of LPS (LPS-EB Ultrapure InvivoGen, San Diego, CA, USA) at 1 mg/mL to induce inflammation or 10 µL of PBS (phosphate-buffered saline) at 1× as a control. A Hamilton syringe equipped with a metal Nanofil 100 µL tip was used to administer LPS or PBS in the inguinal mammary gland. After intramammary injection, the mouse was woken and placed in its cage. The pups were reunited with their mother 1 h postinjection (hpi) to allow the LPS or PBS to diffuse in the gland before the pups started to suck milk. Mice were observed to ensure that the injected mammary glands were suckled before sampling.
Mammary glands were removed at 4 hpi. For the first lactation, the right mammary gland was removed via surgical biopsy under gas anaesthesia, and the animal was then returned to its cage. After 30 days, the mice were mated once again. At L7 of the second lactation, LPS was injected into the left inguinal mammary gland. After 4 h, the mice were euthanized, and the glands were removed (Figure S1A). This allowed us to obtain samples from first or second lactation, with or without inflammation (Figure S1B). All cases of inflammation discussed in this article correspond to this 4-h exposure of the mammary gland to LPS.
The lymphatic ganglion was removed from each mammary gland. For histology, the collected tissues were fixed in RCl2 (Alphelys, Plaisir, France) overnight at 4°C before being placed in 70% ethanol, dehydrated, and embedded in paraffin. This paraffin block was then sectioned via a microtome and stained using haematoxylin and eosin. For immunohistological staining, tissues were fixed for 10 min in paraformaldehyde (PFA) 4% and then cryopreserved in 40% sucrose for at least 12 h at 4°C. The tissues were then embedded in Tissue-Tek O.C.T. for frozen sections using a cryostat. For nucleotide extraction, tissues were frozen in liquid nitrogen and stored at −80°C.
Genomic DNA extraction
Totally, 30 to 40 mg of frozen mammary tissue was ground using a mortar and pestle. The powder was then transferred to Eppendorf tubes and stored at −80°C until DNA extraction. On the day of the extraction, the entirety of the powdered mammary tissue was transferred to a 5 mL Eppendorf tube and incubated overnight at 55°C in 1 mL lysis buffer (10 mM Tris-HCl, pH 7.4, 0.2% SDS, 10 mM EDTA, 50 mM NaCl) in the presence of 200 µg/mL proteinase K. After incubation with 25 µg/mL RNase A for 1 h at 37°C, 200 µg/mL proteinase K was added for 90 min at 42°C to inactivate RNase A. DNA was then extracted using 1 volume (vol) of phenol:chloroform:isoamyl alcohol (50:49:1) for every volume of lysis buffer. The aqueous phase was recovered after centrifugation for 5 min at 12 000 g and at room temperature (RT). One volume of chloroform was added to every 1 vol of lysis buffer, and the liquid phase was again recovered after centrifugation for 5 min at 12 000 g and RT. Then, 0.2 M NaCl was added, followed by 2.5 vol of cold 100% ethanol. The precipitated gDNA was recovered using the tip of a Pasteur pipette and dried; it was then placed into a new tube containing 150 µL of sterile water, and the gDNA was left to dissolve for 24 to 48 h at 4°C. DNA concentration was measured using Nanodrop and Qubit (dsDNA BR assay kit, Invitrogen, Waltham, MA, USA) according to the manufacturer’s instructions. The integrity of the extracted DNA was verified using 0.7% agarose gel electrophoresis in 1× TBE and migration for 1 h at 100 V. Genomic DNA was stored at 4°C in the short term and −20°C in the long term.
RNA extraction
Two hundred milligrams of frozen mammary tissue was placed in a tube containing 1 mL of RNA NOW and then homogenized using an Ultra-Turrax® (IKA, Staufen, Germany) to lyse the cells. This solution was transferred to a different tube containing 200 µL of chloroform, mixed gently, and incubated for 5 min on ice. The samples were then centrifuged for 10 min at 15 000 g, and the liquid phases were transferred to tubes containing 1 mL of isopropanol and then mixed gently. Samples were then incubated overnight at −20°C before a second centrifugation for 10 min at 15 000 g and 4°C. The supernatant was eliminated, and 1 mL of 75% ethanol was added to wash the RNA pellet. The tubes were vortexed and centrifuged for 5 min at 5 000 g and 4°C. The supernatant was removed, and the pellet was dried for 10–15 min at RT. The RNA pellet was dissolved in 100 µL of sterile water. The RNA concentration was measured using a NanoDropTM OneTM (Thermo Scientific, Waltham, MA, USA).
Extracted RNA was treated with DNase using the rDNase set kit (Macherey-Nagel, Düren, Germany) according to the manufacturer’s instructions. Treated RNA was then purified using the NucleoSpin RNA Clean-up kit (Macherey-Nagel, Düren, Germany) according to the manufacturer’s instructions. RINs were calculated for each sample using the RNA 6000 Nano kit (Agilent, Santa Clara, CA, USA) and the 2100 Bioanalyzer (Agilent, Santa Clara, CA, USA) according to the manufacturer’s instructions. Samples with RIN higher than 8 were used for further experiments [Citation31].
Reverse transcription and real-time quantitative PCR
One microgram of extracted RNA was retrotranscribed using the SuperScriptTM VILOTM cDNA synthesis kit (Thermo Fisher, Waltham, MA, USA) according to the manufacturer’s instructions. Quantitative PCR (qPCR) was performed on retrotranscribed products using the Mastercycler ep Realplex (Eppendorf, Hamburg, Germany). The reaction conditions consisted of 15 min at 95°C (1 cycle), 15 s at 95°C and 60 s at 60°C (45 cycles) with primers using ABsolute QPCR SYBR Green (Thermo Fisher, Waltham, MA, USA). Samples were analysed in triplicate using GAPDH and CPR2 as housekeeping genes.
The primers used in this study as well as restriction efficiencies are listed in Table S1. PCR-primer pairs were designed from mRNA sequences of the studied genes provided by the National Center for Biotechnology Information (NCBI) gene database using PrimerBlast. Their reaction efficiencies were between 80 and 110%. The optimal Tm at 60°C and exon junction span were selected. Primers were ordered at 100 µM concentration from Eurofins Genomics, Ebersberg, Germany.
For Fluidigm PCR, cDNA was preamplified according to Fluidigm’s protocol (quick reference PN 100–5875 B1). Preamplified cDNA was then diluted fivefold with Tris-EDTA buffer. Gene expression levels were measured on a 48 × 48 GE Dynamic Array IFC using the Fluidigm BioMarkTM HD System. Fold changes were calculated by the ∆∆Ct method using ‘Fluidigm Real-Time PCR Analysis’ software. The reference genes used were GAPDH, CPR2, and HPRT1 [Citation32]. Each expression value was normalized to one reference sample – mammary tissue from first lactation with inflammation. This allowed for a more reliable reference for genes whose expression is activated by inflammation.
Immunohistochemistry
Five-micrometre frozen cryosections from mammary samples were left at RT for several minutes before incubation for 30 min at RT with 50 mM NH4Cl in 1× PBS. The sections were then washed in PBS 1× before incubation for 1 h at RT with PBS 1×, pH 7, 1% bovine serum albumin (BSA), 0.5% Triton X-100, and 0.05% sodium azide. Primary antibodies Ly-6 G (STEMCELL Technologies Cat# 60031, RRID:AB_2877150) to detect polynuclear neutrophils and F4/80 (Thermo Fisher Scientific Cat# MA1–91124, RRID:AB_2277854) to detect macrophages were diluted to 1/200 in the previously described solution and incubated with the sections overnight at 4°C. Slides were then washed four times for 5–10 min at RT in 1× PBS. The secondary antibody, anti-rat IgG coupled with FITC (Jackson ImmunoResearch Labs Cat# 712-095-153, RRID:AB_2340652), was diluted to 1/200 in a PBS 1X–1% BSA solution and incubated with the sections for 1 h at RT. A negative control was present on each slide with secondary antibody only. Slides were washed as previously described and mounted using Vectashield + DAPI to stain nuclei blue. Slides were observed on an epifluorescence microscope, x40 magnification, with a DAPI filter to visualize nuclei and a FITC filter to visualize potential infiltrating immune cells. The infiltrating cell rate was measured by cell counting using ImageJ software [Citation33].
Reduced Representation Bisulfite Sequencing (RRBS)
RRBS libraries were prepared according to [Citation34] modified by [Citation34,Citation35]. Briefly, RRBS libraries were prepared using an RRBS-adapted protocol for which all the steps were automated on a robot (NGS STARlet, Hamilton, Bonaduz, Switzerland) as previously described [Citation36]. After MspI cleavage of gDNA (200 ng), end repair and ligation to 55 bp Illumina adapters for subsequent PCR amplification and paired-end sequencing, size selection was performed using SPRIselect magnetic beads (Beckman Coulter Life Sciences, Villepinte, France). Fragments ranging from 150 to 400 bp (genomic fragments of 40–290 bp with adapters) were selected and submitted to two consecutive bisulphite conversions with the EpiTect bisulphite kit (Qiagen, Les Ulis, France) following the manufacturer’s instructions. The libraries were produced by amplification with Pfu Turbo Cx hotstart DNA polymerase (Agilent Technologies, Les Ulis, France) using 14 PCR cycles and purified using AMPure XP beads (Beckman Coulter Life Sciences, Villepinte, France). All libraries were sequenced on an Illumina HiSeq4000 sequencer to produce 75 bp paired-end reads (Integragen SA, Evry, France).
Bioinformatics and statistical analyses
Bioinformatics and statistical analyses were performed using a home-made pipeline according to [Citation35] and [Citation35,Citation37,Citation37]. Quality checks and trimming were performed using TrimGalore v0.4.5, which removed adapter sequences, poor quality bases and reads (Phred score below 20), and reads shorter than 20 nucleotides. High-quality reads were aligned to the mouse reference genome GRCm38 primary assembly (Ensembl 100) using Bismark_v0.20.0 [Citation38], which uses Bowtie 1.2.1.1 alignment software [Citation39]. The bisulphite conversion rate was estimated from the unmethylated cytosine added in vitro during the end-repair step and was ≥ 99.5%. The CpGs were then selected based on their coverage by uniquely mapped reads. Around 1,273,950 CpGs covered by at least 10 uniquely mapped reads (CpG10) were retained for subsequent analyses. The total of these CpGs was named ‘background.’ Each CpG10 was assigned a methylation percentage per sample calculated from Bismark methylation calling (Bismark v0.20.0). Quality control values (mapping efficiency, coverage, and average methylation at CpG10) were analysed for each library group: L1-I, L1-NI, L2-I (L1-NI), L2-NI (L1-NI), L2-I (L1-I), and L2-NI (L1-I), summed up in Table S1B. Correlation hierarchical clustering was computed on the matrix of methylation percentages for each CpG10 covered in at least four mice per group. Only CpGs with at least 20 uniquely mapped reads (CpG20) in at least four mice per group were retained for differential methylation analysis using methylKit [Citation40]. A CpG20 was considered a DMC when the adjusted p value was less than 0.1 and the methylation difference between two groups was at least 15%. A DMR was constituted by a minimum of three DMCs with a maximum inter-DMC distance of 100 bp.
The annotation of the DMCs, DMRs, and the ‘background’ was performed as described in [Citation36,Citation36] relative to gene features, CpG density, and repetitive elements using an in-house pipeline. The reference files were downloaded at the following sites: http://ftp.ensembl.org/pub/release-100/gtf/mus_musculus/Mus_musculus.GRCm38.100.gtf.gz, http://apr2020.archive.ensembl.org/biomart/martview/db614f58c20a42c0d2cb13bcedf364f8 [Ensembl Genes 100, Mouse genes (GRCm38.p6)], http://hgdownload.soe.ucsc.edu/goldenPath/mm10/database/cpgIslandExt.txt.gz and http://hgdownload.soe.ucsc.edu/goldenPath/mm10/database/rmsk.txt.gz. The following criteria were applied: transcription start site (TSS), −100 to + 100 bp relative to the TSS; promoter, −2000 to + 100 bp relative to the TSS; transcription termination site (TTS): −100 to + 100 bp relative to the TTS; shore, up to 2000 bp from a CpG island (CGI); and shelf, up to 2000 bp from a shore. A site/fragment was considered to belong to a CGI (respective shore and shelf) if an overlap of at least 75% was observed between the site/fragment and the CGI (respective shore and shelf). A site/fragment was considered overlapped by a repetitive element, regardless of the extent of this overlap. DMCs were subjected to enrichment analyses with the Database for Annotation, Visualization, and Integrated Discovery (DAVID) using the ‘background’ as a reference genome [Citation41,Citation42].
Results
Mouse model to study mammary inflammation
We developed a mouse model of mammary inflammation using intramammary LPS injection to examine the effects of inflammation on the mammary gland. Mammary glands were recovered 4 hpi, and multiple experiments were performed to confirm the presence of signs of inflammation in samples that received LPS.
To determine the effects of intramammary injection (LPS or PBS) on gland morphology, H&E-stained mammary sections from lactating mice at Day 7 (L7) were analysed. We compared mammary glands injected with either LPS or PBS to a control mammary gland that had not received any injections. Histological analyses of mammary glands injected with PBS showed no degradation of mammary tissue or other morphological changes and were indistinguishable from control mammary glands (Figure S2A-F). No apoptotic MECs were observed. The same was true for glands injected with LPS. Therefore, neither the intramammary injection itself nor 4 hpi of LPS causes morphological changes or apoptosis in the mammary gland.
To determine the inflammation status, we evaluated the rate of infiltrating immune cells, neutrophils and macrophages in the mammary gland by IHC. In mammary glands injected with LPS, neutrophils were found in 38% of slides (5 out of 13) compared to no neutrophils in glands injected with PBS (0 out of 9) (Fig. S2G-L). Mammary glands injected with LPS presented macrophages in 69% of slides (9 out of 13) compared to only 22% in glands injected with PBS (2 out of 9). The number of infiltrating immune cells is much higher in glands injected with LPS, demonstrating that LPS is responsible for the recruitment of immune cells and the onset of inflammation. The lack of infiltrating cells in mammary glands injected with PBS shows that the injection itself is insufficient to provoke inflammation. As expected, LPS injection caused immune cells to infiltrate the mammary gland. In the most extreme case observed, the immune cells only accounted for < 4% of all cells (360 MECs and 14 infiltrating cells). Therefore, while LPS induces sufficient infiltration from immune cells to determine inflammation is present 4 hpi, the number of infiltrating cells remains sufficiently low that analysis of DNA methylation changes in these samples would mostly reflect changes in MECs, not immune cells.
To confirm the presence of inflammation, we analysed the expression of IL-6 and TNFα, inflammatory cytokines expressed by both MECs [Citation12] and immune cells. qPCR results showed that the fold change of IL-6 in the mammary gland was on average 28 (±49) (n = 6) in the case of a PBS injection and 2587 (±1276) (n = 7) in the case of an LPS injection (Fig. S2 M-O). The average fold change of TNFα was 669 (±885) (n = 6) in the case of PBS injection compared to 2426 (±1798) (n = 7) in the case of LPS injection (Fig. S2 M-O). Therefore, the expression of these two inflammatory cytokines in the mammary gland is significantly higher, by a factor of 92 in the case of IL-6 and a factor of 3 in the case of TNFα, in tissue injected with LPS, confirming the presence of inflammation 4 hpi and validating the use of this inflammation mouse model.
Inflammation induces gene expression changes in mammary tissue
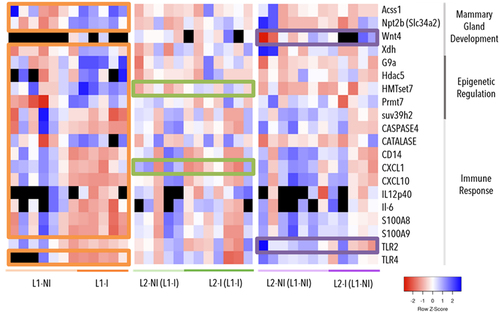
To determine the effect of inflammation on mammary gland function, we analysed the expression of 63 genes via RT – qPCR. In total, there were four differentially expressed genes (DEGs) out of 20 genes involved in mammary gland development and function, 5 DEGs out of 13 genes involved in epigenetic regulation, 11 DEGs out of 27 genes involved in the immune response, and 3 housekeeping genes (). The abundance of the housekeeping genes was similar across all samples and did not vary with lactation rank and the presence of inflammation (data not shown). DEGs were identified by pairwise comparisons between inflammation during first lactation (L1-I vs. L1-NI), inflammation during second lactation with no history of inflammation (L2-I (L1-NI) vs. L2-NI (L1-NI)), and inflammation during second lactation with previous inflammation (L2-I (L1-I) vs. L2-NI (L1-I)). We found the most DEGs in the first comparison, inflammation during first lactation (L1-I vs. L1-NI). Only two genes, HMTset7 and CXCL1, were differentially expressed in two comparisons, inflammation during first lactation (L1-I vs. L1-NI) and inflammation during second lactation with previous inflammation (L2-I (L1-I) vs. L2-NI (L1-I)). For HMTset7, the average fold change was 5.24 (±2.73) in L1-NI, 2.05 (±0.77) in L1-I, 9.24 (±2.97) in L2-NI (L1-I), and 5.42 (±1.94) in L2-I (L1-I). For CXCL1, the average fold change was 0.25 (±0.61) in L1-NI, 2.95 (±5.09) in L1-I, 1.64 (±3.66) in L2-NI (L1-I), and 3.93 (±4.49) in L2-I (L1-I). Interestingly, the remaining comparison, inflammation during second lactation with no previous inflammation (L2-I (L1-NI) vs. L2-NI (L1-NI)), had no DEGs in common with the other two but did have two DEGs not found in the other two, Wnt4 and TLR2. For Wnt4, the average fold change was 0.86 (±0.74) in L2-I (L1-NI) and 6.2 (±8.7) in L2-NI (L1-NI). For TLR2, the average fold change was 0.82 (±0.5) in L2-I (L1-NI) and 0.24 (±0.14) in L2-NI (L1-NI). Overall, comparisons of samples from the second lactation presented only four DEGs - HMTset7, CXCL1, Wnt4, and TLR2. All ΔΔCt values for DEGs are available in Table S2.
Figure 1. Gene expression (∆∆Ct) in three comparisons: inflammation during 1st lactation (L1-I, n = 5; L1-NI, n = 7) (orange), inflammation during 2nd lactation after inflammation in 1st (L2-I (L1-I), n = 7; L2-NI (L1-I), n = 5) (green), and inflammation during 2nd lactation with no prior inflammation (L2-I (L1-NI), n = 5; L2-NI (L1-NI), n = 7) (purple). The genes listed are differentially expressed (p < 0.05) in at least one comparison (colour-coded circles). Each column represents one individual. Lowest gene expression is represented in blue (highest ∆∆Ct values), highest – in red (lowest ∆∆Ct values), no data available – in black.
Inflammation induces mammary gland DNA methylation changes
To examine the effects of inflammation on mammary gland DNA methylation patterns, we analysed 24 samples with or without inflammation from first or second lactation using RRBS.
Quality control of RRBS libraries
Sequencing the RRBS libraries generated an average of 35.7 (±7) million reads per sample (). The percentage of unique mapping efficiency was on average 68.3 (±0.8)%, which is consistent with previous mouse studies [Citation43]. We used the conversion rate of unmethylated cytosine added in vitro during the end-repair step of library preparation to estimate the bisulphite conversion rate. On average that rate was 99.8 ± 0.1%. We found no significant difference when comparing the different groups of mice, thereby eliminating the possibility of technical bias during RRBS library preparation or sequencing and indicating that the data obtained were of good quality. We focused on the 70 ± 3.8% CpGs covered by at least 10 uniquely mapped reads, referred to as CpGs10 in this article. No statistically significant differences between experimental groups were found for the percentages of hypermethylated (DNA methylation > 80%), intermediate (DNA methylation [20–80%]), and hypomethylated (DNA methylation < 20%) CpGs10. The same was true for the number of covered CpGs and the average DNA methylation at CpGs10. This finding indicates that neither the presence of inflammation nor lactation rank induces global DNA methylation changes.
Table 1. Library characterization, mapping efficiency on the murine genome (GRCm38), coverage and average methylation in RRBS libraries.
Intersample variability is unrelated to the presence of inflammation
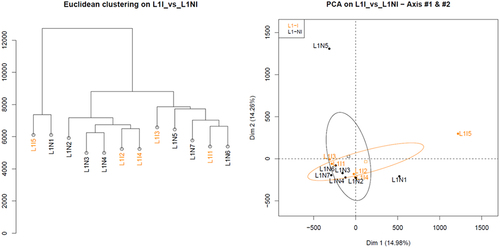
The next step was to determine the similarities and differences between samples. Hierarchical clustering and principal component analysis of the RRBS libraries revealed no discernible clusters when analysing samples from first lactation, with or without inflammation (). The same was true when we analysed samples from the second lactation, with or without inflammation (Fig. S3). Therefore, this analysis did not discriminate samples with inflammation.
Figure 2. Hierarchical clustering and principal component analysis of samples from 1st lactation, with (orange) or without inflammation (black).
Inflammation induces differential methylation of cytosines in the mammary gland
We then analysed the effect of inflammation associated with first or second lactation on DNA methylation profiles. We identified inflammation-related DMCs and DMRs by pairwise comparisons between L1-I vs. L1-NI, L2-I (L1-NI) vs. L2-NI (L1-NI), and L2-I (L1-I) vs. L2-NI (L1-I) and looked at the overall methylation levels in each condition ().
Figure 3. Violin plots of the overall distribution of methylation levels in all three comparisons: inflammation during 1st lactation (L1-I, n = 5; L1-NI, n = 7) (orange), inflammation during 2nd lactation after inflammation in 1st (L2-I (L1-I), n = 7; L2-NI (L1-I), n = 5) (green), inflammation during 2nd lactation with no prior inflammation (L2-I (L1-NI), n = 5; L2-NI (L1-NI), n = 7) (purple). The abscissa represents the different conditions in each comparison, the ordinate represents the level of methylation of the DMCs in that condition, and each violin represents the density of the point at that methylation level.
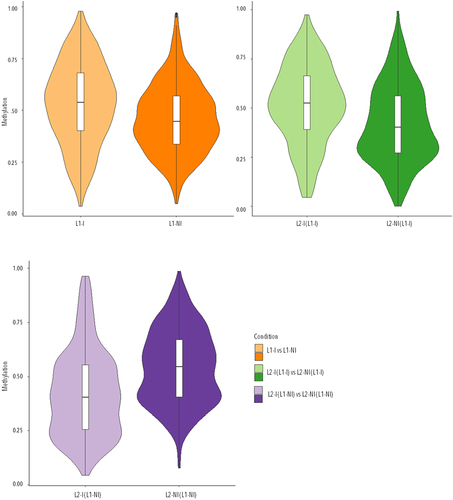
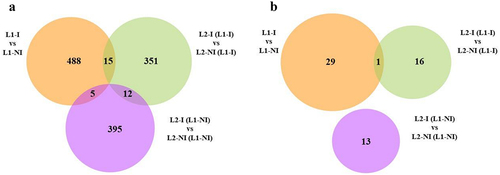
Inflammation during the first lactation (L1-I vs. L1-NI) comparison resulted in the identification of 508 DMCs and 30 DMRs, of which 70% and 67%, respectively, were upmethylated for the L1-I group. Inflammation during second lactation with no previous inflammation (L2-I (L1-NI) vs. L2-NI (L1-NI)) resulted in the identification of 412 DMCs and 13 DMRs, from which only 14% of the DMCs were upmethylated and all of the DMRs were downmethylated, for the L2-I (L1-NI) group. Inflammation during second lactation with previous inflammation (L2-I (L1-I) vs. L2-NI (L1-I)) resulted in the identification of 378 DMCs and 17 DMRs, of which 76% and 88%, respectively, were upmethylated for the L2-I (L1-I) group. Even though the number of DMCs and DMRs in all three comparisons was of the same order of magnitude, most DMCs and twice as many DMRs were identified in L1-I vs. L1-NI compared to the other two. Interestingly, the DMCs and DMRs do not exhibit the same pattern, i.e., the majority are upmethylated in L1-I and L2-I (L1-I) and downmethylated in L2-I (L1-NI). Venn diagrams were used to show any shared DMCs () and DMRs () between the three comparisons.
Figure 4. Venn diagrams of the total number of differentially methylated cytosines (DMCs) as well as shared DMCs in all three comparisons: inflammation during 1st lactation (L1-I, n = 5; L1-NI, n = 7) (orange), inflammation during 2nd lactation after inflammation in 1st (L2-I (L1-I), n = 7; L2-NI (L1-I), n = 5) (green), inflammation during 2nd lactation with no prior inflammation (L2-I (L1-NI), n = 5; L2-NI (L1-NI), n = 7) (purple) (A) and of the total number of differentially methylated regions (DMRs) as well as shared DMRs in all three comparisons (B).
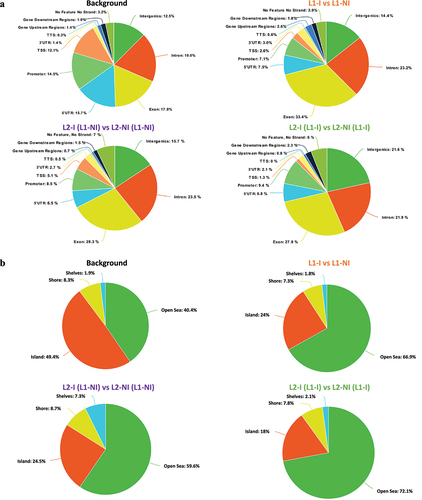
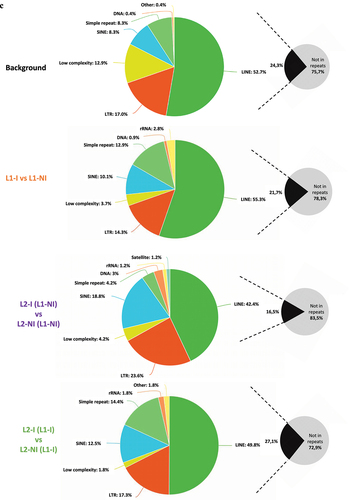
To characterize whether specific genomic features are enriched in DMCs, we annotated the DMCs found for each of the comparisons (). The background is the set of CpGs20 analysed by RRBS (total number of CpGs20) and serves as a control to research enrichment in genomic regions targeted by DMCs. Compared to the genomic distribution of the background CpGs20, DMCs observed from the three comparisons more often targeted the exons and introns. The promoters, TSSs, and UTRs of genes, on the other hand, were targeted less. Interestingly, the L2-I (L1-NI) vs. L2-NI (L1-NI) comparison displayed more DMCs in TSS compared to the other two comparisons (5.1% vs. 1.3% or 2.6%) but remained lower than the background (12.1%). Furthermore, there was a depletion in CGIs accompanied by an enrichment in the open sea (DNA methylation sites outside the CpG island regions) (). These results are consistent with the fact that only 31% of L1-I vs. L1-NI and 29% of L2-I (L1-I) vs. L2-NI (L1-I) DMCs participate in the formation of DMRs. In the remaining comparison, only 13% of L2-I (L1-NI) vs. L2-NI (L1-NI) DMCs participate in the formation of DMRs. Thus, the majority of identified DMCs are dispersed over the genome outside CpG islands. DMCs were depleted in low complexity repeats and enriched in SINEs and simple repeats (). As previously observed, DMCs obtained from the two comparisons, L1-I vs. L1-NI and L2-I (L1-I) vs. L2-NI (L1-I), as well as the background, targeted the repeat sequences more than the comparison L2-I (L1-NI) vs. L2-NI (L1-NI). The list of annotated DMCs and DMRs in the three comparisons is available in Table S3.
Figure 5. Pie charts showing the distribution of DMCs for all three comparisons: inflammation during 1st lactation (L1-I, n = 5; L1-NI, n = 7) (orange), inflammation during 2nd lactation after inflammation in 1st (L2-I (L1-I), n = 7; L2-NI (L1-I), n = 5) (green), inflammation during 2nd lactation with no prior inflammation (L2-I (L1-NI), n = 5; L2-NI (L1-NI), n = 7) (purple). Distribution is shown according to gene regions (A), CpG density (B), and repeats (C). All three comparisons are discussed in comparison to the background (control comprised of all CpGs found after RRBS analysis).
To investigate whether specific gene ontology (GO) terms or signalling pathways were enriched because of inflammation status and history, we used DAVID functional clustering on DMCs from all three comparisons (). In terms of gene ontology, we focused on molecular function (MF) and biological process (BP). DMCs from the L1-I vs. L1-NI comparison were significantly enriched for the MFs DNA binding, transcription factor activity and transcriptional repressor activity. DNA binding and transcriptional repressor activity were also enriched in DMCs from the comparison of inflammation in second lactation, with inflammation in 1st (L2-I (L1-I) vs. L2-NI (L1-I)). When focusing on DMCs from second lactation with no inflammation in 1st (L2-I (L1-NI) vs. L2-NI (L1-NI)), none of these MFs were significantly enriched. When it comes to BPs, all three comparisons were significantly enriched for negative regulation of transcription but not positive regulation of transcription. Cell-cell adhesion and cell junction organization were specifically enriched in DMCs from inflammation during first lactation (L1-I vs. L1-NI). A methylation cluster was found for all three comparisons; however, it was not significantly enriched in any comparison. No comparisons were significantly enriched for signalling pathways with a role in mammary gland function such as Wnt or PI3K-Akt signalling [Citation44]. Only one comparison, L2-I (L1-I) vs. L2-NI (L1-I), showed a significant enrichment for the IL-6 signalling pathway, suggesting inflammation during first lactation can affect methylation in genes related to the immune response in second lactation.
Table 2. GO (gene ontology) terms (MF: molecular function; BP: biological process) and signalling pathways enriched by DAVID analysis for all three comparisons: inflammation during 1st lactation (L1-I, n = 5; L1-NI, n = 7) (orange), inflammation during second lactation after inflammation in 1st (L2-I (L1-I), n = 7; L2-NI (L1-I), n = 5) (green), inflammation during second lactation with no prior inflammation (L2-I (L1-NI), n = 5; L2-NI (L1-NI), n = 7) (purple).
Finally, to determine whether differential methylation resulted in gene expression changes, we studied the expression of four genes upmethylated in first lactation with inflammation (L1-I) compared to first lactation without inflammation (L1-NI) using RT – qPCR. These four genes, Paqr3, H3f4, Fignl2, and Fam110A, were chosen because they corresponded to DMRs composed of multiple DMCs − 11, 12, 33, and 10, respectively (Table S3). Ultimately, none of the four genes was differentially expressed between the two conditions (L1-I vs. L1-NI) (Figure S4).
Discussion
Saccani et al. was one of the first articles to link LPS-induced inflammation and modification of epigenetic regulation of inducible inflammatory genes in human dendritic cells [Citation45]. Since then, multiple studies have shown that inflammation affects epigenetic regulation. At the same time, various works have described how MEC differentiation and activity is partly controlled by DNA methylation and how some epigenetic changes persist in MECs [Citation20,Citation46–48]. This article aims to further the knowledge on this topic by focusing on DNA methylation changes in mammary tissue caused by inflammation.
This study demonstrates how intramammary injection of LPS can induce inflammation in the mouse mammary gland during successive lactations. Detection of inflammation before the onset of clinical signs would allow faster and less aggressive treatment, yet little research exists on the early changes in DNA methylation and gene expression that occur at the beginning of inflammation in mammary tissue.
Here, fewer DMCs and DMRs were found in the three comparisons presented: inflammation during first lactation (L1-I vs. L1-NI), inflammation during second lactation with no history of inflammation (L2-I (L1-NI) vs. L2-NI (L1-NI)), and inflammation during second lactation with previous inflammation (L2-I (L1-I) vs. L2-NI (L1-I)), relative to RRBS results in other tissues, such as blood [Citation49]. Kochmanski et al. found 28 196 unique DMCs and 8 613 DMRs, whereas the comparisons here resulted on average in 432 DMCs and 20 DMRs [Citation49]. However, this is most likely due to the focus on asymptomatic inflammation in this model. The methylation levels of the majority of DMCs from each condition were evenly distributed, showing that the mammary tissue DNA is neither hypomethylated (DMCs at < 20% methylation) nor hypermethylayed (DMCs at > 80% methylation).
In both first lactation (L1-I vs. L1-NI) and second lactation (L2-I (L1-I) vs. L2-NI (L1-I)), DMCs and DMRs were mostly upmethylated when inflammation was present. Our findings of the effects of inflammation are consistent with those of established inflammation. Studied show that inflammation is known to increase DNA methylation in multiple cases, such as chronic gastritis [Citation50], insulin resistance [Citation51], and LPS-induced inflammation. However, notably, our results show this change in methylation occurs as early as 4 h after introducing LPS in the mammary gland. Unexpectedly, second lactation with no previous inflammation (L2-I (L1-NI) vs. L2-NI (L1-NI)) did not follow the same pattern, suggesting inflammation history affects future DNA methylation changes. DMCs and DMRs in that comparison were mostly downmethylated when inflammation was present. Some previous studies have shown a decrease in methylation in the global genomic landscape due to inflammation caused by ischaemic stroke [Citation52] or other neurodegenerative diseases [Citation53]; however, this finding has not been previously reported in articles discussing mammary gland inflammation.
Enrichment analysis showed that DMCs found in all three comparisons are significantly enriched for negative but not positive transcriptional regulation. This suggests a role for DNA methylation in the regulation of transcription in response to inflammation in the lactating mammary gland. Cell-cell adhesion and cell-cell junction organization, which are necessary in the mammary gland function in that they ensure milk secretion takes place in the mammary ducts, were only significantly enriched in first lactation (L1-I vs. L1-NI). This could be due to the fact that MECs, which are the majority of the cells in the lactating mammary gland, differ depending on lactation rank and shows that MECs in a second lactation are not identical in terms of DNA methylation changes. The epigenetic changes between lactation ranks are not well understood and should be studied further.
Looking at which genes were differentially methylated showed an interesting signalling pathway in first lactation (L1-I vs. L1-NI) – PPAR. The PPAR signalling pathway modulates lipid metabolism, adipogenesis, maintenance of metabolic homoeostasis, and inflammation [Citation54]. Two genes from this pathway are upmethylated in L1-I vs. L1-NI, Slc27a1 and PPARδ. Both of these genes are involved in the regulation of lipid metabolism, which is critically important during lactation [Citation55,Citation56]. Other studies have found that PPAR signalling is inhibited in bovine mammary tissue following Streptococcus uberis infection, leading to inhibition of milk fat synthesis [Citation57]. The findings here suggest that epigenetic regulation may play a part in that process.
Slc27a1 was also upmethylated in L2-I (L1-I) vs. L2-NI (L1-I); this is the only DMR that the two comparisons share. The only difference is the number of DMCs present for each comparison; it took five DMCs to determine Slc27a1 as a differentially methylated gene in L1-I vs. L1-NI versus three DMCs in L2-I (L1-I) vs. L2-NI (L1-I). We found two other DMCs in common between the two comparisons, both in the exons of JDP2. JDP2 (Jun dimerization protein 2) is a progesterone receptor coactivator [Citation58,Citation59] and has also been shown to act as a cofactor in NF-κβ-mediated gene repression, as its upregulation was associated with the downregulation of TNF-suppressed genes in human endothelial cells [Citation60]. Therefore, while JDP2 likely plays a role as a coregulator of the inflammatory cascade, the results here suggest that it is itself under the control of epigenetic regulators.
When comparing inflammation during first lactation (L1-I vs. L1-NI) and inflammation during second lactation with no history of inflammation (L2-I (L1-NI) vs. L2-NI (L1-NI)), we found two DMCs in common, corresponding to the Egr3 gene. Egr3 plays a role in cell proliferation and is upregulated by prolactin, an essential hormone during lactation, in breast cancer cells [Citation61].
For the comparisons of inflammation during second lactation with previous inflammation (L2-I (L1-I) vs. L2-NI (L1-I)) and inflammation during second lactation with no history of inflammation (L1-NI and L2-I (L1-NI) vs. L2-NI (L1-NI)), we found several DMCs in common that did not correspond to any known genes.
We found no epigenetic marks in common between all three comparisons, and few marks were present in more than one comparison. This finding suggests that differential methylation in mammary tissue is dependent not only on the presence of inflammation but also lactation rank and even the inflammation history of the tissue (whether inflammation occurred previously). This would also mean that diagnosing mastitis at an early stage would necessitate targeting different epigenetic marks for each lactation.
These data also show changes observed during LPS-induced inflammation (4 h) in genes important for epigenetic regulation and the immune response. In both first lactation (L1-I vs. L1-NI) and second lactation (L2-I (L1-I) vs. L2-NI (L1-I)), two genes were found to be differentially expressed: Set7 and CXCL1. SET7/9 is known to catalyse H3K4me1 [Citation55,Citation57] specifically; however, it is also involved in the methylation of nonhistone proteins such as P53, DNMT1 [Citation62], and P65 [Citation63]. SET7/9 regulates high glycaemia-induced inflammatory gene expression in endothelial cells [Citation64]. Monocytes are involved in TNFα-induced target inflammatory gene expression of the NF-κβ pathway [Citation65]. In MCF7 cells (human breast cancer cell line), SET7/9 appears to directly methylate oestrogen receptor α (ER), thereby increasing its stability and resulting in downstream oestrogen-responsive gene expression changes [Citation66]. Notably, ER is downregulated during galactopoesis [Citation67]. The findings of this study show that Set7 was overexpressed in mammary tissue when inflammation was present. Further study is required to establish whether this results in inflammatory gene expression changes.
The chemokine CXCL1 regulates immune responses through the activation and recruitment of neutrophils [Citation68]. In our study, CXCL1 was overexpressed in mammary tissue during inflammation, confirming previous observations [Citation69].
Furthermore, the study focused on the expression of genes essential in mammary gland function. Only four out of 20 genes whose expression we studied were differentially expressed; therefore, the expression of 16 genes related to mammary gland and function remained unchanged 4 h after the introduction of LPS. This strongly suggests that MECs continue to function despite the beginning of the immune response and the occurring changes in epigenetic regulation.
In the second lactation with no previous inflammation (L2-I (L1-NI) vs. L2-NI (L1-NI)), no DEGs in common with the other two comparisons were found. Instead, Wnt4 was underexpressed and TLR2 overexpressed in mammary tissue when inflammation was present. Wnt4 has an essential role in epithelial branching in early pregnancy and mediates progesterone function during mammary gland morphogenesis [Citation70]. TLRs signal the presence of pathogens to the host [Citation71]; TLR2 is known to be overexpressed during mastitis [Citation72]; the results presented here show that this overexpression starts before the appearance of clinical signs.
The lack of identical results between the three comparisons discussed in this study strongly suggests that inflammation is not the only factor affecting mammary tissue. Lactation rank and previous inflammation history appear to be just as, if not more important, when explaining mammary tissue gene expression and DNA methylation changes. Further study of the differences between two successive lactations on mammary cells is necessary, as little research exists on base-level epigenetic regulation in lactating mammary tissue. Moreover, in-depth analysis of changes in promoter regions, closely related to gene expression, and a functional validation of the DMRs mentioned here would expand on this topic. Long-term, this information could lead to identifying new epigenetic markers for early mastitis diagnosis [Citation73–76]
Supplemental Material
Download Zip (5.9 MB)Acknowledgments
This work has benefited from the facilities and expertise of @BRIDGE (GABI, INRAE, AgroParisTech, Université Paris-Saclay, 78350 Jouy-en-Josas, France). The mice used in this study were under the care of the staff of UE0907 IERP Infectiologie Expérimentale des Rongeurs et Poissons (INRAE, Jouy-en-Josas, France).
Disclosure statement
No potential conflict of interest was reported by the authors.
Data availability statement
RRBS fastq files have been deposited in the European Nucleotide Archive (ENA) at EMBL-EBI under accession number PRJEB57878 https://www.ebi.ac.uk/ena/data/view/PRJEB57878.
Supplementary material
Supplemental data for this article can be accessed online at https://doi.org/10.1080/15592294.2023.2215633.
Additional information
Funding
References
- Inman JL, Robertson C, Mott JD, et al. Mammary gland development: cell fate specification, stem cells and the microenvironment. Development. 2015;142(6):1028–19.
- Stewart TA, Davis FM. Got milk? Identifying and characterizing lactation defects in genetically-engineered mouse models. J Mammary Gland Biol Neoplasia. 2020;25(4):255–272.
- Lloyd-Lewis B, Harris OB, Watson CJ, et al. Mammary stem cells: premise, properties, and perspectives. Trends Cell Biol. 2017;27(8):556–567.
- Shackleton M, Vaillant F, Simpson KJ, et al. Generation of a functional mammary gland from a single stem cell. Nature. 2006;439(7072):84–88.
- Stingl J, Eirew P, Ricketson I, et al. Purification and unique properties of mammary epithelial stem cells. Nature. 2006;439(7079):993–997.
- Paludan SR, Bowie AG. Immune sensing of DNA. Immunity. 2013;38(5):870–880.
- Cao X. Self-regulation and cross-regulation of pattern-recognition receptor signalling in health and disease. Nat Rev Immunol. 2016;16(1):35–50.
- Sherwood ER, Toliver-Kinsky T. Mechanisms of the inflammatory response. Best Pract Res Clin Anaesth. 2004;18(3):385–405.
- Newton K, Dixit VM. Signaling in innate immunity and inflammation. Cold Spring Harbor Perspect Biol. 2012;4(3):a006049.
- Mizuno K, Hatsuno M, Aikawa K, et al. Mastitis is associated with IL-6 levels and milk fat globule size in breast milk. J Hum Lact. 2012;28(4):529–534.
- Zheng J, Watson AD, Kerr DE. Genome-wide expression analysis of lipopolysaccharide-induced mastitis in a mouse model. Infect Immun. 2006;74(3):1907–1915.
- Fontanini G, Campani D, Roncella M, et al. Expression of interleukin 6 (IL-6) correlates with oestrogen receptor in human breast carcinoma. Br J Cancer. 1999;80(3–4):579–584.
- Bannerman DD. Pathogen-dependent induction of cytokines and other soluble inflammatory mediators during intramammary infection of dairy cows1. J Anim Sci. 2009;87(suppl_13):10–25.
- Oviedo-Boyso J, Valdez-Alarcón JJ, Cajero-Juárez M, et al. Innate immune response of bovine mammary gland to pathogenic bacteria responsible for mastitis. J Infect. 2007;54(4):399–409.
- Jaenisch R, Bird A. Epigenetic regulation of gene expression: how the genome integrates intrinsic and environmental signals. Nature Genet. 2003;33(S3):245–254.
- Jones PA, Takai D. The role of DNA methylation in mammalian epigenetics. Science. 2001;293(5532):1068–1070.
- Strahl BD, Allis CD. The language of covalent histone modifications. Nature. 2000;403(6765):41–45.
- Bartel DP. MicroRNAs: target recognition and regulatory functions. Cell. 2009;136(2):215–233.
- Bird A. DNA methylation patterns and epigenetic memory. Genes Dev. 2002;16(1):6–21.
- Vanselow J, Yang W, Herrmann J, et al. DNA-remethylation around a STAT5-binding enhancer in the alphaS1-casein promoter is associated with abrupt shutdown of alphaS1-casein synthesis during acute mastitis. J Mol Endocrinol. 2006;37(3):463–477.
- Ramsahoye BH, Biniszkiewicz D, Lyko F, et al. Non-CpG methylation is prevalent in embryonic stem cells and may be mediated by DNA methyltransferase 3a. Proc Natl Acad Sci USA. 2000;97(10):5237–5242.
- Jonsson S, Pulkkinen MO. Mastitis today: incidence, prevention and treatment. Annales Chirurgiae Et Gynaecologiae Supplementum. 1994;208:84–87.
- Osterman KL, Rahm VA. Lactation mastitis: bacterial cultivation of breast milk, symptoms, treatment, and outcome. J Hum Lact. 2000;16(4):297–302.
- Amir LH, Academy of Breastfeeding Medicine Protocol Committee. ABM clinical protocol #4: mastitis, revised March 2014. Breastfeed Med. 2014;9(5):239–243. DOI:10.1089/bfm.2014.9984.
- Wambach KA. Lactation mastitis: a descriptive study of the experience. J Hum Lact. 2003;19(1):24–34.
- Fetherston C. Characteristics of lactation mastitis in a Western Australian cohort. Breastfeeding Review: Professional Publication Of The Nursing Mothers’ Association Of Australia. 1997;5(2):5–11.
- Michie C, Lockie F, Lynn W. The challenge of mastitis. Arch Dischildhood. 2003;88(9):818–821.
- Wöckel A, Beggel A, Rücke M, et al. Predictors of inflammatory breast diseases during lactation—Results of a cohort study. Am J Reprod Immunol. 2010;63(1):28–37.
- Seegers H, Fourichon C, Beaudeau F. Production effects related to mastitis and mastitis economics in dairy cattle herds. Vet Res. 2003;34(5):475–491.
- Thompson-Crispi K, Atalla H, Miglior F, et al. Bovine Mastitis: frontiers in Immunogenetics. Front Immunol. 2014;5:5.
- Fleige S, Pfaffl MW. RNA integrity and the effect on the real-time Qrt-PCR performance. Mol Aspect Med. 2006;27(2–3):126–139.
- Kozera B, Rapacz M. Reference genes in real-time PCR. J Appl Genet. 2013;54(4):391–406.
- Schneider CA, Rasband WS, Eliceiri KW. NIH Image to ImageJ: 25 years of image analysis. Nat Methods. 2012;9(7):671–675.
- Gu H, Smith ZD, Bock C, et al. Preparation of reduced representation bisulfite sequencing libraries for genome-scale DNA methylation profiling. Nat Protoc. 2011;6(4):468–481.
- Perrier J-P, Kenny DA, Chaulot-Talmon A, et al. Accelerating onset of puberty through modification of early life nutrition induces modest but persistent changes in bull sperm DNA methylation profiles post-puberty. Front Genet. 2020;11:945.
- Perrier J-P, Sellem E, Prézelin A, et al. A multi-scale analysis of bull sperm methylome revealed both species peculiarities and conserved tissue-specific features. BMC Genomics. 2018;19(1):404.
- Costes V, Chaulot-Talmon A, Sellem E, et al. Predicting male fertility from the sperm methylome: application to 120 bulls with hundreds of artificial insemination records. Clin Epigenetics. 2022;14(1):54.
- Krueger F, Andrews SR. Bismark: a flexible aligner and methylation caller for Bisulfite-Seq applications. Bioinformatics. 2011;27(11):1571–1572.
- Langmead B, Trapnell C, Pop M, et al. Ultrafast and memory-efficient alignment of short DNA sequences to the human genome. Genome Bio. 2009;10(3):R25.
- Akalin A, Kormaksson M, Li S, et al. methylKit: a comprehensive R package for the analysis of genome-wide DNA methylation profiles. Genome Bio. 2012;13(10):R87.
- Huang DW, Sherman BT, Lempicki RA. Bioinformatics enrichment tools: paths toward the comprehensive functional analysis of large gene lists. Nucleic Acids Res. 2009a;37(1):1–13.
- Huang DW, Sherman BT, Lempicki RA. Systematic and integrative analysis of large gene lists using DAVID bioinformatics resources. Nat Protoc. 2009b;4(1):44–57.
- Han Q, Kono TJY, Knutson CG, et al. Multi- omics characterization of inflammatory bowel disease-induced hyperplasia/dysplasia in the Rag2-/-/Il10-/- mouse model. Int J Mol Sci. 2020;22(1):E364.
- Anderson SM, Rudolph MC, McManaman JL, et al. Key stages in mammary gland development. Secretory activation in the mammary gland: it’s not just about milk protein synthesis! Breast Cancer Res. 2007;9(1):204.
- Saccani S, Natoli G. Dynamic changes in histone H3 Lys 9 methylation occurring at tightly regulated inducible inflammatory genes. Genes Dev. 2002;16(17):2219–2224.
- Nguyen M, Boutinaud M, Pétridou B, et al. DNA methylation and transcription in a distal region upstream from the bovine AlphaS1 casein gene after once or twice daily milking. PLoS ONE. 2014;9(11):e111556.
- Rijnkels M, Kabotyanski E, Montazer-Torbati MB, et al. The epigenetic landscape of mammary gland development and functional differentiation. J Mammary Gland Biol Neoplasia. 2010;15(1):85–100.
- Singh K, Erdman RA, Swanson KM, et al. Epigenetic regulation of milk production in dairy cows. J Mammary Gland Biol Neoplasia. 2010;15(1):101–112.
- Kochmanski J, Marchlewicz EH, Cavalcante RG, et al. Age-related epigenome-wide DNA methylation and hydroxymethylation in longitudinal mouse blood. Epigenetics. 2018;13(7):779–792.
- Kang GH, Lee HJ, Hwang KS, et al. Aberrant CpG island hypermethylation of chronic gastritis, in relation to aging, gender, intestinal metaplasia, and chronic inflammation. Am J Pathol. 2003;163(4):1551–1556.
- Petrus P, Bialesova L, Checa A, et al. Adipocyte expression of SLC19A1 links DNA hypermethylation to adipose tissue inflammation and Insulin resistance. J Clin Endocrinol Metab. 2018;103(2):710–721.
- Ng GY-Q, Lim Y-A, Sobey CG, et al. Epigenetic regulation of inflammation in stroke. Ther Adv Neurol Disord. 2018;11:175628641877181.
- Mogi M, Harada M, Narabayashi H, et al. Interleukin (IL)-1 beta, IL-2, IL-4, IL-6 and transforming growth factor-alpha levels are elevated in ventricular cerebrospinal fluid in juvenile parkinsonism and Parkinson’s disease. Neurosci lett. 1996;211(1):13–16.
- Fanale D, Amodeo V, Caruso S. The interplay between metabolism, PPAR signaling pathway, and cancer. PPAR Res. 2017;2017:1–2.
- Kanehisa M. KEGG: kyoto encyclopedia of genes and genomes. Nucleic Acids Res. 2000;28(1):27–30.
- McNamara JP. Lipid metabolism in adipose tissue during lactation: a model of a metabolic control system. J Nutr. 1994;124(suppl_8):1383S–1391S.
- Moyes KM, Drackley JK, Morin DE, et al. Gene network and pathway analysis of bovine mammary tissue challenged with Streptococcus uberis reveals induction of cell proliferation and inhibition of PPARγ signaling as potential mechanism for the negative relationships between immune response and lipid metabolism. BMC Genomics. 2009;10(1):542.
- Edwards DP, Wardell SE, Boonyaratanakornkit V. Progesterone receptor interacting coregulatory proteins and cross talk with cell signaling pathways. J Steroid Biochem Mol Biol. 2002;83(1–5):173–186.
- Wardell SE, Boonyaratanakornkit V, Adelman JS, et al. Jun dimerization protein 2 functions as a progesterone receptor N-Terminal domain coactivator. Mol Cell Biol. 2002;22(15):5451–5466.
- Kolovos P, Georgomanolis T, Koeferle A, et al. Binding of nuclear factor κB to noncanonical consensus sites reveals its multimodal role during the early inflammatory response. Genome Res. 2016;26(11):1478–1489.
- Rasmussen LM, Frederiksen KS, Din N, et al. Prolactin and oestrogen synergistically regulate gene expression and proliferation of breast cancer cells. Endocr Relat Cancer. 2010;17(3):809–822.
- Esteve P-O, Chin HG, Benner J, et al. Regulation of DNMT1 stability through SET7-mediated lysine methylation in mammalian cells. Proc Nat Acad Sci. 2009;106(13):5076–5081.
- Ea C-K, Baltimore D. Regulation of NF-κB activity through lysine monomethylation of p65. Proc Nat Acad Sci. 2009;106(45):18972–18977.
- El-Osta A, Brasacchio D, Yao D, et al. Transient high glucose causes persistent epigenetic changes and altered gene expression during subsequent normoglycemia. J Exp Med. 2008;205(10):2409–2417.
- Li Y, Reddy MA, Miao F, et al. Role of the histone H3 Lysine 4 Methyltransferase, SET7/9, in the regulation of NF-κB-dependent inflammatory genes. J Biol Chem. 2008;283(39):26771–26781.
- Subramanian K, Jia D, Kapoor-Vazirani P, et al. Regulation of estrogen receptor α by the SET7 lysine methyltransferase. Molecular Cell. 2008;30(3):336–347.
- Hatsumi T, Yamamuro Y. Downregulation of estrogen receptor gene expression by exogenous 17beta-estradiol in the mammary glands of lactating mice. Exp Biol Med. 2006;231(3):311–316.
- De Filippo K, Dudeck A, Hasenberg M, et al. Mast cell and macrophage chemokines CXCL1/CXCL2 control the early stage of neutrophil recruitment during tissue inflammation. Blood. 2013;121(24):4930–4937.
- Rainard P, Fromageau A, Cunha P, et al. Staphylococcus aureus lipoteichoic acid triggers inflammation in the lactating bovine mammary gland. Vet Res. 2008;39(5):52.
- Brisken C, Heineman A, Chavarria T, et al. Essential function of Wnt-4 in mammary gland development downstream of progesterone signaling. Genes Dev. 2000;14(6):650–654.
- Aderem A, Ulevitch RJ. Toll-like receptors in the induction of the innate immune response. Nature. 2000;406(6797):782–787.
- Goldammer T, Zerbe H, Molenaar A, et al. Mastitis increases mammary mRNA abundance of β-Defensin 5, Toll-Like-Receptor 2 (TLR2), and TLR4 but Not TLR9 in Cattle. Clin Vaccin Immunol. 2004;11(1):174–185.
- Berger SL. The complex language of chromatin regulation during transcription. Nature. 2007;447(7143):407–412.
- Bradbury JM, Edwards PAW, Niemeyer CC, et al. Wnt-4 expression induces a pregnancy-like growth pattern in reconstituted mammary glands in virgin mice. Dev Biology. 1995;170(2):553–563.
- Cheng C, Huang C, Ma T-T, et al. SOCS1 hypermethylation mediated by DNMT1 is associated with lipopolysaccharide-induced inflammatory cytokines in macrophages. Toxicol Lett. 2014;225(3):488–497.
- Chuikov S, Kurash JK, Wilson JR, et al. Regulation of p53 activity through lysine methylation. Nature. 2004;432(7015):353–360.