
ABSTRACT
The prevalence and severity of many diseases differs by sex, potentially due to sex-specific patterns in DNA methylation. Autosomal sex-specific differences in DNA methylation have been observed in cord blood and placental tissue but are not well studied in saliva or in diverse populations. We sought to characterize sex-specific DNA methylation on autosomal chromosomes in saliva samples from children in the Future of Families and Child Wellbeing Study, a multi-ethnic prospective birth cohort containing an oversampling of Black, Hispanic and low-income families. DNA methylation from saliva samples was analysed on 796 children (50.6% male) at both ages 9 and 15 with DNA methylation measured using the Illumina HumanMethylation 450k array. An epigenome-wide association analysis of the age 9 samples identified 8,430 sex-differentiated autosomal DNA methylation sites (P < 2.4 × 10⁻⁷), of which 76.2% had higher DNA methylation in female children. The strongest sex-difference was in the cg26921482 probe, in the AMDHD2 gene, with 30.6% higher DNA methylation in female compared to male children (P < 1 × 10−300). Treating the age 15 samples as an internal replication set, we observed highly consistent results between the ages 9 and 15 measurements, indicating stable and replicable sex-differentiation. Further, we directly compared our results to previously published DNA methylation sex differences in both cord blood and saliva and again found strong consistency. Our findings support widespread and robust sex-differential DNA methylation across age, human tissues, and populations. These findings help inform our understanding of potential biological processes contributing to sex differences in human physiology and disease.
Introduction
Health and disease outcomes differ between male and female children. For example, infectious diseases tend to show greater severity in male children than female children, purportedly due to the influence of sex hormones on immune function [Citation1]. Neuropsychiatric disorders, including autism spectrum disorder, bipolar disorder, and schizophrenia, show differential prevalence by sex, a phenomenon linked to brain development differences in youth and adolescence [Citation2,Citation3]. Sex differences are largely attributed to the genetic contribution of the sex chromosomes but are also influenced by sex hormones [Citation4], differential gene expression [Citation5], metabolites [Citation6], and epigenetic patterns, including DNA methylation [Citation4]. Widespread differences in autosomal gene expression between sexes are noted across numerous human tissues, although the effect sizes are small [Citation7].
DNA methylation (DNAm), the addition of a methyl group onto the fifth carbon of a cytosine residue in DNA, is itself associated with modulation of gene expression [Citation8]. DNAm is involved in genomic imprinting, in which genes are expressed in a parent-dependent manner, and in X chromosome inactivation, the silencing of gene expression on the X chromosome in female mammalian cells to achieve dosage compensation [Citation8]. Many DNAm sites remain stable over the life course and many other sites may change with development, age, and environmental inputs [Citation9]. Thus, DNAm can be an informative biomarker for disease, developmental stage, and environmental exposures [Citation10] and may play a crucial role in sex-specific health outcomes in children.
Sex differences in DNAm are expected on the X chromosome in humans due to X chromosome inactivation (Hall et al., 2014; Duncan et al., 2018). However, sex differences in DNAm have also been reported on autosomal chromosomes in numerous tissues including blood [Citation7,Citation11–13], buccal cells [Citation14,Citation15], the prefrontal cortex [Citation16], and the placenta [Citation17,Citation18]. The number of differentially methylated sites ranged from a few hundred to nearly ten thousand in these studies, depending on the tissue, DNAm array, and available sample sizes. All tissues except for placenta had a larger proportion of sites with higher DNAm in female subjects compared to male subjects. A recent meta-analysis identified 31,727 autosomal DNAm sites that were differentially methylated by sex in cord blood tissue of newborns and subsequently replicated in peripheral blood tissue samples [Citation13]. Further investigation of sex-specific DNAm patterns across autosomes can elucidate the underlying genes and biological mechanisms that contribute to sex differences in disease and health outcomes.
Most prior studies of sex and DNAm were cross-sectional investigations of either newborns or adults of European descent. The methylation profiles of adults are subject to accumulated lifetime exposures, which can alter inherited DNAm states and confound sex-specific profiles. Studies confined to single ancestry groups potentially limit generalizability. Moreover, few studies have biological samples at multiple time points on the same individuals. Studies that have analysed sex differences in DNAm over time are based on cord blood and peripheral blood samples and identified largely stable sex-specific DNAm patterns from birth to late adolescence [Citation13,Citation19]. Few epigenetic studies of sex difference have been conducted in children and adolescents using saliva [Citation15,Citation20], a more easily collected tissue [Citation21]. Those that have been conducted, favour non-diverse, convenience samples. In a volunteer sample of saliva tissue from 118 children aged 9–14, 5,273 sites were differentially methylated by sex (FDR < 0.05) using the EPIC BeadChip [Citation15]. However, larger and more diverse studies of autosomal DNAm in the saliva of children are warranted to gain biologic insights.
This paper aims to characterize autosomal DNAm sex differences in saliva in a large, population-based sample from the Future of Families and Child Wellbeing Study (FFCW), a longitudinal cohort of racially diverse children born to unmarried parents across large cities in the United States [Citation22]. We analysed DNAm data assayed on the Illumina HumanMethylation 450k BeadArray from saliva samples obtained at two distinct time points, ages 9 and 15, on the same set of children assayed at the same time. We tested for sex-specific differences across the genome at both ages, evaluated consistency across the time points, and compared with results from prior studies of sex-differential DNAm in children.
Methods
Future of Families and Child Wellbeing (FFCW) study
The FFCW Study is a cohort study of 4,898 children from 20 cities in the United States [Citation22]. FFCW was designed to investigate the environmental and social factors that shape the development of at-risk children and contains an oversampling of Black, Hispanic and low-income families [Citation22]. Study personnel obtained baseline information on child participants and parents and/or caregivers at the time of the child’s birth, between 1998 and 2000. Follow-up data was collected at key developmental stages: ages one, three, five, nine, and fifteen. Interviewers collected information on relationships, attitudes, behaviours, mental and physical health, clinical health, economic and employment status, neighbourhood characteristics, and demographic variables of parents and/or caregivers and children at each time point. Further details on the study design can be found at https://ffcws.princeton.edu/. At age 9 and age 15, the focal children were interviewed directly and saliva samples were taken from children whose primary caregivers provided informed consent. The original participant data collection was approved by the Princeton University Institutional Review Board and this secondary data analysis was approved by the University of Michigan Institutional Review Board (HUM00129826). For this analysis, we accessed survey data through the Future of Families and Child Wellbeing website.
A total of 3,400 FFCW children had survey data available at age 9, and 2,881 of these children provided a saliva sample. The FFCW study measured DNAm on 837 of these children at age 9. Of those with methylation data at age 9, 817 children had methylation data for their age 15 saliva sample. Of these 817 children, we excluded those with discordant sex and those missing data for variables of interest: sex, poverty ratio, mother’s self-reported race/ethnicity, mother’s education, mother’s health status, and mother’s smoking status – all at baseline – and child’s age in months and child’s BMI at age 9. We treated the age 9 DNAm data as a discovery dataset and the age 15 DNAm data as an internal replication dataset.
Demographic measurements
Numerous measurements were collected on FFCW children and caregivers. We selected the following variables measured at child’s birth for inclusion in this analysis: child’s biological sex (male or female) as reported by the mother; child’s birth city (Detroit/Toledo/Chicago vs. other); the mother’s poverty status, computed as the ratio of the mother’s reported household income to the United States Census Bureau national poverty threshold for the prior year; self-reported race/ethnicity (White non-Hispanic, Black non-Hispanic, Hispanic, or Other) and education level (less than high school, high school or equivalent, some college or technical school, or college/graduate school) of both the mother and father; maternal smoking habits during pregnancy (none, less than 1 pack per day, ≥1 packs per day), and self-reported maternal health status at baseline (within 48 hours of giving birth: great, very good, good, fair/poor). The BMI of the mother and focal child was collected at the home interview visits at age 9 and age 15. The child’s precise age in months was also recorded at the home interviews. Child’s birth city was dichotomized as Detroit/Toledo/Chicago vs. other because a subset of FFCW children were oversampled for DNAm measurements for use in the Study of Adolescent Neurodevelopment [Citation23,Citation24], which investigated neurodevelopment among children primarily from Detroit, Toledo, and Chicago.
DNA methylation data
Saliva samples were collected at ages 9 and 15 using the Oragene® DNA Self-Collection Kit (DNA Genotek Inc., Ontario, Canada) and shipped to Princeton University for extraction and processing. Samples from both time points were plated and processed simultaneously on the Illumina HumanMethylation450k BeadChip (Illumina, San Diego, CA). This array contains probes for 485,512 DNAm sites across the genome [Citation25]. Plates contained a mix of age 9 and age 15 samples to mitigate potential batch effects.
DNAm image data was processed using the minfi package [Citation26] and the enmix package [Citation27] in R statistical software (version 3.5). The image data pairs (n = 1,811) were read into an RGChannelset using minfi and the enmix preprocessENmix function applied RELIC to correct for dye bias and out of band normalization to correct for background noise. The rcp function from enmix used applied linear regression calibration between correlated Type I and Type II probe pairs to adjust for probe-type bias. For every sample, we measured the DNAm level at each site across the epigenome via a beta (β) value: the ratio of methylated fluorescent signal to total fluorescent signal (methylated + unmethylated signal) [Citation28]. The β-value is a continuous measure between 0 and 1 and is interpreted as the proportion of DNA copies that are methylated at a given locus for an individual. A value of 0 indicates all DNA copies are unmethylated at a given site, and a value of 1 denotes all DNA copies are methylated at that site [Citation29]. We define the beta matrix as the set of beta-values across all probes for all samples.
We performed probe-level quality control filtering on the beta matrix, including both the age 9 and age 15 methylation data, and was visualized using a flow chart. We removed probes with a detection p-value >0.01 or methylated/unmethylated bead count <4 in more than 5% of samples (n = 47,930 probes) using ewastools [Citation30]. We then removed the remaining SNP probes (n = 59) and cross-reactive probes (n = 27,141 probes), identified via a Basic Local Alignment Search Tool (BLAST) search based on a list of known cross-reactive probes [Citation31]. N = 410,447 probes remained after filtering. We identified gap probes (outCutoff = 0.01, threshold = 0.05) with multi-modal distributions and probes mapping to sex chromosomes using the minfi package in Bioconductor [Citation26]. We annotated DNAm sites to genomic features using the Islands UCSC dataset from the IlluminaHumanMethylation450kanno.ilmn12.hg19 package in Bioconductor [Citation32]. The hg19 genome build was used for gene annotation.
Individual children were filtered out based on the following criteria: >10% of sites with a detection p-value >0.01 or bead count <4 after removing previously mentioned poor quality probes (n = 34), discordant mother-reported sex and DNA methylation-predicted sex (n = 11), and if two sequential samples from the same individual exhibited genetic discordance between visits (n = 27). We removed samples with outlier methylation values, identified using the enmix QCinfo function (n = 6). We also removed technical replicates (one each from 49 pairs, preferentially selecting the first run sample as the ‘original’). After individual-level filtering, there were N = 796 children left. A sample dropped due to quality control at age 9 also eliminated the age 15 sample from analysis and vice versa.
We estimated the cell-type proportion in each saliva sample using the Houseman algorithm implemented in the estimateLC function in the ewastools package [Citation30], using the children’s saliva reference panel [Citation33]. This method uses a reference DNAm database and employs linear constrained projection to infer the proportion of epithelial and immune cells in saliva tissue [Citation34].
Statistical analysis
All analyses were performed using R statistical software (version 4.0.3). Code to conduct analyses is available online (https://github.com/bakulskilab). We conducted analyses separately on the age 9 discovery data and the age 15 internal replication data. We calculated bivariate descriptive statistics and compared the distributions of demographic variables between the analytic samples (N = 796) and excluded samples (N = 2,604), and subsequently between male (N = 403) and female (N = 393) children in the analytic sample. We used Pearson’s chi-squared test for categorical variables and Wilcoxon rank-sum test for continuous variables using the gtsummary package [Citation35] in R.
We conducted principal component (PC) analyses of the autosomal DNAm data. Variables with ANOVA association p-value <0.05 for one of the top three principal components were considered as potential confounding variables and included as covariates in regression modelling.
Sex-specific differential methylation analysis
We first tested for global DNAm differences by sex among autosomal sites. We computed a global methylation score per sample, defined as the average beta-value per child across all probes. We tested for sex differences in the global methylation scores using a mixed effects model adjusting for potential confounding variables identified through the principal component analysis: main effect terms for epithelial cell proportion and mother’s race/ethnicity, and a random effect for plating batch.
We then performed an epigenome-wide association analysis (EWAS) to identify differences in individual methylation sites between male and female children. We excluded gap probes from this analysis. For each probe, we fit a linear model using the lmFit function in the limma package [Citation36] with methylation beta-value as the outcome and the sex of the child as the exposure of interest. We included fixed effect terms to control for epithelial cell proportion and mother’s self-reported race/ethnicity, and a random effect term for sample plate using the correlation argument in lmFit. The between-plate correlation was estimated using the duplicateCorrelation function in limma. The same model was used for both the age 9 discovery data and the age 15 replication data. The lmFit algorithm uses an empirical Bayes approach that computes a moderated t-statistic for each probe, for which the standard error is smoothed across all probes in the array for a more efficient standard error estimate [Citation36]. We used an epigenome-wide p-value significance threshold of 2.4 × 10⁻⁷ which is recommended for epigenome-wide association studies performed on the Illumina 450K array [Citation37]. As a secondary analysis, we ran the same main model using only DNAm sites located on the X chromosome.
Sensitivity analyses
We performed a sensitivity analysis on the age 9 sex-specific EWAS to confirm that the covariates included in our models properly accounted for latent sources of variation in the DNAm data. We estimated data-derived surrogate variables in the age 9 methylation beta matrix after protecting the effects of sex, epithelial cell proportion, and mother’s race/ethnicity using the sva function from the sva package [Citation38]. We added the resulting top 10 surrogate variables to a model including sex, epithelial cell proportion, and mother’s race. We then compared the magnitude and significance of the sex regression parameters between the main model and the surrogate variable-adjusted model using Spearman’s correlation.
A second sensitivity analysis was performed to address the potential effects of birth city on DNAm due to pollution and/or environmental differences. We repeated the EWAS analysis including a fixed effect term for Study of Adolescent Neurodevelopment oversampled birth city (Detroit/Toledo/Chicago vs Other) in addition to the original list of potential confounding variables. We compared the sex-difference regression parameters to those from the main model.
Differential methylation region analysis
We used the DMRcate package [Citation39] to identify differentially methylated regions between males and females. We used the recommended parameters lambda = 1,000 and C = 2, corresponding to a region being defined as a collection of at least two significant DNAm sites identified from the previous single-site analysis (P < 2.4×10⁻⁷) that were no more than 1,000 base pairs apart.
Gene set enrichment analysis
Gene ontology enrichment analysis was performed on sites that were significant in the age 9 sex-specific discovery analysis. We used the gometh function in the missMethyl package [Citation40], which takes probe names and links them to DNAm sites on the 450K array and their corresponding Entrez gene IDs. The function employs Wallenius’ noncentral hypergeometric test and accounts for the uneven DNAm site distribution across genes. We report gene ontology terms overrepresented at FDR < 0.05.
Genomic feature enrichment analysis
We performed genomic feature enrichment analysis to determine the CpG island locations and regulatory elements that were enriched for differentially methylated sites identified at age 9. We mapped each DNAm site to North Shore, South Shore, North Shelf, South Shelf, CpG Island, or Open Sea regions using the Islands UCSC dataset from the IlluminaHumanMethylation450kanno.ilmn12.hg19 package [Citation32]. We used a chi-square test of homogeneity to determine enrichment or underrepresentation of significant sites in each region, with the expected proportion per region equal to the proportion of all sites located in the given region. Enrichment analysis was performed for hypermethylated sites in males and hypermethylated sites in females individually, and as a whole. We next used the eFORGE tool [Citation41] to determine enrichment of age 9 differentially methylated sites across 15 different chromatin states from the Roadmap Epigenomics database, using recommended parameters of a 1,000 bp window size, a background repetition of 1,000, a strict p-value threshold of 0.01, and a marginal p-value threshold of 0.05. We tested the top 1,000 (the maximum allowable number of probes) most significant sites hypermethylated in males and females, separately.
Internal replication using age 15 data
We performed an internal replication of the age 9 results using the age 15 data. We used the same procedures described for the age 9 data to detect gap probes. We performed a sex-specific methylation regression analysis across all autosomal sites passing QC in the age 15 data, employing the same main model. We tested each epigenome-wide significant age 9 site for replication in the age 15 data. We defined an age 9 site as replicated if the age 15 p-value for the site had a p-value smaller than a Bonferroni-corrected threshold accounting for the number of significant probes in the age 9 data and consistent direction of effect with the age 9 analysis. We also identified sites with sex-specific DNAm in the age 15 data using the epigenome-wide significance threshold of 2.4 × 10⁻⁷. We additionally conducted differential methylation region analysis and enrichment analyses for the age 15 data using the approaches described above.
Comparison to cord blood tissue
We compared our age 9 DNAm EWAS results in this FFCW analysis to a published set of differentially methylated sites from a meta-analysis in peripheral blood tissue in children aged 5.5 to 10 y across 9 cohorts from the Pregnancy and Childbirth Epigenetics (PACE) consortium [Citation13]. Specifically, we used 40,219 DNAm sites identified as significant (P < 1.3×10⁻⁷) in a sample of N = 8,438 newborns and replicated in an independent group of N = 4,268 older children (P < 1.1×10⁻⁶). The main model was fit on methylation beta-values and adjusted for sex, white blood cell proportion, and batch [Citation13]. We used Spearman’s correlation to compare adjusted effect estimates between the two studies.
Comparison to saliva tissue in prior study
We compared our age 9 DNAm EWAS results in this FFCW analysis to a published set of differentially methylated sites identified in saliva samples of N = 118 children aged 9–14 years using the EPIC BeadChip [Citation15]. Participants were recruited from the San Francisco Bay Area, with 54% of the sample reporting as Caucasian. The main model adjusted for sex, age, ethnicity and estimated cell-type proportion. We compared adjusted effect estimates for sex using Spearman’s correlation.
Results
Study sample characteristics
The analytic cohort was composed of 796 children from the FFCW cohort with both age 9 and age 15 methylation measurements that passed quality control, and non-missing data for covariates of interest (Supplemental Figure S1). The analytic cohort was 50.6% male (n = 403) and 49.3% female (n = 393). The overall median poverty index was 1.4, with nearly 35% of the children born to families in poverty (poverty index < 1). The largest proportion (17.7%) of the cohort was born in Detroit, followed by Richmond, Austin, and Oakland (9.3%, 7.7%, 7.0%, respectively). In this sample, 55% of mothers self-reported as Black non-Hispanic; 21% of mothers were Hispanic, 20% identified as White non-Hispanic, and 3.4% reported as other. At baseline, 62% of mothers reported having a high-school degree or less. Further, 80% of mothers reported no smoking behaviours at baseline. Male and female children had comparable values for poverty index, maternal self-reported race, maternal education level, and maternal smoking status at birth (). The median age 9 BMI was slightly higher in female children than male children, 18.4 compared to 17.8. We did not observe practical differences in demographics between the children in the analytic cohort with the broader FFCW cohort (Supplemental Table S1).
Table 1. Future of Families and Child Wellbeing Study sample characteristics at age 9, by sex (N = 796).
DNA methylation data
We identified 410,447 DNAm sites that passed probe-level quality control filtering for both age 9 and age 15 measurements (Supplemental Figure S2), including 401,545 autosomal sites. We excluded n = 8,896 sex-chromosome specific sites from the main analysis. The distribution of average beta-values across samples per site at age 9 was bimodal with ~70% of sites having beta-value ≤0.10 (10% DNAm) or ≥0.90 (90% DNAm). The peaks correspond to sites that are either unmethylated in all samples (beta = 0) or methylated in all samples (beta = 1) (Supplemental Figure S3A). The distribution of average beta-values was similar in the age 15 methylation data (Supplemental Figure S3A). We identified 12,581 sites inferred to be gap probes in age 9 data and 11,485 sites in age 15 data (Supplemental Figure S3B), leaving a total of 391,980 sites for the age 9 analyses and 392,967 sites for the age 15 analyses. Principal component analysis of the methylation data revealed that cell-type composition, sex, and sample plate were associated with individual PCs (Supplemental Figure S4) and were thus controlled for in subsequent sex-specific analyses. We also adjusted for mother’s self-reported race/ethnicity to account for race/ethnic and/or ancestry differences in DNAm patterns, which have been reported in the literature [Citation42,Citation43].
Sex-specific DNA methylation differences at age 9
We first compared global methylation between male and female children. Overall, the mean global methylation at age 9 was 49.35% (median: 49.56%), with female children having slightly higher mean global methylation than male children (49.31% vs 49.27%). After adjusting for age, cell-type proportion, sample plate, and mother’s race/ethnicity, the mean global beta-value was slightly higher though not significant in female children (bsex = 0.03, P = 0.48).
We next performed a probe-level Epigenome-wide Association Analysis to identify individual sites with differential methylation between sexes, controlling for cell-type proportion, batch and mother’s race/ethnicity. We identified 8,430 autosomal DNAm sites differentially methylated by sex at age 9 of the 391,980 sites tested (P < 2.4×10⁻⁷; ), indicating widespread differential methylation by sex in saliva. The majority of the significant sites (n = 6,425, 76.22%) had higher average methylation in female children compared to male children, and an average adjusted absolute difference of 2.8%. Notably, the mean beta-values for significant sites have a roughly uniform distribution across the [0,1] interval, which differs from the bimodal pattern of mean beta-values observed across all sites (). We present full results for each CpG site ranked by association p-value in Supplemental Table S2. The two most significant sites, cg26921482 and cg11643285, were both hyper-methylated in female children and annotated to the AMDHD2 and RFTN1 genes, respectively. The third most significant site, cg02325951, was hypermethylated in males and mapped to the FOXN3 gene. Additionally, we found that 91.6% (8,151 of 8,896) of X chromosome sites were differentially methylated by sex with an average adjusted absolute difference of 22.2%.
Figure 1. characteristics of differentially methylated sites in the Future of Families and Child Wellbeing Study sample, age 9 (N = 796). a: Adjusted difference in autosomal DNA methylation between female and male children for each site (n = 391,980 sites) in the Fragile Families and Child Wellbeing Study sample, age 9 (N = 796). Effect sizes and -log10 p-values are from the main model containing fixed effects for sex, epithelial cell proportion, and mother’s race/ethnicity and a random effect for sample plate. Positive effect sizes indicate sites for which DNA methylation was higher in female children, while negative effect sizes represent sites for which DNA methylation was higher in male children at age 9. 8,430 sites achieved genome-wide significance at P = 2.4× 10⁻⁷ (horizontal dotted line), with n = 6,425 (76.2%) having higher methylation in female participants. b: Distributions of mean DNAM for differentially methylated sites (n = 8,430; dashed line) and remaining sites (n = 383,550). c: Distribution of differentially methylated sites in relation to CpG islands. Fragile Families and Child Wellbeing Study sample, age 9 (N = 796).
Our sensitivity analysis using surrogate variable adjustment produced p-values (r = 0.81) and sex-effect estimates (r = 0.93) strongly correlated with the main analysis, indicating that controlling for cell-type composition, sample plate, and maternal race/ethnicity was likely sufficient. The sex regression parameter estimates were nearly identical (Supplemental Figure S5) and 83.4% of all significant sites were common to both models. Moreover, accounting for the birth city of the child resulted in little change in the sex-effect estimates (r = 0.99).
Enrichment in genomic features among differentially methylated probes at age 9
The differentially methylated sites for which females had greater DNAm than males were enriched for biological processes related to behaviour (PFDR <0.001), cell–cell signalling (PFDR = 0.022), and regulation of ion transport (PFDR = 0.041). These sites were also enriched in repressive polycomb regions (PFDR <0.01), which have been characterized by repressed gene expression [Citation44]. Conversely, sites with higher methylation in males were enriched in active transcriptional start sites (PFDR <0.01). None of the biological process gene ontology terms achieved FDR < 0.05 for sites hypermethylated in males. Differentially methylated sites were enriched within North Shore and South Shore regions, as well as CpG islands, but underrepresented in Shelves and Open Sea regions for both the female-hypermethylated sites and the male-hypermethylated sites (Supplemental Table S3). This pattern of enrichment remained the same for significant sites overall ().
Differentially methylated regions at age 9
We conducted differentially methylated region (DMR) analysis to identify gene-associated clusters of differentially methylated sites. We identified 1,499 DMRs between female and male children, with 1,197 regions (79.9%) characterized by higher average DNAm in female children. The regions of strongest significance were HLA-DQB2, SCAND3, PPP1R3G and RP11-373N24.2 (top 15 regions presented in Supplemental Table S4). The DMR annotated to PPP1R3G was also identified in newborn cord blood tissue [Citation13,Citation45]. Among significant DMRs with the largest positive mean difference in sex were PPFIA3 and ZPBP2. PPFIA3 is involved in axon guidance and mammary gland development, while ZPBP2 (Zona Pellucida-Binding Protein), expressed in the testis, is associated with sperm – oocyte binding during fertilization [Citation46].
Replication in age 15 methylation data
We used the age 15 DNAm data as an internal replication set to confirm the strong sex-specific methylation in saliva at age 9. It is important here to reiterate that the age 9 and age 15 samples were plated and processed at the same time. Average beta-values for individual sites were strongly correlated between age 9 and age 15 (Spearman Correlation = 0.9997; Supplemental Figure S3A). Gap probe identification was largely concordant (Supplemental Figure S3B) with 79.14% of gap probes identified at age 9 also flagged at age 15 and 86.69% of gap probes identified at age 15 flagged at age 9.
Of the 8,430 sites significant in the age 9 analysis, 7,421 (88%) were replicated among the age 15 DNAm data (Bonferroni alpha = 0.05/8430 = 5.93×10⁻⁶ and consistent direction of effect). Of the significant differentially methylated sites at age 9, the top 419 sites, ranked by p-value, were replicated at age 15 using the Bonferroni-corrected significance threshold. Of the 1,009 sites that did not replicate at this threshold, 99.8% had the same direction of effect in the age 9 and age 15 data. Ten sites were excluded during age 15 QC and not tested. Full results for each CpG site for age 15 can be seen in Supplemental Table S2 (ranked by age 9 p-value).
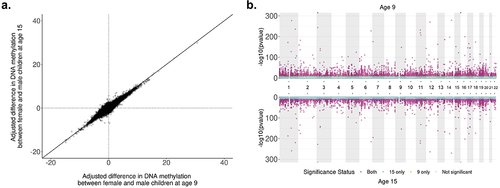
We found that 64.31% of all significant DNAm sites were common to both time points at the epigenome-wide significance level and had the same direction of effect and similar magnitudes (Spearman correlation = 0.99). The sex-difference effect sizes between the two time points were moderately correlated (r = 0.53; ) across time points, while adjusting for cell-type proportion, plating, and race/ethnicity differences. Thus, DNAm sites that were found significant at age 9 were likely to be significant at age 15. DNAm sites found significant at only one time point had p-values only marginally above the significance threshold at the other time point (). We identified 1,845 probes that were significant at the epigenome-wide significance level in the age 15 data that were not significant at age 9. Of these, 98.1% had the same direction of effect at age 9. Differentially methylated region analysis using the age 15 data identified 1,552 differentially methylated regions, resulting in a 71.46% concordance of region-associated overlapping genes across time points (Supplementary Table S5).
Figure 2. comparison of adjusted sex differences in autosomal DNA methylation between ages 9 and 15 in the Future of Families and Child Wellbeing Study (N = 796, n = 390,659 sites). a: Correlation of adjusted difference in autosomal DNA methylation (%) by sex between ages 9 and 15 in the Future of Families and Child Wellbeing Study (n = 390,659 sites). Effect sizes at each time point are from the main model adjusting for sex, epithelial cell proportion, mother’s race/ethnicity at baseline and a random effect for plate. Positive percentages are sites for which female children had higher DNA methylation than males. Spearman’s correlation = 0.53. b: Miami plot of sex-specific DNAm analyses at ages 9 and 15 in the Future of Families and Child Wellbeing Study sample (N = 796). P-values are reported from the main model containing sex, epithelial cell proportion, maternal race/ethnicity at baseline, and a random effect for sample plate. A threshold of P = 2.4 × 10⁻⁷ is used for genome-wide significance.
Comparison to cord blood tissue
Solomon et al. reported 40,219 sites differentially methylated by sex in peripheral blood tissue of children aged 5.5 to 10 y old at a p-value threshold of 1.1 × 10⁻⁶ in the PACE cohort [Citation13]. Of these sites, 37413 were also tested in our analysis. Sites that were not tested (n = 2,806) were excluded as either a gap probe (n = 214) or due to quality control procedures (n = 2,592). We found a high correlation (Spearman correlation = 0.89) between sex-difference effect sizes from the age 9 analysis of saliva tissue and the peripheral blood tissue analysis () [Citation13]. Two DNAm sites were identified in the ten most significant sites in both analyses: cg26921482 on chromosome 16, TBC1D24/AMDHD2; cg17238319 on chromosome 3, RFTN1.
Figure 3. comparison of adjusted differences in DNA methylation between saliva tissue from the Future of Families cohort and cord blood tissue from Solomon et al., 2022 (Spearman correlation = 0.89).
Comparison to saliva tissue
Moore et al. reported 5,273 sites differentially methylated by sex (FDR <0.05) in saliva tissue of children aged 9–14 y [Citation15]. A total of n = 794,811 sites were tested using the EPIC BeadChip. Of the 5,273 significant sites, 1,885 sites were not tested in our analysis due to the use of different BeadChip technologies or removal during quality control. Of the 3,388 significant sites tested in both analyses, 2,476 sites were significant in both (73%). Of the 912 sites that were not significant in both analyses, 862 (94.5%) sites had the same direction of effect, but magnitudes of effect were lowly correlated (Spearman correlation = 0.25). The effect estimates of the n = 3,388 commonly tested sites were moderately correlated (Spearman Correlation = 0.48).
Discussion
In a large, diverse sample of children (n = 796), we observed widespread and consistent autosomal DNAm differences in saliva between male and female children at ages 9 and 15. Specifically, we observed 8,430 sex-associated (P < 2.4×10⁻⁷) autosomal DNAm sites, and the majority (76.2%) of sites had higher DNAm in female children. Sex-specific DNAm sites were annotated to genes enriched for biologic pathways including behaviour, cell signalling, and ion transport. These findings were consistent across DNAm measurement time points (Spearman correlation = 0.53) and consistent with prior literature in cord blood (Spearman correlation = 0.82) and saliva (Spearman correlation = 0.48). Taken together, these findings suggest that sex-specific DNAm differences on autosomal chromosomes are largely robust to tissue and age and generalize across populations.
Our findings are consistent with previous reports. Our strongest association was cg26921482, annotated to the Amidohydrolase Domain Containing 2 (AMDHD2) gene, in which female participants had 30.6% higher DNAm. The Pregnancy And Childhood Epigenetics Consortium similarly observed that female infants had 23% higher DNAm at cg26921482 in cord blood at birth relative to male infants [Citation13]. Although these studies differ in tissues, developmental time periods, and demographics, the observed DNAm differences are large in magnitude (23–30%) and consistent in direction. AMDHD2 codes for a protein involved in amino-sugar metabolism and the hexosamine biosynthetic pathway, which is a minor branch of glycolysis [Citation47]. The hexosamine biosynthetic pathway may play a role in insulin resistance and diabetes [Citation48]. The Human Protein Atlas reports the AMDHD2 protein is present in higher levels in endocrine tissues and in male tissues including the testes [Citation49]. In addition, the newborn Pregnancy and Childbirth Epigenetics consortium study observed a sex-specific differentially methylated position (cg11092486) annotated to the Protein Phosphatase 1 Regulatory Subunit 3 G (PPP1R3G) gene with 15.2% lower DNAm in male participants relative to female [Citation13]. We also observed a sex-specific differentially methylated region associated with the PPP1R3G gene. The PPP1R3G protein plays a role in glycogen biosynthesis and lipid metabolism [Citation50]. DNAm differences at an AMDHD2 site and in the PPP1R3G region by sex are consistent across tissues and developmental time, with implications for metabolism.
We observed that sex-specific DNAm sites were more likely to occur at the shores of CpG islands. For example, 10.4% of the DNAm array was annotated to the South Shore, while 18.3% of our sex-specific sites were annotated to the South Shore. Prior findings in pancreatic islet cells suggest that sex-specific differential DNAm mainly occurs at CpG shores, and not in CpG islands [Citation51]. Our sex-specific differentially methylated sites were enriched for repressive polycomb chromatin state regions, which are associated with repressed gene expression [Citation44], and which play important roles in development and stem cells [Citation52], as well as Alzheimer’s disease and cancer [Citation53]. Enrichment in repressive polycomb regions may suggest that these DNAm differences have implications for gene expression, and future studies may be able to link DNAm and RNA levels.
Many diseases and disorders have a sex-specific bias in risk or prevalence, and these same conditions have DNA methylation implicated in their pathophysiology. For example, schizophrenia is 1.4-times more likely to occur among males than females [Citation54]. DNAm differences have been observed in brain tissue and blood comparing patients with schizophrenia to subjects without the disorder [Citation55,Citation56]. Furthermore, emerging evidence demonstrates the schizophrenia DNAm signatures may have sex-specific differences in DNAm [Citation57]. Similarly, most autoimmune disorders are more common in women, including lupus and rheumatoid arthritis [Citation58]. DNAm regulates immune cell differentiation, and dysregulation can induce immune cell auto reactivity, affecting the risk of autoimmune disorders [Citation59].
Our study had several limitations, which may support future opportunities for research. Our study time period with at children ages 9 and 15 likely spanned the pubertal window for many children [Citation60]. We were not able to include the timing of pubertal onset or duration in our models, and future studies may be able to track DNAm changes throughout puberty. We observed high correlation (Pearson correlation = 0.56) but not perfect correlation between sex-specific associations at the ages 9 and 15 time points, and other cohorts may be able to investigate longitudinal changes during this period, sensitive to pubertal differences. Though we tested for replication with prior studies in other tissues, we were not able to identify many other diverse cohorts with saliva DNAm for formal meta-analysis. The widespread findings observed in saliva in this cohort warrant a future meta-analysis and epigenetics consortia may be able to help facilitate these collaborations. We focused on autosomal chromosomes and provided results on sex chromosomes in the supplement to support further inquiries.
Because of our large sample size, our DNAm measures required several plates and thus potential technical artefacts resulting from batch effects. Consistent with other studies [Citation61], we observed technical variation in the DNAm measures by sample plate (Supplemental Figure S3a) and we adjusted for sample plate by incorporating a random effect term in our regression models. Importantly, the FFCW samples were randomized across plates by demographic factors including sex. To account for potential unmeasured confounding or technical variation, we additionally performed a sensitivity analysis using surrogate variables, and observed that our findings were robust.
Several factors contribute to the strength and breadth of this study. First, the study sample includes non-Hispanic Black and Hispanic participants who are currently underrepresented in genetic and epigenetic research [Citation62]. Ensuring the participation of diverse populations in research is important to assess the generalizability of findings [Citation62]. Second, the study sample size of 796 is larger than many previous single cohort epigenome-wide association studies, which increases the study power to detect associations. Third, the study design includes repeated DNAm measures, which allowed us to assess persistence and reliability of measures. Importantly, samples from both ages were processed at the same time in the laboratory and participant paired samples from ages 9 and 15 were measured on the same slides (and thus plates), which minimized technical batch effects with respect to participant age. Fourth, we assessed participant sex using two methods (questionnaire and chromosome detection). Fifth, we detected DNAm in saliva, which is an emerging tissue type for epidemiologic research particularly in children because of the ease of collection. Sixth, we used a quantitative genome-wide array to detect DNAm that has been shown to have high reproducibility [Citation63], and which is commonly used in epigenetic epidemiology [Citation64] to promote replication. Seventh, we performed numerous sensitivity analyses, including surrogate variable analysis, pathway enrichment, and chromatin state enrichment to assess the robustness of the findings and increase the biologic interpretation of the findings. Eighth, to assess replication, we compared our findings to prior publications in cord blood and saliva [Citation13]. Together, the study population, design, and analytic approach are major strengths of this study.
In conclusion, we assessed autosomal sex-specific differential DNAm in children’s saliva at two time points in a large and diverse study population. We observed thousands of positions with differential DNAm, with predominantly higher DNAm in female samples. Our findings were also consistent with prior reports in other tissue types. Epigenetic epidemiology studies should take care to account for sex-specific DNAm patterns, even on autosomal chromosomes. Sex-specific DNAm positions were enriched for pathways of behaviour and ion regulation, which may connect to different responses in these pathways by sex. Many diseases and disorders have prevalence differences by sex, and DNAm may be a marker or mediator linking sex and health.
Acronyms
| FFCWS | = | : Future of Families and Child Wellbeing Study |
| DNAm | = | : DNA methylation |
| EWAS | = | : Epigenome-wide association study |
| eFORGE | = | : experimentally-derived Functional element Overlap analysis of ReGions from EWAS |
Author contributions
Allison Reiner: software, visualization, formal analysis, data curation, writing-original draft
Matthew Zawistowski: conceptualization, methodology, writing-review & editing, supervision, funding acquisition
Kelly M. Bakulski: conceptualization, methodology, supervision, project administration, writing-review & editing, funding acquisition
Erin B. Ware: conceptualization, methodology, supervision, project administration, writing-review & editing, funding acquisition
Jonah D. Fisher: conceptualization, validation, data curationa
Colter Mitchell: validation, project administration, writing-review & editing
John F. Dou: validation, writing-review & editing
Lisa Schneper: investigation, writing-review & editing
Daniel A. Notterman: investigation, project administration, writing-review & editing.
Supplemental Material
Download Zip (124.9 MB)Acknowledgments
We thank the participants and staff of the Future of Families and Child Wellbeing Study. We also wish to thank Brittni Delmaine for her editorial services.
Disclosure statement
No potential conflict of interest was reported by the author(s).
Supplementary material
Supplemental data for this article can be accessed online at https://doi.org/10.1080/15592294.2023.2222244
Data availability statement
The data that support the findings of this study are available on request from the co-authors [DN, CM]. The data are not publicly available due to restrictions; however, data will be released in 2023 per the NIH data guidelines. Survey data for the Future of Families and Child Wellbeing study can be accessed at https://ffcws.princeton.edu/.
Additional information
Funding
References
- Muenchhoff M, Goulder PJ. Sex differences in pediatric infectious diseases. J Infect Dis. 2014;209(3):S120–16. doi:10.1093/infdis/jiu232.
- Kaczkurkin AN, Raznahan A, Satterthwaite TD. Sex differences in the developing brain: insights from multimodal neuroimaging. Neuropsychopharmacology. 2019;44(1):71–85. doi:10.1038/s41386-018-0111-z.
- Xia Y, Dai R, Wang K, et al. Sex-differential DNA methylation and associated regulation networks in human brain implicated in the sex-biased risks of psychiatric disorders. Mol Psychiatry. 2021;26(3):835–848. doi:10.1038/s41380-019-0416-2
- Oliva M, Munoz-Aguirre M, Kim-Hellmuth S, et al. The impact of sex on gene expression across human tissues. Science. 2020;369(6509). doi:10.1126/science.aba3066
- Gershoni M, Pietrokovski S. The landscape of sex-differential transcriptome and its consequent selection in human adults. BMC Biol. 2017;15(1):7. doi:10.1186/s12915-017-0352-z.
- Krumsiek J, Mittelstrass K, Do KT, et al. Gender-specific pathway differences in the human serum metabolome. Metabolomics. 2015;11(6):1815–1833. doi:10.1007/s11306-015-0829-0
- Grant OA, Wang Y, Kumari M, et al. Characterising sex differences of autosomal DNA methylation in whole blood using the Illumina EPIC array. Clin Epigenetics. 2022;14(1):62. doi:10.1186/s13148-022-01279-7
- Moore LD, Le T, Fan G. DNA methylation and its basic function. Neuropsychopharmacology. 2013;38(1):23–38. doi:10.1038/npp.2012.112.
- Gatev E, Inkster AM, Negri GL, et al. Autosomal sex-associated co-methylated regions predict biological sex from DNA methylation. Nucleic Acids Res. 2021;49(16):9097–9116. doi:10.1093/nar/gkab682
- Joseph DB, Strand DW, Vezina CM. DNA methylation in development and disease: an overview for prostate researchers. Am J Clin Exp Urol. 2018;6(6):197–218.
- Maschietto M, Bastos LC, Tahira AC, et al. Sex differences in DNA methylation of the cord blood are related to sex-bias psychiatric diseases. Sci Rep. 2017;7(1):44547. doi:10.1038/srep44547
- Singmann P, Shem-Tov D, Wahl S, et al. Characterization of whole-genome autosomal differences of DNA methylation between men and women. Epigenet Chromatin. 2015;8(1):43. doi:10.1186/s13072-015-0035-3
- Solomon O, Huen K, Yousefi P, et al. Meta-analysis of epigenome-wide association studies in newborns and children show widespread sex differences in blood DNA methylation. Mutat Res Rev Mutat Res. 2022;789:108415. doi:10.1016/j.mrrev.2022.108415
- van Dongen J, Ehli EA, Jansen R, et al. Genome-wide analysis of DNA methylation in buccal cells: a study of monozygotic twins and mQtls. Epigenetics Chromatin. 2018;11(1):54. doi:10.1186/s13072-018-0225-x
- Moore SR, Humphreys K, Colich NL, et al. Distinctions between sex and time in patterns of DNA methylation across puberty. BMC Genomics. 2020;21(1):389. doi:10.1186/s12864-020-06789-3
- Xu H, Wang F, Liu Y, et al. Sex-biased methylome and transcriptome in human prefrontal cortex. Hum Mol Genet. 2014;23(5):1260–1270. doi:10.1093/hmg/ddt516
- Inkster AM, Yuan V, Konwar C, et al. A cross-cohort analysis of autosomal DNA methylation sex differences in the term placenta. Biol Sex Differ. 2021;12(1):38. doi:10.1186/s13293-021-00381-4.
- Martin E, Smeester L, Bommarito PA, et al. Sexual epigenetic dimorphism in the human placenta: implications for susceptibility during the prenatal period. Epigenomics. 2017;9(3):267–278. doi:10.2217/epi-2016-0132
- Mulder RH, Neumann A, Cecil CAM, et al. Epigenome-wide change and variation in DNA methylation in childhood: trajectories from birth to late adolescence. Hum Mol Genet. 2021;30(1):119–134. doi:10.1093/hmg/ddaa280
- Liu J, Morgan M, Hutchison K, et al. A study of the influence of sex on genome wide methylation. PLoS ONE. 2010;5(4):e10028. doi:10.1371/journal.pone.0010028
- Nunes LA, Mussavira S, Bindhu OS. Clinical and diagnostic utility of saliva as a non-invasive diagnostic fluid: a systematic review. Biochem Med (Zagreb). 2015;25(2):177–192. doi:10.11613/BM.2015.018.
- Reichman NE, Teitler JO, Garfinkel I, et al. Fragile families: sample and design. Child Youth Serv Rev. 2001;23(4–5):303–326. doi:10.1016/S0190-7409(01)00141-4.
- Hein TC, Mattson WI, Dotterer HL, et al. Amygdala habituation and uncinate fasciculus connectivity in adolescence: a multi-modal approach. Neuroimage. 2018;183:617–626. doi:10.1016/j.neuroimage.2018.08.058
- Gard AM, Maxwell AM, Shaw DS, et al. Beyond family-level adversities: exploring the developmental timing of neighborhood disadvantage effects on the brain. Dev Sci. 2021;24(1):e12985. doi:10.1111/desc.12985
- Bibikova M, Barnes B, Tsan C, et al. High density DNA methylation array with single CpG site resolution. Genomics. 2011;98(4):288–295. doi:10.1016/j.ygeno.2011.07.007
- Aryee MJ, Jaffe AE, Corrada-Bravo H, et al. Minfi: a flexible and comprehensive Bioconductor package for the analysis of Infinium DNA methylation microarrays. Bioinformatics. 2014;30(10):1363–1369. doi:10.1093/bioinformatics/btu049
- Xu Z, Niu L, Li L, et al. Enmix: a novel background correction method for Illumina HumanMethylation450 BeadChip. Nucleic Acids Res. 2016;44(3):e20. doi:10.1093/nar/gkv907
- Dedeurwaerder S, Defrance M, Bizet M, et al. A comprehensive overview of Infinium HumanMethylation450 data processing. Brief Bioinform. 2014;15(6):929–941. doi:10.1093/bib/bbt054
- Wessely F, Emes RD. Identification of DNA methylation biomarkers from Infinium arrays. Front Genet. 2012;3:161. doi: 10.3389/fgene.2012.00161
- Heiss JA, Just AC. Identifying mislabeled and contaminated DNA methylation microarray data: an extended quality control toolset with examples from GEO. Clin Epigenetics. 2018;10(1):73. doi:10.1186/s13148-018-0504-1.
- Chen YA, Lemire M, Choufani S, et al. Discovery of cross-reactive probes and polymorphic CpGs in the Illumina Infinium HumanMethylation450 microarray. Epigenetics. 2013;8(2):203–209. doi:10.4161/epi.23470
- Hansen KD, IlluminaHumanMethylation450kanno.ilmn12.hg19: Annotation for Illumina's 450k methylation arrays. R package version 0.6.0. 2016.
- Middleton LYM, Dou J, Fisher J, et al. Saliva cell type DNA methylation reference panel for epidemiological studies in children. Epigenetics. 2022;17(2):161–177. doi:10.1080/15592294.2021.1890874
- Teschendorff AE, Breeze CE, Zheng SC, et al. A comparison of reference-based algorithms for correcting cell-type heterogeneity in Epigenome-Wide Association Studies. BMC Bioinf. 2017;18(1):105. doi:10.1186/s12859-017-1511-5
- Sjoberg DD, Whiting K, Curry M, et al. Reproducible Summary Tables with the gtsummary Package. R J. 13(1):570–580. doi:10.32614/RJ-2021-053
- Ritchie ME, Phipson B, Wu D, et al. Limma powers differential expression analyses for RNA-sequencing and microarray studies. Nucleic Acids Res. 2015;43(7):e47. doi:10.1093/nar/gkv007
- Saffari A, Silver MJ, Zavattari P, et al. Estimation of a significance threshold for epigenome-wide association studies. Genet Epidemiol. 2018;42(1):20–33. doi:10.1002/gepi.22086
- Leek JT, Storey JD, Gibson G. Capturing heterogeneity in gene expression studies by surrogate variable analysis. PLoS Genet. 2007;3(9):1724–1735. doi:10.1371/journal.pgen.0030161.
- Peters TJ, Buckley MJ, Statham AL, et al. De Novo identification of differentially methylated regions in the human genome. Epigenet Chromatin. 2015;8(1):6. doi:10.1186/1756-8935-8-6
- Phipson B, Maksimovic J, Oshlack A. missMethyl: an R package for analyzing data from Illumina’s HumanMethylation450 platform. Bioinformatics. 2016;32(2):286–288. doi:10.1093/bioinformatics/btv560.
- Breeze CE, Paul DS, van Dongen J, et al. eFORGE: a Tool for Identifying Cell Type-Specific Signal in Epigenomic Data. Cell Rep. 2016;17(8):2137–2150. doi:10.1016/j.celrep.2016.10.059
- Galanter JM, Gignoux CR, Oh SS, et al. Differential methylation between ethnic sub-groups reflects the effect of genetic ancestry and environmental exposures. Elife. 2017;6:6. doi:10.7554/eLife.20532
- Song MA, Seffernick AE, Archer KJ, et al. Race/ethnicity-associated blood DNA methylation differences between Japanese and European American women: an exploratory study. Clin Epigenetics. 2021;13(1):188. doi:10.1186/s13148-021-01171-w
- Kaito S, Iwama A. Pathogenic Impacts of Dysregulated Polycomb Repressive Complex Function in Hematological Malignancies. Int J Mol Sci. 2020;22(1):74. doi:10.3390/ijms22010074.
- Yousefi P, Huen K, Dave V, et al. Sex differences in DNA methylation assessed by 450 K BeadChip in newborns. BMC Genomics. 2015;16(1):911. doi:10.1186/s12864-015-2034-y
- Safran M, Rosen N, Twik M, et al. The GeneCards Suite. In: Abugessaisa I Kasukawa Teditors. Practical Guide to Life Science Databases. Singapore: Springer Nature Singapore; 2021. pp. 27–56.
- Kroef V, Ruegenberg S, Horn M, et al. GFPT2/GFAT2 and AMDHD2 act in tandem to control the hexosamine pathway. Elife. 2022;11:11. doi:10.7554/eLife.69223
- Buse MG. Hexosamines, insulin resistance, and the complications of diabetes: current status. Am J Physiol Endocrinol Metab. 2006;290(1):E1–E8. doi:10.1152/ajpendo.00329.2005.
- Uhlen M, Fagerberg L, Hallstrom BM, et al. Proteomics. Tissue-based map of the human proteome. Science. 2015;347(6220):1260419. doi:10.1126/science.1260419
- Zhang Y, Xu D, Huang H, et al. Regulation of glucose homeostasis and lipid metabolism by PPP1R3G-mediated hepatic glycogenesis. Mol Endocrinol. 2014;28(1):116–126. doi:10.1210/me.2013-1268
- Hall E, Volkov P, Dayeh T, et al. Sex differences in the genome-wide DNA methylation pattern and impact on gene expression, microRNA levels and insulin secretion in human pancreatic islets. Genome Biol. 2014;15(12):522. doi:10.1186/s13059-014-0522-z
- Rajasekhar VK, Begemann M. Concise review: roles of polycomb group proteins in development and disease: a stem cell perspective. Stem Cells. 2007;25(10):2498–2510. doi:10.1634/stemcells.2006-0608.
- Kouznetsova VL, Tchekanov A, Li X, et al. Polycomb repressive 2 complex-Molecular mechanisms of function. Protein Sci. 2019;28(8):1387–1399. doi:10.1002/pro.3647.
- Abel KM, Drake R, Goldstein JM. Sex differences in schizophrenia. Int Rev Psychiatry. 2010;22(5):417–428. doi:10.3109/09540261.2010.515205.
- Walton E, Hass J, Liu J, et al. Correspondence of DNA methylation between blood and brain tissue and its application to schizophrenia research. Schizophr Bull. 2016;42(2):406–414. doi:10.1093/schbul/sbv074
- Hannon E, Dempster EL, Mansell G, et al. DNA methylation meta-analysis reveals cellular alterations in psychosis and markers of treatment-resistant schizophrenia. Elife. 2021;10:10. doi:10.7554/eLife.58430
- Adanty C, Qian J, Al-Chalabi N, et al. Sex differences in schizophrenia: a longitudinal methylome analysis. J Neural Transm (Vienna). 2022;129(1):105–114. doi:10.1007/s00702-021-02439-4
- Regitz-Zagrosek V. Sex and gender differences in health. Science & Society Series On Sex And Science. EMBO Rep. 2012;13(7):596–603. doi:10.1038/embor.2012.87.
- Li J, Li L, Wang Y, et al. Insights into the Role of DNA methylation in immune cell development and autoimmune disease. Front Cell Dev Biol. 2021;9:757318. doi:10.3389/fcell.2021.757318
- Nathan BM, Palmert MR. Regulation and disorders of pubertal timing. Endocrinol Metab Clin North Am. 2005;34(3):617–641. doi:10.1016/j.ecl.2005.04.015. ix.
- Harper KN, Peters BA, Gamble MV. Batch effects and pathway analysis: two potential perils in cancer studies involving DNA methylation array analysis. Cancer Epidemiol Biomarkers Prev. 2013;22(6):1052–1060. doi:10.1158/1055-9965.EPI-13-0114.
- Sirugo G, Williams SM, Tishkoff SA. The missing diversity in human genetic studies. Cell. 2019;177(1):26–31. doi:10.1016/j.cell.2019.02.048.
- Sandoval J, Heyn H, Moran S, et al. Validation of a DNA methylation microarray for 450,000 CpG sites in the human genome. Epigenetics. 2011;6(6):692–702. doi:10.4161/epi.6.6.16196
- Felix JF, Joubert BR, Baccarelli AA, et al. Cohort profile: pregnancy and childhood epigenetics (PACE) consortium. Int J Epidemiol. 2018;47(1):22–3u. doi:10.1093/ije/dyx190