
ABSTRACT
N6-methyladenosine (m6A) is the most universal post-transcriptional modification of mRNA which may play important roles in verious species. However, the potential roles of m6A in the pigmentation of skin are not completely understood. To explore the role of m6A modification in pigmentation of sheep skin, we used MeRIP-seq and RNA-seq to profile the skin transcriptome in black and white coat color (n=3). Our results showed that an average of 7701 m6A peaks were obtained for all samples and the average length was 305.89 bp. The GGACUU sequence was the most enrichment motif and shared in black skin and white skin. The m6A peaks were mainly enriched in the CDS, 3'UTR and 5'UTR, especially in CDS region near the stop codon of the transcript. 235 significantly differential peaks were found in black skin vs. white skin. The KEGG signaling pathways of downregulated and upregulated m6A peaks were mainly enriched in AGE-RAGE signaling pathway in diabetic complications, Viral carcinogenesis, Transcriptional misregulation in cancer, ABC transporters, Basal transcription factors and Thyroid hormone synthesis (P value <0.05). For RNA-seq, 71 differently expressed genes (DEGs) were scanned in black skin vs. white skin. DEGs were significantly enriched in tyrosine metabolism, melanogenesis, neuroactive ligand-receptor interaction pathway (P value <0.05). Combined m6A-seq and RNA-seq analysis showed that the hyper-up genes and hypo-up genes were both enriched in ErbB signaling pathway (P value <0.05). In conclusion, it provide a basis for further research into the functions of m6A methylation modifications in pigmentation.
Introduction
Coat colour is a direct reflection of pigmentation in fleece-producing animals. In mammals, the main pigments of the skin and hair are melanins, which are synthesized in melanosomes of melanocytes and then secreted into keratinocytes [Citation1]. Multiple genes and signalling pathways involves in melanin synthesis in mammals, such as tyrosinase (encoded by TYR) catalyse the oxidation of tyrosine (or of L-3,4-dihydroxyphenyla-lanine [L-dopa]) to dopaquinone, which is the initial reaction in melanin synthesis [Citation2]. TYRP1 (TYR-related protein 1) and DCT/TYRP2 (dopachrome tautomerase) modulate the eumelanin synthesis [Citation3,Citation4]. Pre-melanosome protein (encoded by PMEL) is the component of the intraluminal fibrous sheets on which eumelanins are deposited in melanosomes [Citation5]. SLC45A2 directly impact the pH of maturing melanosomes [Citation6].
Epigenetics refers to the underlying genetic changes that affect gene expression without altering the original sequence of DNA nucleotides. DNA methylation, histone acetylation and deacetylation, transcription factor, microRNAs (miRNAs), long noncoding RNAs (lncRNAs), circular RNAs (circRNAs) and interactions have been shown to regulates melanogenesis [Citation7]. However, how RNA methylation regulating pigmentation in skin is unclear. N6-methyladenosine (m6A), discovered in messenger RNA (mRNA) in 1974 from rat, is the most universal post-transcriptional modification of mRNA from bacteria, viruses, yeast, fruitflies, plants and mammals [Citation8–12]. The m6A methylation is catalysed by methyltransferases (METTL3, METTL14, METTL16, CAPAM, METTL5, TRMT11, ZCCHC4, WTAP), removed by demethylases (FTO, ALKBH5) and recognized by reader proteins (YTHDF1/2/3,) [Citation13,Citation14]. M6A modifications, regulating the stability, splicing, translation, and degradation of mRNAs, may play important roles in growth, reproduction, nerve development, fat metabolism, immune responses, tumour invasion and other physiological processes [Citation15–17]. Previous study showed that compared with melanocytes, the expression level of METTL3 in melanoma cell lines was higher and play a role in invasion/migration [Citation16]. METTL14 modulates retinal pigment epithelial (RPE) activity [Citation18]. METTL3 attenuates epithelial-mesenchymal transition, proliferative vitreoretinopathy and high-glucose induced pyroptosis of retinal pigment epithelial cells [Citation19,Citation20]. However, the role of m6A modifications in pigmentation has not known.
To explore the role of m6A modification in pigmentation of sheep skin, we performed N6-methyladenosine sequencing (m6A-seq) and RNA sequencing (RNA-seq) to investigate differentially methylated genes (DMGs) and differentially expressed genes (DEGs) in black and white skin of sheep. Our results provide a theoretical basis for further research into the molecular mechanisms of m6A modification in pigmentation.
Materials and methods
All related experiments involving sheep were conducted in strict compliance with relevant guidelines set by the Ethics Committee of Tongren University, China (Approval ID: TREDU2022–016).
Animals and sample collection
Small Tailed Han Sheep used in this study were raised under the same conditions at Taigu Haihong Animal Husbandry Co. LTD. (Taigu, China). Three one-year-old sheep similar in size with black-and-white coat colour were selected. The black hair and adjacent white hair were cut off, and the black skin and adjacent white skin were taken using skin biopsy borer with a diameter of 1 cm. Four skin pieces of each colour were taken from each sheep. All samples were put into 1.5 mL centrifuge tubes, labelled and stored in liquid nitrogen for RNA extraction.
RNA isolation and fragmentation
Total RNA from 6 samples (1 black and 1 white skin tissue each sheep) was extracted using TRlzol™ Reagent (Thermo Fisher Scientifi, MA, USA) according to the manufacturer’s instructions and genomic DNA was removed with DNase I (Roche Diagnostics, IN, USA). A260/A280 > 1.9, A260/A230 > 1.7 was used to evaluate RNA purity using a NanoDrop ND-1000 instrument (NanoDrop, DE, USA). The concentration of total RNA was measured by Qubit RNA HS Assay Kit (Thermo Fisher Scientific, MA, USA). The purified mRNA (25 μg) was randomly broken into ~150 nt fragments using RNA Fragmentation Buffer (100 mM TrisHCl, 100 mM ZnCl2) at 70°C for 6 min. 98% of the fragmented mRNA was used for immunoprecipitation (IP), and the rest (2%) for IP control (Input).
RNA immunoprecipitation
m6A MeRIP is based on the previously described m6A-seq protocol [Citation21] with several modifications: 30 μL of protein A magnetic beads (Thermo Fisher Scientific, MA, USA) were washed twice by IP buffer (150 mM NaCl, 10 mM Tris-HCl [pH 7.5], 0.1% IGEPAL CA-630), resuspended in 500 μL of IP buffer, and tumbled with 5 μg anti-m6A antibody (Synaptic Systems, Gottingen, Germany) at 4°C for 6 h. It was then incubated in 500 μL IP buffer with 5 μL of RNasin Plus RNase Inhibitor (40 U/μL, Promega, WI, USA) at 4°C for 2 h. After extensive washing, the m6A-enriched fragmented RNA was eluted by 200 μL of RLT buffer supplied in RNeasy Mini Kit (QIAGEN, Dusseldorf, Germany) for 2 min at room temperature. Thereafter, supernatant was collected and 400 μL of 100% ethanol was added, then m6A-enriched RNA was purified using an RNeasy MiniElute spin column (QIAGEN, Dusseldorf, Germany). Finally, The m6A-enriched RNA was eluted with 14 μL ultrapure H2O.
M6A library preparation and sequencing
The amount of 2 μL eluted RNA and input RNA was reverse transcribed with High-Capacity cDNA Reverse Transcription Kit (Thermo Fisher Scientific, MA, USA). Transcriptome-wide interrogation was pursued by deep sequencing using SMARTer Stranded Total RNA-Seq Kit version 2 (Pico Input Mammalian, Takara/Clontech, Osaka, Japan) on Illumina Novaseq 6000 platform. 150 bp paired-end reads were generated.
RNA-seq
A total amount of 1 µg RNA per sample was used as input material for the RNA sample preparations. Sequencing libraries were generated using NEBNext® UltraTM RNA Library Prep Kit for Illumina® (NEB, USA) following manufacturer’s recommendations and index codes were added to attribute sequences to each sample.
Bioinformatic analysis of m6A-seq
Trimmomatic software (v0.32) were used to remove adapter and low quality reads [Citation22]. Quality distribution plot and base content distribution were generated by FastQC (http://www.bioinformatics.babraham.ac.uk/projects/fastqc/). The software STAR was used to align reads to the sheep reference genome (Oar_v4.0, https://www.ncbi.nlm.nih.gov/assembly/GCF_000298735.2/). Uniquely mapped reads were used for subsequent analysis. The R software package MetPeak (Cutoff threshold: PEAK_CUTOFF_P value = 0.05, FOLD_ENRICHMENT = 1) was used to call peak and IGV software (http://www.igv.org) were used to visualize. The R software package Guitar was used to calculate the densty plot of peaks in 3‘UTR, CDS and 5‘UTR. ChIPseeker (https://bioconductor.org/packages/ChIPseeker) and HOMER (http://homer.ucsd.edu/homer/motif) softwares were used to annotate the peaks and perform motif analysis, respectively. The MeTDiff software was used to analyse the difference the MeRIP-seq data between black and white skin (P value < 0.05 and Log2FC >1 as upregulated peak, P value < 0.05 and Log2FC <-1 as downregulated peak). Gene Ontology (GO) and Kyoto Encyclopedia of Genes and Genomes (KEGG) analyses of m6A modified genes (The 3‘UTR of differentially methylated mRNA was modified by m6A) were performed by the DAVID database (http://david.abcc.ncifcrf.gov/) and the KEGG database (https://www.kegg.jp/), respectively.
Bioinformatic analysis of RNA-seq
Raw data (raw reads) of fastq format were firstly processed through in-house perl scripts to obtain clean data (clean reads), which were used for further analysis. STAR was used to align clean reads to reference genome. HTSeq v0.6.0 was used to count the reads numbers mapped to each gene. And then FPKM (expected number of Fragments Per Kilobase of transcript sequence per Millions base pairs) was calculated based on the length and reads count of genes. The differentially expressed genes (DEGs) were filtered by DESeq2 algorithm with the criteria of |log2FC| > 1 and P value < 0.05. Gene Ontology (GO) and Kyoto Encyclopedia of Genes and Genomes (KEGG) analyses of differentially expressed genes were performed by the DAVID database (http://david.abcc.ncifcrf.gov/) and the KEGG database (https://www.kegg.jp/), respectively. Fisher’s exact test was applied to identify the significant GO categories, significant pathway and FDR was used to correct the P values.
Real-Time quantitative PCR (RT-Qpcr)) and m6A IP (MeRIP) followed RT-Qpcr (MeRIP-Qpcr)
IP RNA and Input RNA (1 μg) from each sample were synthesized cDNA by PrimeScript™ RT Master Mix (Perfect Real Time) (TAKARA, Dalian, China). Thereafter, a TB Green® Fast qPCR Mix (TAKARA, Dalian, China) and a LightCycler 480II (Roche, Basel, Switzerland) were used to perform RT-qPCR and MeRIP-qPCR. The primers are presented in , β-actin served as internal control. The relative expression of genes were determined by the 2 – ΔΔCt.
Table 1. Primer sequences for RT-Qpcr and MeRIP-Qpcr..
Results
MeRIP-seq summary
To explore the role of m6A modification in pigmentation of sheep skin, the black and white skins of three sheep were collected for m6A sequencing. The IP libraries (MeRIP-seq) and the input libraries (RNA-seq) of black skin and white skin were constructed. As a result, a total of 56,239,292–58,047,254 and 61,572,416–65,348,920 raw reads in the IP libraries and in the input libraries were obtained for black skin, respectively. Meanwhile, a total of 53,302,052–59,653,724 and 55,037,238–64,703,960 raw reads in the IP libraries and in the input libraries were obtained for white skin, respectively. An average of more than 50,143,426 clean reads per sample were obtained. The Q20 and Q30 values were at least 97.15% and 91.74% for all sample, respectively (). In addition, more than 50% clean reads were aligned to the sheep reference genome. At least 18,019,944 clean reads were uniquely mapped and the percent of uniquely mapped reads >70% for all samples (Supplementary Table S1).
Table 2. Sequence statistics and quality control.
General features of sheep m6A methylation
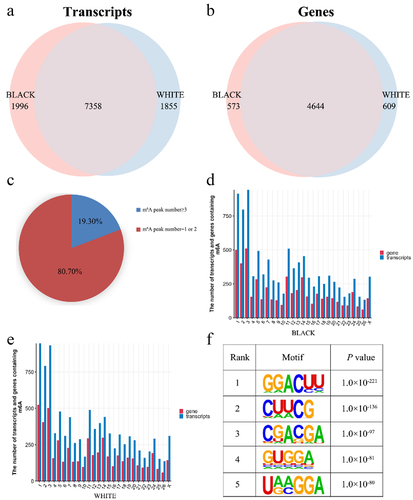
An average of 7701 peaks were obtained for all samples and the average length was 305.89 bp (Supplementary Table S2, S3). After merging the three replicates, 9354 m6A modified peaks and 5217 genes were found in black skin. Meanwhile, 9213 m6A modified peaks and 5253 genes were detected in white skin (). The count of m6A peaks in one modified gene was in the range of 1 to 30, and the average was 1.2 to 1.32 m6A peaks in six samples. Meanwhile, 80.70% of the modified genes had only one or two m6A peaks, the remaining genes (19.30%) contained three or more peaks in sheep skin (). Furthermore, we analysed the distributions of peaks on the sheep chromosomes in skin. Interestingly, there were more peaks on chromosomes 1, 2, 3, 5, 11, and 14 than on other chromosomes, and the most peaks were distributed on chromosome 1 in black skin and chromosome 3 in white skin (). To identify RRACH (R, purine; A, m6A; H, non-guanine base) motif of sheep skin, HOMER software was used. The results showed that more than 15 motifs are identified in each sample and the five motifs with the smallest P value from each group were used for subsequent analysis (). The GGACUU sequence was shared in black and white skin, which inversely complemented two miRNA (hsa-miR-302e and hsa-miR-2114) seed sequences.
Figure 1. Peak Distribution. (a) m6A peaks distributions in black and white skin of sheep among mRNA transcripts. (b) m6A peaks distributions in black and white skin of sheep among genes. (c) Distributions of differential m6A peaks in per gene. (d) Numbers of m6A peaks in the mRNA transcripts of chromosomes in black skin of sheep. (e) Numbers of m6A peaks in the mRNA transcripts of chromosomes in white skin of sheep. (f) the top five motif sequences for m6A-containing peaks from all samples.
Topological pattern of sheep m6A methylation
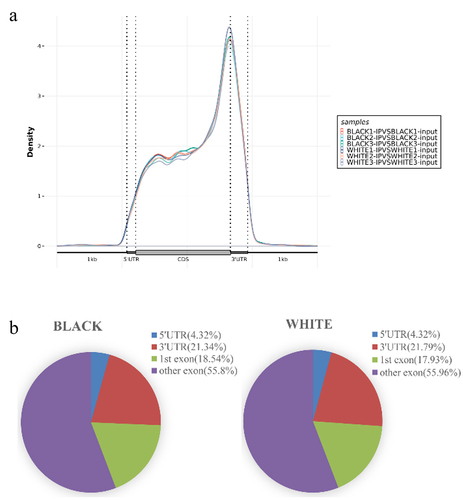
The distributions of peaks in gene functional elements were analysed. As a result, the m6A peaks in black skin and white skin were mainly enriched in the CDS, 3‘UTR and 5‘UTR, especially in CDS region near the stop codon of the transcript (). To further evaluate the distribution of m6A modified peak, the transcript was divided into the 5‘UTR, 3‘UTR, 1st exon and other exon. As a result, the highest enrichment of m6A modified peaks was in other exon, followed by 3‘UTR, 1st exon and 5‘UTR ().
Figure 2. Peak Distribution. (a) Density distributions of m6A peaks in different gene functional elements (5'UTR, CDS, and 3'UTR) in each sample. (b) Distributions of m6A peaks in different gene functional elements (5'UTR, 3'UTR, 1 st exon, and other exons) in black skin and white skin.
Differential m6A peaks between black and white skin
MeTDiff software was used to analyse differential m6A peaks between black skin and white skin based on P value < 0.05 and | Log2FC |>1. The result showed that 235 differential peaks and 226 genes (differentially methylated genes, DMGs) were scanned, of which 134 significantly upregulated peaks in 127 genes and 101 significantly downregulated peaks in 99 genes were found in black skin vs. white skin ( and Supplementary Table S4). The top 10 upregulated genes and downregulated genes are present ().
Figure 3. m6A peaks in black skin and white skin of sheep. (a) Significantly different m6A peaks in black skin vs. white skin. (b) Significant differences in the distributions of m6A peaks on sheep chromosomes.
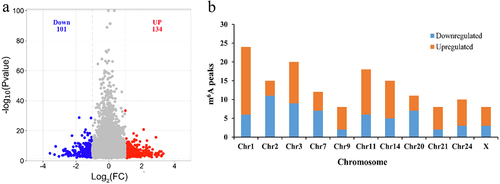
Table 3. Top 10 significantly upregulated and downregulated m6A peaks (BLACK vs. WHITE).
The distribution of differential m6A peaks on chromosomes showed that the downregulated peaks were most enriched on chromosome 2 (11 differential peaks), while the upregulated peaks were most enriched on chromosome 1 (18 differential peaks). The number of the downregulated peaks and upregulated peaks on chromosome 1 were 6 and 18 was most different (). The distribution of differential peaks in genes was counted. Only two genes (CSPG4, MAML3) contained two downregulated peaks, but five genes (ADAMTS1, COL6A2, GAB2, MAP1B, TNRC18) contained two upregulated peaks. Even PLEC gene owned 3 upregulated peaks. The remaining genes (97.98% downregulated genes and 95.28% upregulated genes) all have a single differential peak (Supplementary Table S4).
GO and KEGG analysis of genes presenting differential m6A Peaks
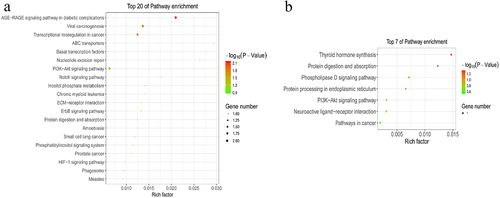
To explore the role of m6A modification in sheep skin and its relationship with pigmentation, the functions of m6A modified genes were analysed using the DAVID database and the KEGG database. According to GO terms, the functions were divided into three categories: the biological process (BP), cellular component (CC), and molecular function (MF) categories. Downregulated m6A peaks were significantly enriched in 97 BP, 18 CC and 21 MF GO terms, and Upregulated m6A peaks were significantly enriched in 21 BP, 7 CC and 8 MF GO terms, the top 15 of three categories were showed in . GO terms related to pigmentation involve in regulation of synaptic transmission, dopaminergic, melanosome assembly, regulation of dopamine metabolic process, melanosome organization, negative regulation of kinase activity and melanosome membrane. The KEGG signalling pathways of downregulated m6A peaks were mainly enriched in AGE-RAGE signalling pathway in diabetic complications, Viral carcinogenesis, Transcriptional misregulation in cancer, ABC transporters, Basal transcription factors (P value < 0.05). Meanwhile, the KEGG signalling pathways of upregulated m6A peaks were mainly enriched in Thyroid hormone synthesis (P value < 0.05) ().
Figure 4. GO analyses of m6A modified genes. Top 15 GO terms of the differentially methylated downregulated genes and upregulated genes in three categories (BP, MF, CC). The red column indicates significant enrichment, while the blue column indicates insignificant enrichment.
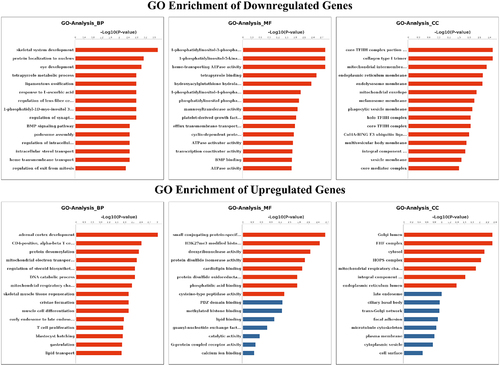
Figure 5. KEGG analyses of m6A modified genes. The enriched KEGG pathways of the differentially methylated downregulated genes (a) and upregulated genes (b).
Differently expressed genes (RNA-seq) in black and white skin
The RNA-seq data for each sample were used to analyse differently expressed genes between black skin and white skin. A total of 71 DEGs were scanned, among which 27 DEGs were downregulated and 44 DEGs were upregulated in black skin vs. white skin (, Supplementary Table S5). The top 10 upregulated genes and downregulated genes are listed in . The functions of these DEGs were analysed and the GO enrichment and KEGG pathway were evaluated. As a result, the top 15 GO terms of biological process (BP), cellular component (CC) and molecular function (MF) were exhibited in . The DEGs were significantly enriched in melanin biosynthetic process, response to blue light, transmembrane transport, melanosome organization, positive regulation of protein kinase A signalling, developmental pigmentation, melanosome and L-dopa decarboxylase activity, which were closely related to pigmentation of skin. KEGG analysis showed that DEGs were significantly enriched in Tyrosine metabolism (4 DEGs), Melanogenesis (4 DEGs), Neuroactive ligand–receptor interaction (6 DEGs), Neuroactive ligand–receptor interaction Olfactory transduction (2 DEGs), Cocaine addiction (2 DEGs), Amphetamine addiction (2 DEGs), PPAR signalling pathway (2 DEGs), Salivary secretion (2 DEGs), Transcriptional misregulation in cancer (3 DEGs) (P value < 0.05). Top 20 enriched KEGG pathways are listed ().
Figure 6. GO and KEGG analyses of DEGs. (a) Volcano plot showing the differential gene expression in black skin vs. white skin of sheep. (b) Top 20 KEGG pathways enriched for DEGs. (c) Top 15 GO terms of DEGs in three categories (BP, MF, CC). The red column indicates significant enrichment, while the blue column indicates insignificant enrichment.
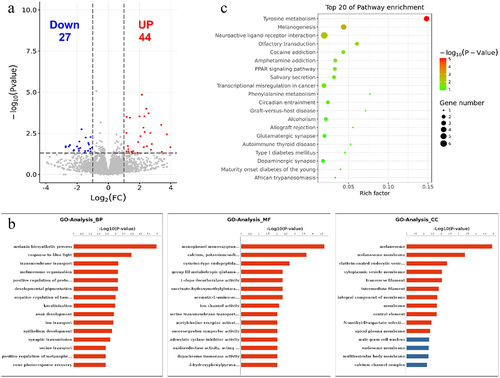
Table 4. Top 10 significantly upregulated and downregulated genes (BLACK vs. WHITE).
Combined m6A-seq and RNA-seq analysis
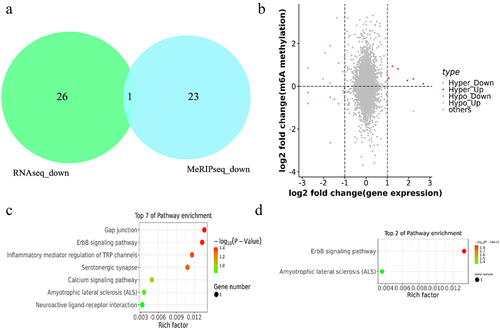
To further determine the effect of m6A modification on pigmentation in sheep skin, the relationship of m6A modified genes and DEGs were analysed according to m6A-seq data and RNA-seq data. As a result, BIIIB4 was the unique overlap gene which was downregulated in both m6A methylation and mRNA expression level in black skin vs white skin in one of the three sheep (). In addition, With |log2FC|>0 as the dividing line of m6A methylation and |log2FC|>1 as the threshold of mRNA differential expression, a total of 27 genes were divided into four groups: 9 hypermethylated and downregulated genes (hyper-down genes), 6 hypermethylated and upregulated genes (hyper-up genes), 11 hypomethylated and downregulated genes (hypo-down genes), 1 hypomethylated and upregulated genes (hypo-up genes) ( and Supplementary Table S6). All genes were used for function analysis using KEGG database, which revealed that the hyper-up genes were mainly enriched in Gap junction, ErbB signalling pathway, Inflammatory mediator regulation of TRP channels and Serotonergic synapse (P value < 0.05) (). In addition, the hypo-up genes were mainly related to ErbB signalling pathway and Amyotrophic lateral sclerosis (ALS) (P value < 0.05) (). However, the hyper-down genes and hypo-down genes were not significantly enriched in any pathway (P value > 0.05)
Figure 7. Combined m6A-seq and RNA-seq analysis. (a) the overlap gene between downregulated m6A methylation and downregulated mRNA in black skin vs. white skin (b) Four-quadrant diagram depicting the distributions of m6A modified genes and DEGs. (c-d) the enriched KEGG pathways among the identified (c) hyper-up genes and (d) hypo-up genes.
Validation of DEGs and DMGs by qPCR and MeRIP-Qpcr
To verify the MeRIP-Seq and RNA-seq sequencing data, we selected six DMGs (CSPG4, MAML2, DENND2B, ADAMTS1, MAP1B, GAB2) and six DEGs (TYRP1, SLC45A2, TYR, TCL1A, ZAR1, MCP-3) randomly and detected their expressions by MeRIP-qPCR and RT-qPCR. The result showed that the expression trends of these genes were consistent with the RNA-seq and m6A-seq (), which confirmed the accuracy of m6A-seq and RNA-seq experiment.
Figure 8. Verification of DEGs and DMGs. (a) the m6A methylation modifications of six genes verified by MeRIP-Qpcr.. (b) the expression levels of six genes verified by qPCR.
Discussion
Coat colour is an important trait in sheep. Coat colour is determined by the content and composition of melanin. Melanin produced in melanocytes can be divided into two types, eumelanin, which appears black to brown and pheomelanin which appears yellow to reddish brown. The genetic basis and many genes controlling coat colour of sheep has been found, such as melanocortin-1 receptor (MC1R), agouti signalling protein (ASIP), TYR, TYRP1 and microphthalmia transcription factor (MITF) [Citation23].
M6A modifications, regulating the stability, splicing, translation, and degradation of mRNAs, may play important roles in growth, reproduction, nerve development, fat metabolism, immune responses, tumour invasion and other physiological processes [Citation15,Citation16]. However, the function of m6A modifications on pigmentation is unclear. In this study, the m6A modifications of black skin and white skin of sheep were detected, 7358 peaks that were in common in the black skin and white skin, which accounted for 79.9% of all the peaks. This means that most m6A modifications are designed to maintain cellular metabolism. The average number of m6A peaks per gene was 1.2 to 1.32 in six samples, which is similar to that in pig liver (1.33–1.42) and mouse liver (1.34) [Citation24,Citation25]. The consensus sequences ‘RRACH’ were conserved in various species [Citation26], which was also verified in sheep. The GGACUU sequence was the most enriched m6A motif in all samples. The distributions of peaks in gene functional elements were analysed. As a result, the m6A peaks in black skin and white skin of sheep were mainly enriched in the CDS, 3‘UTR and 5‘UTR, especially in CDS region near the stop codon of the transcript. The result agrees with that in human, mouse, pig and sheep liver tissue [Citation14,Citation15,Citation25]. The stability, localization, expression, and translation of mRNA were regulated by 3'UTR where multiple RNA-binding proteins bind to plays a regulatory role and protein interaction [Citation27].
Differential m6A peaks between black skin and white skin were analysed. The result showed that 235 differential peaks and 226 genes were scanned, of which 134 significantly upregulated peaks in 127 genes and 101 significantly downregulated peaks in 99 genes were found in black skin vs. white skin. Eight DMGs contains two or more peaks. Chondroitin sulphate proteoglycan 4 (CSPG4) is essential to the survival and growth of melanoma tumours by enhancing growth factor receptor-regulated pathways, such as sustained activation of ERK 1,2, and modulating integrin function [Citation28]. ERK pathway was the key intracellular signalling pathway, which was involved in melanogenesis by the activation of signal transduction [Citation29]. ADAMTS1(A Disintegrin-like And Metalloprotease domain with ThromboSpondin type I motifs) is upregulated in black skin compared with white skin is in accord with previous study. ADAMTS genes (ADAMTS1, ADAMTS6 and ADAMTS9) may associate with age-related macular degeneration and MAP1B was higher expression in the macula of human eye [Citation30,Citation31]. GAB2 amplification is critical for melanomas arising from sun-protected sites and in mast cell development GAB2 is required for KitL/c-Kit signalling which is an important signal in melanogenesis [Citation32–34]. Mastermind-like 3 (MAML3) are potential therapeutic targets for small cell lung cancer and pancreatic cancer [Citation35]. Collagen VI (COL6A1, COL6A2 and COL6A3) mutations result in disorders abnormal skin findings [Citation36]. But there is no evidence that MAML3, COL6A2, TNRC18, PLEC are related to pigmentation. This study provides a new direction for these genes. Transcriptome of each sample were detected and a total of 71 DEGs were scanned, among which 27 DEGs were downregulated and 44 DEGs were upregulated in black skin vs. white skin. Upregulated genes TYR, TSPAN10, TRPM1, MLANA, KCNJ13, TYRP1, DCT, SLC45A2, SLC24A5, MC1R and PMEL have been proven to participate in pigmentation [Citation37–42].
DEGs (RNA-seq) in black skin vs. white skin were enriched GO terms of melanin biosynthetic process, response to blue light, transmembrane transport, melanosome organization, positive regulation of protein kinase A signalling, developmental pigmentation, melanosome and L-dopa decarboxylase activity. KEGG analysis showed that DEGs were significantly enriched in tyrosine metabolism (4 DEGs), melanogenesis (4 DEGs), neuroactive ligand–receptor interaction (6 DEGs). The result is similar to the previous study [Citation41,Citation42]. Meanwhile, GO terms of m6A modified genes also involved in pigmentation, such as regulation of synaptic transmission, dopaminergic, melanosome assembly, regulation of dopamine metabolic process, melanosome organization, negative regulation of kinase activity and melanosome membrane, which is similar to GO enrichment of DEGs. Combined analysis of m6A-seq and RNA-seq showed that both the hyper-up genes and hypo-up genes enriched in ErbB signalling pathway which are required to promote normal pigment cell and pigment pattern development in vivo [Citation43].
Conclusion
In this study, we detected how m6A methylation is modified in black skin and white skin of sheep, and m6A modification may play an important role in pigmentation of skin in sheep by participating in AGE-RAGE signalling pathway, ABC transporters, Basal transcription factors and Thyroid hormone synthesis. It provides a basis for further research into the functions of m6A methylation modifications in pigmentation.
Author contributions
Yuanyuan Zhao analysed the data and draft the manuscript. Xingchao Song and Qingming An prepared the tissue samples for sequencing. Jinzhu Meng initiated this study, designed the experiments, and finalized the manuscript. All authors read and approved the final manuscript.
Ethics approval
This study and all the experimental procedures were approved by the Ethics Committee of Tongren University, China (Approval ID: TREDU2022–016). This study does not contain any studies with human subjects or with rodent vertebrates and informed consent is not applicable.
Supplemental Material
Download Zip (3.8 MB)Acknowledgments
We thank Pengchao Wang and Jinjia Liu for caring of the sheep at Taigu Haihong Animal Husbandry Co. LTD.
Disclosure statement
No potential conflict of interest was reported by the author(s).
Data availability statement
All datasets used in this study are available from the corresponding author on reasonable request.
Supplementary material
Supplemental data for this article can be accessed online at https://doi.org/10.1080/15592294.2023.2230662
Additional information
Funding
References
- Le L, Sires-Campos J, Raposo G, et al. Melanosome biogenesis in the pigmentation of mammalian skin. Integr Comp Biol. 2021;61(4):1517–15. doi: 10.1093/icb/icab078
- Ramsden CA, Riley PAJB. Chemistry m. Tyrosinase: the four oxidation states of the active site and their relevance to enzymatic activation, oxidation and inactivation. Bioorg Med Chem. 2014;22(8):2388–2395. doi: 10.1016/j.bmc.2014.02.048
- Boissy RE, Zhao H, Oetting WS, et al. Mutation in and lack of expression of tyrosinase-related protein-1 (TRP-1) in melanocytes from an individual with brown oculocutaneous albinism: a new subtype of albinism classified as “OCA3”. Am J Hum Genet. 1996;58(6):1145–1156.
- Pennamen P, Tingaud-Sequeira A, Gazova I, et al. Dopachrome tautomerase variants in patients with oculocutaneous albinism. Genet Med. 2021;23(3):479–487. doi: 10.1038/s41436-020-00997-8
- Watt B, van Niel G, Raposo G, et al. PMEL: a pigment cell‐specific model for functional amyloid formation. Pigment Cell Melanoma Res. 2013;26(3):300–315. doi: 10.1111/pcmr.12067
- Le L, Escobar IE, Ho T, et al. SLC45A2 protein stability and regulation of melanosome pH determine melanocyte pigmentation. Mol Biol Cell. 2020;31(24):2687–2702. doi: 10.1091/mbc.E20-03-0200
- Zhou S, Zeng H, Huang J, et al. Epigenetic regulation of melanogenesis. Ageing Res Rev. 2021;69:101349. doi: 10.1016/j.arr.2021.101349
- Desrosiers R, Friderici K, Rottman FJPot N. Identification of methylated nucleosides in messenger RNA from Novikoff hepatoma cells. Proc Natl Acad Sci USA. 1974;71(10):3971–3975. doi: 10.1073/pnas.71.10.3971
- Deng X, Chen K, Luo G-Z, et al. Widespread occurrence of N 6-methyladenosine in bacterial mRNA. Nucleic Acids Res. 2015;43(13):6557–6567. doi: 10.1093/nar/gkv596
- Lence T, Soller M, Roignant J-Y. A fly view on the roles and mechanisms of the m6A mRNA modification and its players. RNA Biol. 2017;14:1232–1240. doi: 10.1080/15476286.2017.1307484
- Zhao BS, Roundtree IA, CJNrMcb H. Post-transcriptional gene regulation by mRNA modifications. Nat Rev Mol Cell Biol. 2017;18(1):31–42. doi: 10.1038/nrm.2016.132
- Yue H, Nie X, Yan Z, et al. N6‐methyladenosine regulatory machinery in plants: composition, function and evolution. Plant Biotechnol J. 2019;17(7):1194–1208. doi: 10.1111/pbi.13149
- Oerum S, Meynier V, Catala M, et al. A comprehensive review of m6A/m6Am RNA methyltransferase structures. Nucleic Acids Res. 2021;49(13):7239–7255. doi: 10.1093/nar/gkab378
- Zhang J, Yang Q, Yang J, et al. Comprehensive analysis of transcriptome-wide m(6)A methylome upon clostridium perfringens beta2 toxin exposure in porcine intestinal epithelial cells by m(6)A sequencing. Front Genet. 2021;12:689748. doi: 10.3389/fgene.2021.689748
- Lu Z, Liu J, Yuan C, et al. M(6)a mRNA methylation analysis provides novel insights into heat stress responses in the liver tissue of sheep. Genomics. 2021;113(1):484–492. doi: 10.1016/j.ygeno.2020.09.038
- Dahal U, Le K, Gupta M. RNA m6A methyltransferase METTL3 regulates invasiveness of melanoma cells by matrix metallopeptidase 2. Melanoma Res. 2019;29(4):382–389. doi: 10.1097/CMR.0000000000000580
- Wang ZY, Li P, Hu J, et al. Construction of a single-molecule biosensor for antibody-free detection of locus-specific N 6-methyladenosine in cancer cells and tissues. Anal Chem. 2023;95(12):5454–5462. doi: 10.1021/acs.analchem.3c00730
- Yin L, Ma C, Hou S, et al. Methyltransferase-like (METTL)14-mediated N6-methyladenosine modification modulates retinal pigment epithelial (RPE) activity by regulating the methylation of microtubule-associated protein (MAP)2. Bioengineered. 2022;13(3):4773–4785. doi: 10.1080/21655979.2022.2032968
- Ma X, Long C, Wang F, et al. METTL3 attenuates proliferative vitreoretinopathy and epithelial-mesenchymal transition of retinal pigment epithelial cells via wnt/β-catenin pathway. J Cell Mol Med. 2021;25(9):4220–4234. doi: 10.1111/jcmm.16476
- Zha X, Xi X, Fan X, et al. Overexpression of METTL3 attenuates high-glucose induced RPE cell pyroptosis by regulating miR-25-3p/PTEN/Akt signaling cascade through DGCR8. Aging. 2020;12(9):8137. doi: 10.18632/aging.103130
- Zeng Y, Wang S, Gao S, et al. Refined RIP-seq protocol for epitranscriptome analysis with low input materials. PLoS Biol. 2018;16(9):e2006092. doi: 10.1371/journal.pbio.2006092
- Bolger AM, Lohse M, Usadel BJB. Trimmomatic: a flexible trimmer for Illumina sequence data. Bioinformatics. 2014;30(15):2114–2120. doi: 10.1093/bioinformatics/btu170
- Yang S, Fan R, Shi Z, et al. Identification of a novel microRNA important for melanogenesis in alpaca (Vicugna pacos). J Anim Sci. 2015;93(4):1622–1631. doi: 10.2527/jas.2014-8404
- He S, Wang H, Liu R, et al. mRNA N6-methyladenosine methylation of postnatal liver development in pig. PLoS One. 2017;12(3):e0173421. doi: 10.1371/journal.pone.0173421
- Dominissini D, Moshitch-Moshkovitz S, Schwartz S, et al. Topology of the human and mouse m6A RNA methylomes revealed by m6A-seq. Nature. 2012;485(7397):201–206. doi: 10.1038/nature11112
- Qin Z, Wang W, Ali MA, et al. Transcriptome-wide m(6)A profiling reveals mRNA post-transcriptional modification of boar sperm during cryopreservation. BMC Genomics. 2021;22(1):588. doi: 10.1186/s12864-021-07904-8
- Meyer KD, Saletore Y, Zumbo P, et al. Comprehensive analysis of mRNA methylation reveals enrichment in 3'UTRs and near stop codons. Cell. 2012;149(7):1635–1646. doi: 10.1016/j.cell.2012.05.003
- Price MA, Colvin Wanshura LE, Yang J, et al. CSPG4, a potential therapeutic target, facilitates malignant progression of melanoma. Pigment Cell Melanoma Res. 2011;24(6):1148–1157. doi: 10.1111/j.1755-148X.2011.00929.x
- Zhao-Qi ZHOU, Khan A, Qiong JIA, et al. TMEM106B induces melanogenesis by regulating ERK/CREB signaling pathway. Chinese J Biochem Mol Biol. 2021;37(10):1386–1393.
- Bevitt DJ, Mohamed J, Catterall JB, et al. Expression of ADAMTS metalloproteinases in the retinal pigment epithelium derived cell line ARPE-19: transcriptional regulation by TNFα. Biochim Biophys Acta. 2003;1626(1–3):83–91. doi: 10.1016/S0167-4781(03)00047-2
- Kociok N, Joussen A, Ophthalmology E. Varied expression of functionally important genes of RPE and choroid in the macula and in the periphery of normal human eyes. Graefe’s Arch Clin Exp Ophthalmol. 2007;245(1):101–113. doi: 10.1007/s00417-006-0266-x
- Chernoff KA, Bordone L, Horst B, et al. GAB2 amplifications refine molecular classification of melanoma. Clin Cancer Res. 2009;15(13):4288–4291. doi: 10.1158/1078-0432.CCR-09-0280
- Nishida K, Wang L, Morii E, et al. Requirement of Gab2 for mast cell development and KitL/c-Kit signaling. Blood. 2002;99(5):1866–1869. doi: 10.1182/blood.V99.5.1866
- D’Mello SA, Finlay GJ, Baguley BC, et al. Signaling pathways in melanogenesis. Int J Mol Sci. 2016;17:1144. doi: 10.3390/ijms17071144
- Onishi H, Ichimiya S, Yanai K, et al. RBPJ and MAML3: potential therapeutic targets for small cell lung cancer. Anticancer Res. 2018;38(8):4543–4547. doi: 10.21873/anticanres.12758
- Bushby K, Collins J, Hicks DH. Collagen type VI myopathies. Adv Exp Med Biol. 2014;12:185–199.
- Lu Y, Bowswell M, Bowswell W, et al. Molecular genetic response of Xiphophorus maculatus–X. couchianus interspecies hybrid skin to UVB exposure. Comp Biochem Physiol C Toxicol Pharmacol. 2015;178:86–92. doi: 10.1016/j.cbpc.2015.07.011
- Jia Q, Hu S, Jiao D, et al. Synaptotagmin-4 promotes dendrite extension and melanogenesis in alpaca melanocytes by regulating Ca 2+ influx via TRPM1 channels. Cell Biochem Funct. 2020;38(3):275–282. doi: 10.1002/cbf.3465
- Villarreal-Reyna G, Garza-Morales R, Soto-Domínguez A, et al. Cerebrolysin induces hair repigmentation associated to MART-1/Melan-A reactivation. Eur J Med Res. 2022;27(1):1–8. doi: 10.1186/s40001-022-00889-4
- Abolins‐Abols M, Kornobis E, Ribeca P, et al. Differential gene regulation underlies variation in melanic plumage coloration in the dark-eyed junco (Junco hyemalis). Mol Ecol. 2018;27(22):4501–4515. doi: 10.1111/mec.14878
- Fan R, Xie J, Bai J, et al. Skin transcriptome profiles associated with coat color in sheep. BMC Genomics. 2013;14(1):1–12. doi: 10.1186/1471-2164-14-389
- Shi X, Wu J, Lang X, et al. Comparative transcriptome and histological analyses provide insights into the skin pigmentation in Minxian black fur sheep (Ovis aries). PeerJ. 2021;9:e11122. doi: 10.7717/peerj.11122
- Budi EH, Patterson LB, Parichy DM. Embryonic requirements for ErbB signaling in neural crest development and adult pigment pattern formation. Development. 2008;135(15):2603–2614. doi: 10.1242/dev.019299