
 ?Mathematical formulae have been encoded as MathML and are displayed in this HTML version using MathJax in order to improve their display. Uncheck the box to turn MathJax off. This feature requires Javascript. Click on a formula to zoom.
ABSTRACT
Epimutations are rare alterations of the normal DNA methylation pattern at specific loci, which can lead to rare diseases. Methylation microarrays enable genome-wide epimutation detection, but technical limitations prevent their use in clinical settings: methods applied to rare diseases’ data cannot be easily incorporated to standard analyses pipelines, while epimutation methods implemented in R packages (ramr) have not been validated for rare diseases. We have developed epimutacions, a Bioconductor package (https://bioconductor.org/packages/release/bioc/html/epimutacions.html). epimutacions implements two previously reported methods and four new statistical approaches to detect epimutations, along with functions to annotate and visualize epimutations. Additionally, we have developed an user-friendly Shiny app to facilitate epimutations detection (https://github.com/isglobal-brge/epimutacionsShiny) to non-bioinformatician users. We first compared the performance of epimutacions and ramr packages using three public datasets with experimentally validated epimutations. Methods in epimutacions had a high performance at low sample sizes and outperformed methods in ramr. Second, we used two general population children cohorts (INMA and HELIX) to determine the technical and biological factors that affect epimutations detection, providing guidelines on how designing the experiments or preprocessing the data. In these cohorts, most epimutations did not correlate with detectable regional gene expression changes. Finally, we exemplified how epimutacions can be used in a clinical context. We run epimutacions in a cohort of children with autism disorder and identified novel recurrent epimutations in candidate genes for autism. Overall, we present epimutacions a new Bioconductor package for incorporating epimutations detection to rare disease diagnosis and provide guidelines for the design and data analyses.
Background
The European Commission defines rare diseases as disorders with a prevalence of less than 1 person in 2,000 people [Citation1]. Over 350 million people worldwide and 30 million people in the EU (European Union) may suffer from one of the ≈7,000 existing rare diseases, of which 80% are thought to have a genetic origin [Citation1]. These conditions commonly have an onset during childhood and frequently result in chronic disabilities or even early death [Citation2]. Despite the successful contributions of sequence-based approaches (e.g., exome and genome sequencing), about 60% of the patients remain undiagnosed [Citation3]. Part of these undiagnosed cases are suspected to have a molecular cause different to a genetic aberration.
Epigenetic aberrations can explain additional molecular diagnosis. The most studied epigenetic aberrations are epimutations, i.e., rare alterations in the DNA methylation pattern at specific loci. In humans, DNA methylation commonly occurs in cytosines of CG dinucleotides (CpG sites), so DNA methylation microarrays were developed to measure DNA methylation in a set of 450K (Illumina 450K) or 850K (Illumina MethylationEPIC) CpG sites along the genome. DNA methylation arrays measure the proportion of methylation cells for a given CpG site, returning values from 0 (no cell is methylated) to 1 (all cells are methylated). Methods to detect epimutations from microarray data rely on identifying groups of contiguous CpGs that have DNA methylation values outside the distribution of the reference population, i.e., these measurements are outliers. Two main approaches have been proposed: (i) quantile, which identifies CpG outliers based on the quantile distribution and clusters them in epimutations [Citation4]; and (ii) manova, which identifies candidate regions with bumphunter [Citation5] and then tests the statistical significance of the epimutation with a Multivariate ANOVA [Citation6]. Although these methods have been successful to identify epimutations as the causative factor of some genetic diseases [Citation4,Citation6,Citation7], they are not implemented in any library, so they cannot be easily integrated in bioinformatic pipelines. The ramr Bioconductor package implements other approaches to detect epimutations based on outliers using either the inter-quartile range or beta distribution [Citation8]. However, ramr methods have not been used in real data studies and their performance has not been compared with others.
We have created a Bioconductor package, called epimutacions, that enables detecting epimutations on DNA methylation microarray data and overcomes existing limitations: (i) contains functions implementing previously reported methods (quantile and manova), and (ii) includes more sophisticated statistical methods to detect outliers, such as beta distribution (beta), multivariate regression (mlm), isolation forest algorithm (iForest) and distance-based approach (mahdist). In this paper, we first evaluated the methods included in our package and compared them with the methods implemented in the ramr package [Citation8] using three public datasets with validated epimutations. Second, we used two general population child’s cohorts to determine the technical and biological factors that affect epimutations discovery, providing guidelines on how designing the experiments, preprocessing the data, or choosing the reference samples to include in the analysis. We also used these cohorts to define the epimutations burden in the general population and to explore the association between epimutations and gene expression. Third, we evaluated to what extent epimutations were cell-specific or shared among different blood cell types. Finally, we exemplified how epimutacions can be used in a clinical context, by using the package to detect epimutations in a cohort of children with autism. A Shiny app called epimutacionsShiny is also available to facilitate epimutations detection for a non-bioinformatician experts.
Implementation
The input of epimutacions package is a GenomicRatioSet object, a standard Bioconductor class to manage preprocessed DNA methylation data. epimutacions package includes six methods to detect epimutations, defined as three or more consecutive CpGs with outlier measurements closer than 1kb, following the definition of Barbosa and colleagues [Citation7]. epimutacions methods can be grouped into two main approaches: (I) bumphunter + outlier test and (II) outlier test + clustering (). The bumphunter + outlier test approach, which includes manova, mlm, iForest and mahdist, identifies if a differentially methylated region (DMR), defined using bumphunter [Citation5], is an epimutation. Each method uses a different statistical test: (I) manova uses the covariance between the outcome variables to test the statistical significance of the mean difference in the methylation level between the case sample and the reference panel [Citation9]; (II) mlm creates a multivariate linear model using the reference panel and identifies as epimutations the methylation values that deviated from predicted values [Citation10]; (III) iForest repeats random portioning of observations until all instances are isolated and classifies as outliers the instances isolated in a few splits [Citation11]; and (IV) mahdist calculates the robust Mahalanobis distance using the minimum covariance determinant [Citation12]. The outlier test + clustering approach, which includes quantile and beta, identifies individual CpGs that are outliers and collapses them into epimutations. quantile and beta differ in the distribution used to define the outliers: (I) quantile relies on the quantile distribution [Citation7]; while (II) beta fits the values from the reference population onto a beta distribution. Finally, each method reports the significance of the epimutation using a different measure: manova and mlm assess the significance using a p-value, iForest uses an outlier score, mahdist the chi-square distribution and quantile the extreme quantile value. We defined default significant thresholds, which can be modified by the users (Additional File 1: Supplementary Table S1).
Figure 1. The epimutacions package workflow. The package accepts GenomicRatioSet object as an input. For the case–control configuration (epimutations function), the case samples and the reference panel are introduced separately. However, for the one-against-others configuration (epimutations_one_leave_out function), all samples are introduced together. The six outlier detection methods can be used with the two configurations. manova, iForest, mlm and mahdist identify differentially methylated regions using bumphunter and then test the outliers’ significance, while quantile and beta define outlier CpGs and then group them into epimutations.
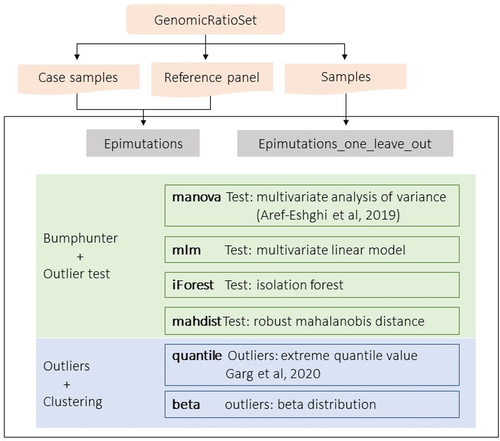
The epimutacions package includes two configurations to detect epimutations (): (i) a case–control configuration, using the epimutations function, which compares one sample at a time against a reference panel; and (ii) a one-against-others configuration, using the epimutations_one_leave_out function, which compares each sample against all the remaining samples. The case–control configuration is designed for case–control cohorts, where we aim to detect epimutations present in the cases as compared with the controls (the reference panel). Notice that epimutations are not computed for the individuals in the reference panel, when using the case–control configuration. The one-against-others configuration is designed when we cannot define a reference panel, such as in a general population cohort or a cohort where all samples are cases. In contrast, the one-against-others configuration detects epimutations for all samples in the datasets.
The package also includes two functions to visualize and annotate the identified epimutations, plot_epimutations and annotate_epimutations, respectively. plot_epimutations shows, for a given epimutation region: (i) the DNA methylation values of all the samples; (ii) gene annotation from TxDb.Hsapiens.UCSC.hg19.knownGene Bioconductor package [Citation13]; and (iii) CpG island and H3K4me3, H3K27me3 and H3K27ac chromatin marks from seven ENCODE cell lines [Citation14,Citation15]. annotate_epimutations uses Illumina annotation to include GENCODE names of genes overlapping the epimutation, and the location of the epimutation CpGs relative to the gene or the CpG island. In addition, annotate_epimutations relies on the biomaRt Bioconductor package [Citation16,Citation17] to map genes to OMIM identifiers and to identify ENSEMBL regulatory regions overlapping the epimutations. The package vignette contains examples of both functions.
Along with the epimutacions package, we provide epimutacionsData, a Bioconductor experiment package to illustrate how to use epimutacions in real settings (https://bioconductor.org/packages/release/data/experiment/html/epimutacionsData.html). epimutacionsData contains two example datasets: (i) a reference panel, GEO GSE127824 [Citation18], which contains 22 control samples; and (ii) a case–control dataset, which contains 48 control samples from GEO GSE104812 [Citation19] and 3 case samples from GEO GSE97362 [Citation20]. epimutacionsData also contains a list of candidate epimutation regions for the Illumina Infinium HumanMethylation450 array (450K array). The list uses a standard nomenclature to enable the comparison of the epimutations detected in different studies. To create the list, we considered that all CpGs in the array were outliers and clustered them using bumphunter [Citation5]. Epimutations can be found in a total of 40,480 regions, considering the irregular distribution of the probes in the 450K array and our definition of epimutation (at least 3 CpGs closer than 1Kb).
We have also developed a shiny app, epimutacionsShiny (https://github.com/isglobal-brge/epimutacionsShiny). That contains all the functionalities of epimutacions and enables using the package with a more user-friendly interface.
Materials and methods
Epimutations’ detection methods comparison
Simulations
We generated synthetic datasets where we included epimutations using ramr package [Citation8]. The underlying DNA methylation distribution for each CpG was derived from GSE84727 dataset (see below). The main simulation dataset consisted on 100 samples, with 10 unique epimutations per sample with a mean methylation difference of 0.4 and a minimum size of 3 CpGs. For assessing the impact of the epimutations’ effect size, we generated a dataset with the same parameters than in the previous simulation, but setting the effect size to 0.2. We assessed the impact of sample size by subsetting from 20 to 90 samples from the main simulation dataset. Finally, we generated small datasets to assess the effect of epimutations recurrency. In each simulation, we randomly selected 1,000 candidate epimutations regions and, on these regions, we introduced 100 epimutations with an effect size of 0.4 and varying levels of recurrence (from 2% to 10% of the samples). These small datasets also contained 100 samples in total. For running epimutacions using the case–control configuration, we set as cases those samples with the epimutation and controls the rest. The synthetic datasets are deposited in Zenodo (https://zenodo.org/record/7839977#.ZD5YuHZBwuU).
We run epimutacions methods using the default values to evaluate their performance (Additional File 1: Supplementary Table S1). Optimal parameters for ramr methods were explored based on the synthetic datasets with unique epimutations. For ramr-IQR, we explored IQR cut-off values between 1.3 and 7, while for ramr-beta and ramr-wbeta we explored q-value cut-offs between 0.05 and 1e-7. Optimal parameters were an IQR of 3 for ramr-IQR, a q-value cut-off of 1e-3 for ramr-beta and a q-value cut-off of 1e-6 for ramr-wbeta (Additional File 1: Supplementary Figure S1). These parameters were used for the evaluation of sample size and recurrency. All the methods were enforced to detect epimutations with at least 3 CpGs separated by less than 1kb. We assessed the performance of the methods using the true positive rate (TPR), false positive rate (FPR) and F1 score (for choosing the optimal parameters). TPR was defined as the proportion of epimutations detected by epimutacions and ramr. FPR was defined as the proportion of false positives over the total number of epimutations detected by a method. F1 score was defined as the harmonic mean between TPR and Precision, which equals to 1 – FDR. True epimutations were defined as an epimutation in a sample partially overlapping an introduced epimutation in the same sample. False positives were defined as an epimutation in sample not overlapping any introduced epimutation in the same sample. False negatives were defined as an introduced epimutation in a sample not overlapping any epimutation called in that sample.
Additionally, we compared the performance of four DMR (Differentially Methylated Regions) to detect epimutations: ProbeLasso [Citation21], DMRcate [Citation22], Bumphunter [Citation5] and Limma + comb-p [Citation23]. In the four cases, one sample was compared against the others. ProbeLasso was run using the champ.DMR function from ChAMP Bioconductor package [Citation24,Citation25], with minDMRsep = 1000, meanLassoRadius = 1000 and minProbes = 3. DMRcate was run with DMRcate Bioconductor package, with lambda = 1000 and min.cpgs = 3. Bumphunter was run using the champ.DMR function from ChAMP Bioconductor package with cut-off = 0.1, minProbes = 3, maxGap = 1000, nullMethod = ‘bootstrap,’ B = 100 and minProbes = 3. The Limma + comb-p approach was run by first running lmFit and then the comb-p pipeline with dist = 1000. For the four methods, we assessed the effect of applying different p-value thresholds, ranging from 0.05 to 1e-12. Columns selected for filtering dependned on the method: ProbeLasso – dmrP column; DMRcate – Stouffer column; Bumphunter – fwer column; Limma+comb-p – z_sidak_p column.
Real dataset
In order to compare the performance of the methods implemented in epimutacions and ramr packages, we applied both packages to GSE84727 [Citation26,Citation27], a public whole-blood DNA methylation dataset from GEO. GSE84727 was a case–control cohort with 847 individuals, 414 schizophrenia cases, and 433 controls. We downloaded the beta values of GSE84727 from GEO which were preprocessed using methylumi package.
We compared the epimutations detected in the GSE84727 dataset by the different epimutations methods: (I) the six methods implemented in our epimutacions R package; (II) the three methods (rmar-iqr, rmar-beta and rmar-wbeta) implemented in ramr Bioconductor package [Citation8]; and (III) quantile-perl, the original implementation in perl of quantile [Citation4]. We compared the methods at two levels: (I) by checking the number of epimutations detected per individual; and (II) by checking the overlap among individuals. epimutacions and ramr methods were run using same parameters than for the simulations.
Effect of technical pre-processing on epimutations detection
INMA study
To assess the effect of preprocessing in epimutacions’ detection we used the DNA methylation data from cord blood and child blood (mean age 4 years) DNA methylation data from children of the INfancia y Medio Ambiente (INMA) Sabadell subcohort. INMA project is a population-based birth cohort in Spain, where all children are from European ancestry [Citation28]. Cord blood samples were used to assess the effect of pre-processing on epimutations detections, while cord blood and child blood samples were used to characterize epimutations in a healthy paediatric cohort (see next section).
Comparison of laboratories methods
DNA methylation data was produced using the Illumina 450K in two laboratories as part of two projects (Lab 1: cord blood and 4-year blood; and Lab 2: only cord blood samples). Preprocessing was initially run using two strategies: combined and independent. In the combined strategy, all idat files were preprocessed as if they came from a single lab. In the independent preprocessing, the idat files of each laboratory were processed independently and merged once the beta values were obtained. In both cases, samples were normalized using meffil package [Citation29], following the default pipeline. Briefly, we filtered samples with low quality based on bead number, a call rate <90%, sex mismatch between sex inferred from DNA methylation and sex reported by the family, outlier control probes values, dye bias, methylated-unmethylated ratio and X-Y ratio. We also removed probes with a call rate <95%, probes not measuring CpGs, problematic probes [Citation30], and probes in sexual chromosomes. Finally, measurements with a detection p-value >2e-16 were set to missing. The combined preprocessing did not reduce batch effect, so we decided to follow independent strategy (data from the two laboratories processed separately) for the epimutacions analyses.
Comparison of technical replicates
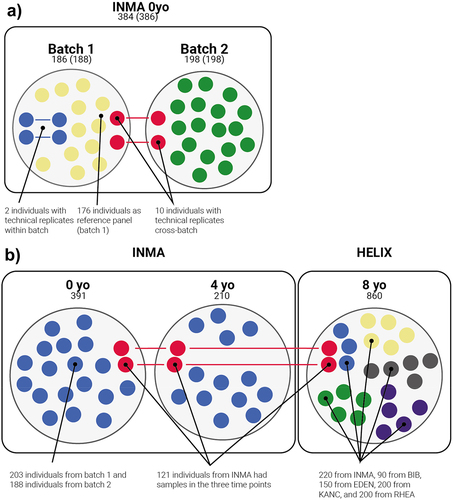
We assessed the effect of preprocessing in epimutacions detection using the technical replicates available in the project. Due to its lower variability, we defined Lab 1 samples as the reference batch, and Lab 2 samples as the alternative batch. We run the epimutations discovery in the samples from the reference batch with technical replicates: two individuals (four samples) with technical replicates in the same batch (two samples); and 10 individuals with technical replicates in each batch (10 samples per batch) (). We run epimutacions using the case–control configuration, so we defined a reference group, which comprised the 176 samples from the reference batch without technical replicates (). We compared the epimutations detected in the technical replicates from the same batch to assess the replicability of the methods, while we compared the epimutations from the technical replicates from different batches to assess the batch effect.
Figure 2. Pediatric cohorts used in the study. Numbers refer to the number of individuals, while numbers in parentheses refer to the number of samples. a: Samples used to evaluate the effect of pre-processing on epimutations detection. All samples are part of the same cohort (cord blood samples of INMA) but were processed in two projects: Lab 1 and Lab 2. Lab 1 was used to define the reference panel, so we called it reference batch, while we defined Lab 2 as alternative batch. Colors define the use of samples in the epimutations analysis: samples used as reference (yellow), technical replicates from the same batch (blue) and technical replicates from different batches (red). Samples from Lab 2 without replicates in Lab 1 (green) were not used in these analyses. b: Samples used to define features of epimutations in a healthy pediatric cohort. At 0 and 4 years old, all samples come from INMA project. At 8 years old, HELIX project contains samples from INMA and four additional cohorts (BIB, EDEN, KANC and RHEA). Samples from INMA project were obtained at three time points (0, 4 and 8 years old). Colors defines the cohort of the samples. INMA individuals present in the three time-points are shown in red, while the rest of INMA samples are shown in blue.
Comparison of normalization methods
We normalized the DNA methylation data from Lab 1 using six algorithms implemented in minfi Bioconductor package [Citation31] (raw normalization, functional normalization [Citation32], Illumina normalization, quantile normalization [Citation33], noob [Citation34] and SWAN normalization [Citation35]) and BMIQ [Citation36] with noob [Citation37] from wateRmelon R package [Citation38]. In all cases, we removed the probes and samples previously identified in the QC performed with meffil. We run the methods using the default parameters defined in minfi v1.36. Then, we compared the epimutations detected after the different normalization approaches in the 14 samples selected in Lab 1 (4 samples with replicates in the same batch, 10 with replicates in the other batch) ().
Epimutations’ replicability
We defined two levels of epimutations replicability. The highest levels are epimutations detected with the same method either in both technical replicates or after normalizing with different algorithms. The second level are epimutations detected in one sample (either technical replicates or normalizations), but with outlier DNA methylation values in the others. Samples with a mean percentile value >0.95 or <0.05 in the epimutation CpGs were considered to have outlier DNA methylation values.
Epimutations’ characterization in a paediatric healthy cohort
INMA study: DNA methylation and gene expression data
Samples from INMA study were also used to characterize epimutations in a healthy paediatric cohort. As described in the previous section, samples from the two laboratories were preprocessed independently and the beta values were merged. In addition to probes and samples removed due to quality (described in the previous section), we also removed technical replicates (either from different or the same batch) and only one was included. We corrected laboratory effect using ComBat [Citation39]. After preprocessing, cord blood and children blood samples were considered as two independent datasets.
We also evaluated the correlation between DNA methylation levels in epimutations and expression of nearby genes. Gene expression data and preprocessing was previously described [Citation40]. A total of 117 children had gene expression and DNA methylation at 4 years.
HELIX study: DNA methylation and gene expression data
The Human Early Life Exposome (HELIX) study is a collaborative project across six established and ongoing longitudinal population-based birth cohort studies in Europe [Citation41]: the Born in Bradford (BiB) study in the UK, the Étude des Déterminants pré et postnatals du développement et de la santé de l’Enfant (EDEN) study in France, the INfancia y Medio Ambiente (INMA) cohort in Spain, the Kaunus cohort (KANC) in Lithuania [Citation42], and the RHEA Mother Child Cohort study in Crete, Greece. The aim of the HELIX project is to describe the exposome, evaluate their association with child health outcomes and investigate molecular mechanisms of action, including blood DNA methylation assessed at the mean age of 8 years with the Illumina 450K array. The obtention of biological samples was previously described [Citation43]. Here, we selected data of 860 children of European ancestry defined by questionnaire.
HELIX was pre-processed with the MethylAid Bioconductor package [Citation44] using default values. We filtered low-quality samples using the overall quality control and detection p-values (call rate < 0.98). We discarded one sample because did not pass any of the two criteria. After flagging probes with low call rate, we checked the sample call rates. We removed one sample with a call rate <98%. We applied functional normalization, which includes Noob background subtraction and dye-bias correction [Citation34]. Finally, measurements with a detection p-value >2e-16 were set to missing.
We also evaluated the correlation between epimutations and nearby gene expression in HELIX. Gene expression, including coding and non-coding transcripts, was assessed with the Affymetrix HTA v2 at the University of Santiago de Compostela (USC), Spain, following Affymetrix protocol. Data was normalized with the GCCN (SST-RMA) algorithm at the gene level. Annotation of transcript clusters (TCs) was done with the ExpressionConsole software using the HTA-2.0 Transcript Cluster Annotations Release na36 annotation file from Affymetrix. After normalization, several quality control checks were performed and four samples with discordant sex and two with low call rates were excluded [Citation45]. Control probes were excluded. Probes with a DABG (Detected Above Background) p-value <0.05 were considered to have an expression level different from the background, and they were defined as detected. Probes with a call rate <1% were excluded from the analysis.
Gene expression values were log2 transformed and batch effect controlled by residualizing the effect of surrogate variables calculated with the sva method [Citation46] while protecting for main variables in the study (cohort, age, sex, and blood cellular composition). A total of 640 children had gene expression and DNA methylation.
Epimutations’ detection
To remove technical effects and artefacts from the data, the top two principal components of the DNA methylation were regressed out before running epimutacions. The number of principal components to regress out was estimated using isva CRAN package. Principal components were computed independently for INMA cord blood and INMA children blood samples, using meffil [Citation29] package. After principal components were regressed out with limma [Citation47], we run epimutacions using the one-against-others configuration and quantile, beta and mlm approaches in the two INMA time points and HELIX.
We assessed whether the processing lab, the cohort, child age, child sex or maternal smoking during pregnancy modified the epimutations’ burden, using two approaches. First, we used a chi-square test (or a logistic regression for age – continuous) to evaluate which factors modified the likelihood of an individual of having at least an epimutation. Second, we selected individuals with at least one epimutation, and we ran a Poisson regression model to test whether these factors altered the number of epimutations per individual. For the age effect, we made two analyses: (I) between time-points comparisons (i.e., 0, 4 or 8 years); and (II) within each time-point comparisons (i.e., test small age differences between children in each time-point). For sex and maternal smoking, we additionally evaluated the effect of having systematic differences between the control group and the cases. We run epimutacions in the case–control configuration, using as a reference group all girls, all boys, or all children whose parents did not smoke. We defined as recurrent sex-specific epimutations those epimutations not detected in the one-against-others but with a frequency >0.5% for one of the sexes. Similarly, we defined as recurrent of children whose parents smoked those epimutations with a frequency >0.5% and not found in the one-against-others approach.
We defined the epimutations magnitude as the mean of the differences between the median methylation of the target sample and the median methylation of the reference population (in this setting, the remaining samples of the cohort). We computed the overlap between detected epimutations and imprinted regions as defined by Court and colleagues [Citation48]. We also explored whether epimutations were persistent in time, i.e., whether the same epimutations in the same individual was present at the three time points. We defined as recurrent those epimutations detected in >0.5% of the individuals in the three time points. Persistent epimutations were explored on the 110 individuals from INMA having a sample at the three points and using the same approach to assess replicability used for technical replicates (see Outlier signal section).
Correlation with gene expression
We correlated epimutations with gene expression of nearby genes. As there is no straightforward way to link DNA methylation with gene expression, we used three approaches: (i) eQTM, (ii) TSS and (iii) nearest. In eQTM, we linked the CpG to a gene if it was found in the eQTM (expression quantitative trait methylation) catalogue in children’s whole blood [Citation43]. Gene expression data from INMA and HELIX was obtained from the same array used to define the catalogue, so the catalogue gave us directly the mapping between the CpG and the gene. In the TSS approach, we linked the CpGs annotated to the promoter regions (TSS1500 or TSS200 in Illumina annotation) of a gene, to the gene having the same gene Symbol in the arrays. Finally, for the nearest approach, we mapped the CpG to the nearest gene in the array, considering only genes whose TSS (transcription start stie) was closer than 250Kb to the epimutation CpGs.
To define gene expression as an extreme value we used three approaches: (1) outlier; (2) z-score and (3) rank. A gene expression measure was considered an outlier if it was <25% percentile − 1.5 × IQR or >75% percentile + 1.5 × IQR, where IQR is the interquartile range. z-score was defined as . The rank was the position of the measurement inside the population, the lowest gene measurement has a rank of 1 and the highest a rank equal to the number of samples.
Cell-type specificity of epimutations
Datasets
We used the GEO GSE87650 superseries [Citation49] to evaluate the effect of cell-type in epimutations. GSE87650 superseries contains a dataset of DNA methylation (GSE87640) and another of gene expression (GSE86434) for the same 63 samples.
GSE87640, the DNA methylation dataset, contains individuals with samples from different cell types (whole blood, CD4, CD8 and monocytes), totalling 232 samples. GSE87640 was generated with the Illumina 450K DNA methylation array. We downloaded the beta values from GEO, which were preprocessed using lumi, methylumi and minfi Bioconductor packages [Citation49]. We run a PCA on the general matrix and discarded samples grouped with a discordant cell type cluster. We applied the same criteria for discarding probes than in the previous datasets. Measurements with a detection p-value >2e-16 were also set to missing.
GSE86434 contains gene expression values from the same samples than GSE87640. We used this dataset to assess the correlation between epimutations and gene expression. Gene expression data was generated with Illumina HT12 human v4 array. We downloaded gene expression data from GEO, which was previously processed with lumi and limma Bioconductor packages [Citation49].
Epimutations’ detection
Samples were grouped by cell type and considered as independent datasets. We also regressed out top principal components, to remove technical effects from the data, as described for the paediatric cohorts (see previous section). Principal components were computed independently for each cell type dataset and was 2 for all cases. After principal components were regressed out, we run epimutacions using the one-against-others configuration and the quantile method.
Epimutations’ replicability was defined as finding the same epimutation in the same individual in different cell types. Replicability was assessed using the same approach than for technical replicates (see Outlier signal section).
Correlation with gene expression
We used the same approach to correlate epimutations with gene expression than for the paediatric cohorts (see previous section). However, as the eQTM catalogue was generated with a different gene expression array than GSE87640, we mapped both array feature names to gene Symbol to have coincident ids.
Application to a cohort of autism patients
Dataset
We applied epimutacions to a cohort of autism patients to exemplify how to use it in practice. We used the GSE83424 dataset [Citation50], which contains 63 DNA methylation samples from whole blood, comprising 10 controls and 53 individuals with autism. Normalized beta values were downloaded from GEO, and we applied the same criteria for discarding probes than in the previous datasets. Finally, measurements with a detection p-value >2e-16 were set to missing.
Epimutations’ detection
We applied the same approach described above to remove technical effects from the data: the first two principal components were regressed out before running epimutacions. After the principal components were regressed out, epimutacions was run with the quantile method and using the one-against-others and the case–control approaches. For the latter, healthy individuals were the reference panel so epimutations were only estimated in autism cases.
Results
Comparison of methods to detect epimutations
In our package epimutacions, we have implemented two previously described methods (quantile and manova) and four new methods (beta, mlm, iForest and mahdist) to detect epimutations. We evaluated their performance on synthetic datasets where epimutations were randomly introduced (see Methods), and compared their results with the methods from the ramr package and four methods to detect DMRs (Differentially Methylation Regions): ProbeLasso, DMRcate, Bumphunter and Limma + comb-p.
First, we introduced unique epimutations, i.e., each epimutation was only present in a sample, with different DNA methylation differences. All methods from epimutacions and ramr but iForest had an almost perfect TPR for epimutations with large effect sizes (Additional File 1: Supplementary Figure S2), while mlm, manova, mahdist, ramr-beta and ramr-wbeta had also a very high TPR for medium effect size epimutations. In general, the FDR of all methods was below 5%. All methods to detect DMRs had a lower performance than methods designed to detect epimutations (Additional File 1: Supplementary Figure S3). Regarding effect size, all methods but iForest presented the same performance with a sample size as small as 20 samples (Additional File 1: Supplementary Figure S4).
Second, we further evaluated the performance of epimutations’ methods for recurrent epimutations, i.e., epimutations present in multiple samples. The case–control configuration performed much better than the one-against-others configuration (Additional File 1: Supplementary Figure S5), having the best performance independent of the frequency of the recurrent epimutation. ramr-IQR and ramr-wbeta were not affected by the epimutation frequency, while rmar-beta performance was penalized for epimutations with a frequency higher than 8% in the dataset. Finally, we evaluated the time and the memory usage of the methods to detect epimutations. epimutacions methods had comparable times to ramr methods for the case–control configuration, while they were slower when using the one-against-others approach (Additional File 1: Supplementary Figure S6). Memory consumption was higher for epimutacions methods, especially for the one-against-others configuration (Additional File 1: Supplementary Figure S7).
We run epimutacions (using one-against-others configuration) and ramr methods in the 847 whole blood samples of a case–control cohort of adults with schizophrenia (GSE84727 dataset). epimutations’ methods have diverse levels of sensitivity, ranging from quantile (the most restrictive), which detected one epimutation in few samples, to manova, mlm and iForest (the most liberal), which detected a high number of epimutations in most samples (). Epimutations detected by quantile were also detected in the more liberal list of epimutations detected by the other methods, except for mahdist, which detected a high number of epimutations not detected by any other method (). Regarding rmar methods, ramr-wbeta detected more epimutations per sample than any other method, ramr-IQR and ramr-beta detected a similar number of epimutations than manova, mlm or iForest (). Finally, quantile detected all the epimutations detected by quantile-perl (original implementation of quantile method), showing the accuracy of our implementation.
Figure 3. Evaluation of method to detect epimutations. We ran the methods of epimutacions and ramr packages in GSE84727 dataset. We compared the overlap epimutations per method and the identified epimutations per individual. a: Sensitivity of epimutacions methods. Each column contains the proportion of individuals in GSE84727 with a given number of epimutations detected. b: Overlap of the epimutations detected by the different epimutacions methods. c: Sensitivity of rmar methods, compared with beta, mlm, and quantile. These three epimutacions methods were selected because they represented three different sensitivity levels. d: Overlap of the epimutations detected by the rmar methods, beta, mlm, and quantile.
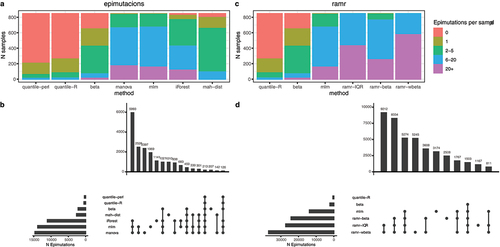
Based on these results, we selected quantile, beta and mlm for the next sections. quantile and beta detected none or few epimutations per sample, which is what we expect in a reference population if epimutations have a relevant effect in phenotype. We also added mlm to include a more liberal method. All in all, these methods showed a satisfactory performance and represent diverse levels of sensitivity.
DNA methylation pre-processing influences epimutation detection
We assessed whether the algorithm used to normalize the data or processing the sample in multiple laboratories affected epimutations detection. To this end, we used a general population cohort of newborns with DNA methylation obtained from cord blood (INMA). Samples were processed in two labs and 14 samples had technical replicates, either in the same lab or in different labs (). We run epimutacions using quantile, beta and mlm on samples with replicates using as a reference the samples of the reference batch without replicates ( and see Materials and Methods).
The algorithm used to normalize DNA methylation data affected epimutation detection. We normalized the data with seven algorithms and compared the epimutations detected for the same sample after each normalization. The three methods only found a subset of the epimutations in all the normalizations (Additional File 1: Supplementary Figure 8A). Nonetheless, epimutations detected in one normalization had extreme methylation values in the others (Additional File 1: Supplementary Figure 8B and Supplementary Figure 9). Epimutations detected in technical replicates from the same batch showed a similar pattern. While only a subset of the epimutations were called in both replicates, all the epimutations presented extreme methylation values in both replicates (, Additional File 1: Supplementary Figure 10). This pattern was present in all the normalization algorithms (Additional File 1: Supplementary Figures 11–12).
Figure 4. Replicability of epimutations in technical replicates. a: Replicability of epimutations in technical replicates from the same batch. Both replicates: epimutations detected in both replicates. One replicate and outlier signal: epimutations detected in one replicate, while in the other replicates these CpGs are in the most extreme 5%. b: Replicability of epimutations in technical replicates processed in different batches. Each point correspond to a combination of individual, epimutations’ method and preprocessing (raw or residuals). Y-axis represents, for each individual, the proportion of epimutations detected under each replicability state. Both replicates: epimutations detected in both replicates (violet). One replicate and outlier signal: epimutations detected in one replicate, while in the other replicates these CpGs have measurements in the most extreme 5% (purple). Reference: epimutation detected in the replicate from the reference batch and without outlier signal in the replicate from the alternative batch. Alternative: epimutation detected in the replicate from the alternative batch and without outlier signal in the replicate from the reference batch.
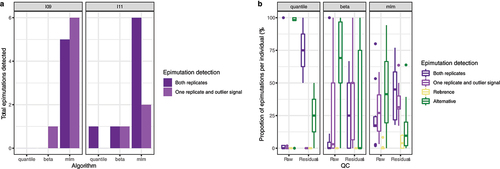
Processing samples in different labs had a greater effect on epimutation detection. In our dataset, samples were grouped by the lab they were processed, either when we processed samples from each lab independently or when we normalized all samples together (Additional File 1: Supplementary Figure 13). When we run epimutacions on the technical replicates from different batches, a low proportion of the epimutations were detected in both technical replicates, while most epimutations were only detected in the technical replicate from the alternative batch (). Regressing out the first principal components (PCs) of the whole methylation matrix removed the effect of lab (Additional File 1: Supplementary Figure 15). Consequently, a high proportion of epimutations were identified in both technical replicates, while the proportion of epimutations only identified in the technical replicate from the alternative batch was much lower (, Additional File 1: Supplementary Figure 15). When all samples come from the same lab, regressing out the first PCs did not affect epimutation detection (Additional File 1: Supplementary Figure 16). Thus, most epimutations were detected either in the original matrix or after regressing out the first methylation PCs (Additional File 1: Supplementary Figures 17–18). Consequently, we regressed out the first PCs in all the subsequent analyses.
Epimutation characterization in a paediatric healthy cohort
We explored which biological factors modified the epimutation burden (i.e., the probability of having at least an epimutation) in a general paediatric cohort. Our paediatric cohorts include INMA (newborns n = 391, and 4y n = 210 from Spain) and HELIX (8y n = 860) HELIX project is composed of five European cohorts: (I) INMA from Spain; (II) BIB from the United Kingdom; (III) EDEN from France; (IV) KANC from Lithuania; and (V) RHEA from Greece. One hundred and ten individuals had samples in the three time points. While the cohort was gender-balanced at the three time points, other covariables exhibited differences between HELIX cohorts (). Thus, EDEN and INMA children were older (p-value <2e-16), while a lower proportion of KANC children were passive smokers (p-value = 1.23e-5).
Table 1. Summary of our paediatric cohort.
We aimed to achieve four goals with this dataset: (I) estimate the epimutation burden in a healthy population; (II) identify the factors that can determine it; (III) explore the features of the epimutations detected in a healthy population; and (IV) analyse the association of epimutations with gene expression. To this end, we run epimutacions in these cohorts using quantile, beta and mlm and the one-against-others configuration.
Biological factors have a low effect on epimutation burden
epimutacions methods had different sensitivities that resulted in different inferred epimutation burdens (), ranging from 30% with quantile to >85% with mlm. Although individuals present more epimutations when using more sensitive methods, all methods identified individuals with an extreme number of epimutations (>20) in the three time points.
Figure 5. Epimutations in healthy tissues. a: Epimutations’ burden for a pediatric cohort. Each column contains the proportion of individuals of this cohort with a given number of epimutations detected. Epimutations were detected using quantile, beta and mlm methods. b: Proportion of expression outliers linked to epimutations in the pediatric cohorts. We consider a sample an expression outlier when its expression was lower than Q1–1.5·IQR or higher than Q3 + 1.5·IQR. Three approaches to map epimutations to genes were used: (1) eqtm - use an eQTM catalogue; (2) tss - map an epimutation to a gene when any of the CpGs of the epimutations is mapped to TSS200 or TSS1500 in Illumina annotation; (3) near - map to the gene closest to the epimutation. c: Epimutations replicability in different cell types. Epimutations were grouped depending on the cell type(s) they were detected: CD4 - epimutations only in CD4 (pink), CD8 - epimutations only detected in CD8 (green), monocytes - epimutations only detected in monocytes (blue), 2+ cell types - at least two cell types but not in blood (red), Whole blood - epimutations detected in whole blood but not in the cell types (grey), Whole blood + 1–2 cell types or Whole blood + 3 cell types. Epimutations: epimutations were detected with epimutacions. Epimutations + outliers: epimutations detected in one cell type or whole blood and with outlier values in another cell type or whole blood.
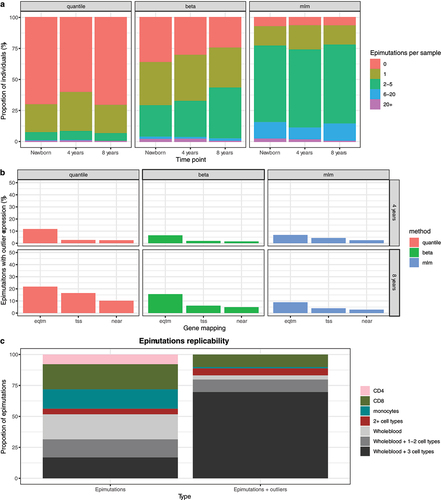
Next, we assessed the influence of five factors in the epimutations burden: (I) lab where samples were processed; (II) cohorts in HELIX; (III) child age, (IV) child sex, and (V) maternal smoking during pregnancy. First, neither laboratory in the newborns’ timepoint nor HELIX cohort in the 8 years’ time point modified the epimutation burden (Additional File 1: Supplementary Figures 19–20). Second, the correlation between age and epimutation burden was not clear. While the epimutation burden was higher at 8 years than at birth using beta (p-value = 1.2e-4), this correlation was not observed for the other methods (). Besides, inside each time-point, older children did not have a higher epimutation burden. Third, boys did not have a different epimutation burden than girls (Additional File 1: Supplementary Figure 21). However, if we run epimutations detection using a reference panel from the other sex (e.g., run epimutation detection in boys using girls as a reference), the methods recurrently identified epimutations absent in the one-against-others approach. Overall, quantile detected 70 recurrent sex-specific epimutations, beta 208 and mlm 526 (Additional File 2). Recurrent sex-specific epimutations comprised >90% of CpGs previously identified as having differences in DNA methylation between boys and girls [Citation51], when using quantile or beta and >50% when using mlm (Additional File 1: Supplementary Figure 22). Fourth, maternal smoking during pregnancy or parental smoking during childhood were not consistently associated with a higher epimutation burden or with a higher number of epimutations per individuals (Additional File 1: Supplementary Figure 23). When running epimutacions in children whose parents smoked in childhood using the rest as controls, only five epimutations were recurrently found in children exposed to passive smoke (Additional File 3) and all were identified in newborns.
Features of the detected epimutations
We explored four features of the epimutations detected in our paediatric cohort: (1) direction and magnitude; (2) overlap with imprinted regions; (3) recurrence, and (4) persistence. First, hypermethylation epimutations were more frequent than hypomethylation epimutations (Additional File 1: Supplementary Table S2). Regarding the magnitude, epimutations detected by quantile had a magnitude 0.1 points higher (p-value <2e-16) than epimutations detected with beta or mlm, independent of the time-point or the epimutation direction (Additional File 1: Supplementary Figure 24). Second, a small proportion of epimutations overlapped with imprinted regions, ranging from 1.6% in mlm to 4.7% in quantile (Additional File 1: Supplementary Table S3).
Third, despite most epimutations were detected in only one individual (Additional File 3), more sensitive methods were more likely to detect the same epimutation in different individuals (50% epimutations shared in mlm vs 20% in quantile). More than 40% of the epimutations detected in our dataset were not previously reported in four children’s cohorts [Citation4] (Additional File 1: Supplementary Figure 25). Nonetheless, in these four children’s cohorts, the percentage of epimutations found only in one cohort was higher (83.7%) [Citation4]. Comparing the frequency of the epimutations in our cohort with those reported in the four children’s cohorts, most epimutations had exceptionally low frequencies in both datasets, and no clear correlation was observed (Additional File 1: Supplementary Figure 26).
Fourth, to explore the persistence of epimutations across time, we used the 110 INMA individuals with samples in the three time points and defined as persistent those epimutations identified in all three time points (Additional File 5). More than half of the epimutations were found in just one time point, irrespective of the method applied (Additional File 1: Supplementary Figure 27). After considering having outlier DNA methylation measurements, 79.5% of epimutations identified with quantile were persistent, while less than half of the epimutations detected by beta or mlm were persistent.
Correlation with gene expression
We assessed whether the epimutations detected were associated with aberrant changes in gene expression in the 4- and 8-year time-points. As there is no optimal method to define gene expression outliers for microarray data, we used three measures: (1) outlier; (2) z-score, and (3) rank. Since genes regulated by each CpG are not well defined, we also used three approaches to map epimutations to genes: (1) eQTM – existing catalogue in blood [Citation43]; (2) TSS – gene annotation by Illumina for CpGs mapped to a TSS1500 or TSS200 region; (3) map the CpG to the nearest gene.
Most epimutations were not associated with outlier gene expression in any method or under any annotation strategy () (Supplementary Figures 28–29) (Additional File 6). Detecting epimutations with quantile and using eQTM to map epimutations to genes yielded the highest proportion of epimutations with significant cis-acting effects on expression (11.8% at 4 years and 21.4% at 8 years). In the 8 years’ time-point, a higher proportion of the epimutations modified nearby expression, with some epimutations having close genes with a strong overexpression (Additional File 1: Supplementary Figure 29).
Cell-type specificity of epimutations
We explored the effect of cell type on epimutation detection on the GSE87640 dataset, which contains the DNA methylation of the same 63 individuals in whole blood and three cell types. We considered each cell type as an independent dataset and ran epimutacions using the one-against-others approach and the quantile method, selected based on the previous results.
We identified 89 regions as epimutations in whole blood or in at least one cell type, with 39 unique individuals having at least one epimutation. Only 15/89 epimutations (16.9%) were identified in whole blood and the three cell types, while 39/89 epimutations (43.8%) were only identified in a cell type (i.e., cell-type specific epimutations) (). When regions with outlier values were also considered, 62/89 epimutations (69.7%) were identified in whole blood and the three cell types (Additional File 1: Supplementary Figure 30). In contrast, 10/89 epimutations (11.2%) were cell-type specific and were typically located in regions with cell-type specific methylation patterns (Additional File 1: Supplementary Figure 31).
We also assessed the association between epimutations and gene expression. We applied the same three metrics for gene expression (outlier, z-score, and rank) and the same three approaches (eQTM, TSS, near) to map epimutations to genes than for the paediatric cohort. Between 10% and 20% of epimutations were associated with gene expression, depending on the tissue and the approach to map epimutations to genes (Additional File 1: Supplementary Figures 32–33). The eQTM approach did not result in a higher proportion of epimutations mapped to outlier genes, as happened in the paediatric cohort.
Application to a clinical setting: Epimutations detection in a cohort of autism patients
We applied epimutacions to whole-blood DNA methylation of case–control of 53 individuals with autism and 10 controls (the GSE83424 dataset) to exemplify how epimutations detection could be incorporated into a clinical setting. We used quantile and compared the results of applying the case–control or the one-against-others approaches.
Using the case–control approach, we detected 83 epimutations in 42/53 cases (79.2%) (Additional File 7). Ten epimutations were recurrent, i.e., found in at least three samples (frequency >5%) (Additional File 8). Four epimutations were found in genes associated with autism: two recurrent epimutations in BRSK2 gene and NUP20L promoter and two epimutations in ZCCHC9 and PHACTR1 (). While epimutations in ZCCHC9 and PHACTR1 have been previously reported [Citation50], the recurrent epimutations are novel. Additionally, we identified an epimutation in an imprinted region on HM13 gene (), which was previously described in schizophrenia patients [Citation52].
Figure 6. Epimutations in an autism cohort. a-e: Candidate epimutations associated with autism disorder. Mean methylation values for control samples are represented in cyan. Control individuals are colored in black, autism individuals in dark red, and individuals with the epimutation in the other colors. The grey area marks the mean ± 1, 1.5 and 2 SD of the control measurements. a-b: Recurrent epimutations in BRSK2 and NUP20L. c-d: non-recurrent epimutations in ZCCHC9 and PHACTR1. e: epimutation in an imprinted region in HM13 gene. f: Epimutations’ burden in the autism cohort per disease status. Each column contains the proportion of individuals of this cohort with a given number of epimutations detected.
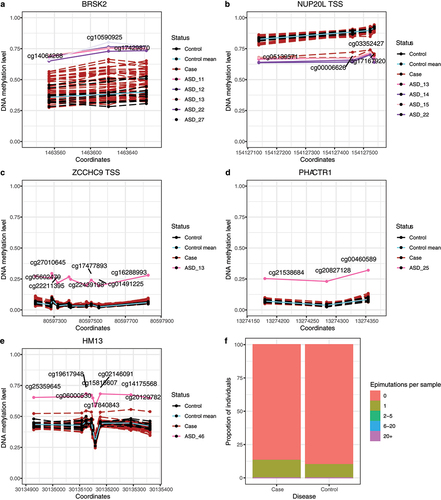
Using the one-against-others, we only identified eight epimutations, seven in autism patients and one in controls. Therefore, autism individuals did not present a higher epimutation burden than controls (p = 0.78) (). Inside the eight epimutations detected, we identified epimutations in ZCCHC9 and PHACTR1 genes, but none of the recurrent epimutations.
Discussion
We have developed epimutacions, a Bioconductor package to detect, annotate and visualize epimutations using Illumina DNA methylation microarray data, which is available in Bioconductor. We demonstrated that the six methods available in epimutacions package can reliably detect epimutations in DNA methylation data. All methods but iForest had a TPR close to 100% and independent of the sample size, while iForest required a bigger sample size (>60 control samples) for a satisfactory performance. mahdist, beta and quantile had better control of false positive and their FPR was <5%. The epimutations detected by manova, mlm, iForest, beta and quantile overlapped, which means that the methods are quite reliable when doing the analysis. However, manova, mlm and iForest detected a higher number of epimutations than beta and quantile, respectively. Thus, we can choose manova, mlm and iForest when prioritizing detecting all possible epimutations, or quantile and beta if we aim to be more restrictive. mahdist detected many epimutations not detected by any other methods, so we discourage its use.
We compared the performance of epimutacions and ramr [Citation8] packages. While the alternative Bioconductor package ramr used GRanges objects as the main input source with DNA methylation values added as metadata, epimutations used GenomicRatioSet, a Bioconductor package designed to manage DNA methylation data, which is easy to obtain from common DNA methylation pre-processing pipelines. Although ramr methods presented a high performance, case–control configuration in epimutacions outperformed ramr methods when recurrent epimutations are present in the case samples, making epimutacions more suitable for a clinical application. Finally, our implementation of quantile detected all the epimutations of quantile-perl (the original perl implementation) and additional epimutations, possibly because quantile excludes the target sample when computing the methylation quantiles, whereas in quantile-perl the quantiles are computed including the target sample.
Throughout this work, we have used the expected replicability to compare the algorithms and to assess distinct factors that might influence epimutation detection. In general, we obtained a low or modest replicability when defining replicability as calling the epimutation, independent of the comparison or the assessed factor. However, when we used a more relaxed definition, checking if we found outlier DNA methylation values for the same CpGs, the replicability increased. On one hand, these results suggest that detection algorithms can capture epimutations due to true biological differences rather than due to technical artefacts. On the other, most epimutations detected might be close to the detection threshold, so slight changes in DNA methylation values might affect the epimutation detection. The clearest example is the comparison between normalization algorithms. Different normalization algorithms might result in minor differences in DNA methylation values [Citation53], which affects other DNA methylation derived measurements, such as DNA methylation age [Citation54]. In our case, differences between normalization algorithms are also enough to affect the epimutations detected, although individuals with epimutations have the most extreme DNA methylation values independent of the normalization method. Overall, more sensitive experimental approaches should be considered when replicating previously detected epimutations.
Batch effect was the factor with the strongest effect on epimutation detection. Our dataset had a strong batch effect due to having samples processed in two projects executed at various times, by different labs and people. In this setting, using samples from a different batch as a reference panel inflates the epimutations detected. To correct the batch effect, or other systematic biases in the data, we suggest regressing out the top principal components of methylation before running the analysis. A similar approach is proposed in OUTRIDER, a Bioconductor package to detect gene expression outliers [Citation55]. This approach removed the batch effect and corrected for technical covariates while preserving the biological signal for epimutations. Nonetheless, if the differences between cases and controls are large, this approach might remove epimutations shared by many cases.
We report biological factors that affect epimutation burden, being the most relevant factor sex. Although boys did not have a different epimutation burden than girls, systematic differences in DNA methylation between boys and girls [Citation51,Citation56] led to the detection of artificial epimutations. Despite age was described to increase epimutation burden [Citation4], the association between age and epimutation burden was not clear in our dataset. Previous studies compared children with elderlies, so larger age differences might be required to see an effect in epimutation burden. Finally, parental smoking did not modify epimutation burden. Considering parental smoking as a proxy of common environmental exposures, due to its persistent impact on DNA methylation [Citation57], the effect of common environmental exposures on epimutation burden seems minor. These results provide guidelines for designing an epimutations discovery experiment. Balancing sex and age between cases and controls is essential, while other environmental variables are not so relevant.
A high proportion of epimutations found in whole cord and peripheral blood was shared among different cell types. A previous study already described an overlap of epimutations in blood cells and fibroblasts [Citation7]. These results suggest that a considerable proportion of the epimutations detected in any tissue appeared in the embryo and were inherited by different cell lineages. This early origin can also explain the persistence of epimutations over time. The prenatal origin of epimutations can be explained by genetic variants, inheritance from parents or the result of environmental insults during pregnancy. Previous results support a prominent role of genetic variants, with 70% of epimutations close to genetic variants and two-thirds shared by twins [Citation4]. The inheritance of epigenetic patterns in humans is still controversial [Citation58], despite recent studies supporting this mechanism. Epimutations’ inheritance [Citation59,Citation60] was assessed in a familial study, and the inheritance frequency of epimutations was the expectation of a Mendelian transmission [Citation7]. Finally, as previously discussed, our results do not support a relevant role for environmental insults during pregnancy. Overall, further studies are required to define the origin of epimutations in the general population, their sharing between different tissues and their persistence over time.
Although epimutacions enables the detection of epimutations for a clinical application, additional steps are required to define pathogenic epimutations. First, epimutations can be prioritized based on their effect on gene expression, as epimutations with clinical impact are expected to significantly alter gene expression [Citation7,Citation50,Citation61]. In contrast, most epimutations in healthy population did not have a relevant effect on nearby gene expression, either in whole blood or in specific cell types, as previously described [Citation4]. Second, epimutations present in the general healthy population are expected to have a low or null effect on disease. Thus, recurrent epimutations, i.e., epimutations found in different healthy datasets, are likely to be benign. Despite epimutations’ recurrence in healthy population is quite low, either in our paediatric cohort or in the literature [Citation4], a database of epimutation variation in healthy individuals at different ages (mainly in blood DNA, but also in other tissues) would improve the application of epimutations to clinical practice. Similar initiatives for genetic variants, such as gnomAD [Citation62] or DGV [Citation63], boosted the application of genetics in the clinical context. In addition, a catalogue with clinical interpretation (from benign to pathogenic) of epimutations found in the different diseases, similar to clinVar [Citation64] will also be needed. In our package, we propose a nomenclature for epimutations, which might serve as a basis for such databases.
Finally, we exemplified how to use epimutacions by applying it to an autism cohort. epimutacions enabled to detect epimutations using two approaches: case–control and one-against-others. On one hand, the case–control approach is useful in a clinical setting, where the aim is to find epimutations causative of the disease, an approach already used in previous works [Citation6,Citation7,Citation50,Citation52]. The case–control approach can be used to identify candidate epimutations specific to one individual and to identify recurrent epimutations in the cases. Thus, the case–control approach identified two novel recurrent epimutations in BRSK2 and NUP20L genes. BRSK2 was associated with autism in SFARI Gene database [Citation65], while epigenetic aberrations in NUP20L promoter were only found in autism samples [Citation66]. On the other, the one-against-others approach was not able to detect recurrent epimutations and only detected epimutations specific of an individual. Thus, while the one-against-others approach can still be useful in an epidemiology setting, where a reference population cannot be defined, this approach might miss epimutations present in more than one individual. Consequently, we strongly recommend including control samples when using epimutations in a clinical context.
This work has some limitations. First, we evaluated the effect of technical variables in only one cohort, which contained few technical replicates. Second, all the datasets analysed were generated with the Illumina Infinium HumanMethylation450 methylation array while current studies are using Illumina Infinium MethylationEPIC. Nonetheless, both arrays follow the same technology and have comparable measures for shared probes [Citation67], so conclusions are expected to hold on to the new array.
The work also has some strengths. We characterized how the most common technical and biological factors can affect epimutation detection, providing guidelines for study design. The use of a longitudinal cohort allowed us to study the persistence of epimutations and their lifetime origin. Finally, the batch effect in our cohort represents a worst-case scenario. Thus, if the residuals approached worked in this setting, we expect to also work in other datasets, where a lower batch effect is expected.
Overall, this work present epimutacions, a Bioconductor package to detect epimutations using DNA methylation microarray data. We have explored distinct factors that affected epimutation detection and burden, thus providing guidelines on how to include epimutations into clinical practice.
List of abbreviations
| ANOVA | = | ANalysis Of VAriance |
| BIB | = | Born in Bradford study |
| CpG | = | cytosine nucleotide followed by a guanine nucleotide |
| DABG | = | Detected Above Background |
| EDEN | = | Étude des Déterminants pré et postnatals du développement et de la santé de l’Enfant Project |
| ENCODE | = | Encyclopedia of DNA Elements Consortium |
| eQTM | = | expression quantitative trait methylation |
| EU | = | European Union |
| FDR | = | False Discovery Rate |
| FPR | = | False Positive Rate |
| GEO | = | Gene Expression Omnibus |
| HELIX | = | Human Early Life Exposome project |
| INMA | = | INfancia y Medio Ambiente cohort |
| IQR | = | interquartile range |
| KANC | = | Kaunus cohort |
| Kb | = | kilobase |
| RIN | = | RNA Integrity Number |
| RHEA | = | Mother Child Cohort study |
| RMA | = | Robust Multiarray Average |
| OMIM | = | Online Mendelian Inheritance in Man |
| PC | = | Principal Component |
| SD | = | Standard deviation |
| TC | = | transcript cluster |
| TPR | = | True Positive Rate |
| TSS | = | Transcription Start Site |
Authors’ contributions
JRG conceived the original idea of creating a Bioconductor package for epimutations and the use of a new statistical methods to detect outliers. CR-A, LA, CHF and DP-S developed and implemented epimutacions R package. XE-M developed the shiny app. LA run the comparison with ramr methods. CR-A evaluated epimutacions in the healthy cohorts, assessed the cell-type specific epimutations and applied the package to the autism cohort. LAP-J and JRG supervised the work. All the other authors read and approved the final manuscript.
Availability and requirements
Project name: epimutacions
Project home page: https://github.com/isglobal-brge/epimutacions (devel), https://bioconductor.org/packages/release/bioc/html/epimutacions.html (release).
Operating system: Platform independent
Programming language: R
Other requirements: R 4.2.0 or higher, Bioconductor 3.15 or higher.
License: MIT License
Any restrictions to use by non-academics: attribution is required.
Project name: epimutacionsShiny
Project home page:https://github.com/isglobal-brge/epimutacionsShiny
Operating system: Platform independent
Programming language: R
Other requirements:
Option 1: R 4.2.0 or higher, Bioconductor 3.15 or higher, epimutacions and shiny
Option 2: Docker.
License: MIT License
Any restrictions to use by non-academics: None
Availability of data and materials
Release version of epimutacions is available in Bioconductor: https://bioconductor.org/packages/release/bioc/html/epimutacions.html.
The devel version of epimutacions is available in GitHub: https://github.com/isglobal-brge/epimutacions
epimutacionsData, a package with data for testing epimutacions is also available in Bioconductor:
https://bioconductor.org/packages/release/data/experiment/html/epimutacionsData.html
The shiny app, epimutacionsShiny, is available in GitHub:https://github.com/isglobal-brge/epimutacionsShiny
The code to replicate the analysis is available in our GitHub repository: https://github.com/isglobal-brge/Supplementary-Material/blob/master/Ruiz_Arenas_2023.
Illumina methylation DNA microarray data used in this manuscript is available through the Gene Expression Omnibus (GEO) series accession GSE87650 (https://www.ncbi.nlm.nih.gov/geo/query/acc.cgi?acc=GSE87650), GSE87640 (https://www.ncbi.nlm.nih.gov/geo/query/acc.cgi?acc=GSE87640), GSE86434 (https://www.ncbi.nlm.nih.gov/geo/query/acc.cgi?acc=GSE86434), GSE83424 (https://www.ncbi.nlm.nih.gov/geo/query/acc.cgi?acc=GSE83424), GSE51032 (https://www.ncbi.nlm.nih.gov/geo/query/acc.cgi?acc=GSE51032), GSE111629 (https://www.ncbi.nlm.nih.gov/geo/query/acc.cgi?acc=GSE111629) and GSE84727 (https://www.ncbi.nlm.nih.gov/geo/query/acc.cgi?acc=GSE84727).
INMA and HELIX data can be shared with external researchers after signature of a data transfer agreement (DTA). More information to initiate the request process can be found at https://www.proyectoinma.org/proyecto-inma/politica-de-colaboracion/ and https://www.projecthelix.eu/index.php/es/data-inventory.
Supplemental Material
Download Zip (3.2 MB)Acknowledgments
The authors would like to thank the team who collaborated on the initial design of the package on the European BioHackathon 2020: Lordstrong Akano, James Baye, Alejandro Caceres, Pavlo Hrab, Raquel Manzano and Margherita Mutarelli. The authors also want to thank the organization of European BioHackathon 2020 for its support. The authors acknowledge the contribution of all the HELIX children and their families.
Disclosure statement
LAPJ is a founding partner and scientific advisor of qGenomics Laboratory. All other authors declare no conflict of interests.
Supplementary material
Supplemental data for this article can be accessed online at https://doi.org/10.1080/15592294.2023.2230670
Additional information
Funding
References
- Melnikova I. Rare diseases and orphan drugs 2012 114 [Internet]. Nat Rev Drug Discov Nature Publishing Group. 2012 [cited 2022 Oct 4] ;11(4):267–24. Available from: https://www.nature.com/articles/nrd3654
- Nguengang Wakap S, Lambert DM, Olry A, et al. Estimating cumulative point prevalence of rare diseases: analysis of the Orphanet database. Eur J Hum Genet 2019 282 [Internet]. Nature Publishing Group. 2019 [cited 2022 Oct 4];28(2):165–173. Available from: https://www.nature.com/articles/s41431-019-0508-0
- Lionel AC, Costain G, Monfared N, et al. Improved diagnostic yield compared with targeted gene sequencing panels suggests a role for whole-genome sequencing as a first-tier genetic test. Genet Med [Internet]. Nature Publishing Group. 2018 [cited 2020 Nov 13];20(4):435–443. Available from. https://pubmed.ncbi.nlm.nih.gov/28771251/
- Garg P, Jadhav B, Rodriguez OL, et al. A Survey of Rare Epigenetic Variation in 23,116 Human Genomes Identifies Disease-Relevant Epivariations and CGG expansions. Am J Hum Genet Internet]. Cell Press. 2020 [cited 2020 Nov 2];107(4):654–669. Available from: https://pubmed.ncbi.nlm.nih.gov/32937144/
- Jaffe AE, Murakami P, Lee H, et al. Bump hunting to identify differentially methylated regions in epigenetic epidemiology studies. Int J Epidemiol. Internet. 2012 [cited 2014 Jul 11];41(1):200–209. doi: 10.1093/ije/dyr238
- Aref-Eshghi E, Bend EG, Colaiacovo S, et al. Diagnostic utility of genome-wide DNA methylation testing in genetically unsolved individuals with suspected hereditary conditions. Am J Hum Genet [Internet]. Cell Press. 2019 [cited 2020 Feb 11];104(4):685–700. Available from: https://linkinghub.elsevier.com/retrieve/pii/S0002929719301041
- Barbosa M, Joshi RS, Garg P, et al. Identification of rare de novo epigenetic variations in congenital disorders. Nat Commun Nat Pub Group. 2018;9(1). doi: 10.1038/s41467-018-04540-x
- Nikolaienko O, Lønning PE, Knappskog S, et al. Ramr: an R/Bioconductor package for detection of rare aberrantly methylated regions. Bioinformatics [Internet]. Oxford University Press. 2022 [[cited 2022 Oct 4]];38(1):133.doi: 10.1093/bioinformatics/btab586.
- Warne R. A primer on multivariate analysis of variance (MANOVA) for behavioral scientists. Pract Assessment, Res Eval [Internet]. 2019 [[cited 2022 Oct 4]];19:17. Available from: https://scholarworks.umass.edu/pare/vol19/iss1/17
- Aggarwal CC, Linear models for outlier detection. Outlier Anal [Internet]. Springer, Cham.2017 [[cited 2022 Oct 4]];65–110. Available from: https://link.springer.com/chapter/10.1007/978-3-319-47578-3_3
- Liu FT, Ting KM, Zhou ZH Isolation forest. Proc - IEEE Int Conf Data Mining, ICDM Pisa, Italy. 2008;413–422.
- Leys C, Klein O, Dominicy Y, et al. Detecting multivariate outliers: use a robust variant of the Mahalanobis distance. J Exp Soc Psychol Academic Press. 2018;74:150–156. doi: 10.1016/j.jesp.2017.09.011
- Carlson M, Maintainer BP TxDb.Hsapiens.UCSC.hg19.knownGene: annotation package for TxDb object(s). 2015.
- Dunham I, Kundaje A, Aldred SF, et al. An integrated encyclopedia of DNA elements in the human genome. Nature Internet. 2012 [[cited 2018 Feb 21]];489:57–74. Available from: https://pubmed.ncbi.nlm.nih.gov/22955616/
- Luo Y, Hitz BC, Gabdank I, et al. New developments on the Encyclopedia of DNA Elements (ENCODE) data portal. Nucleic Acids Res [Internet]. Nucleic Acids Res. 2020 [cited 2022 Oct 4];48(D1):D882–9. Available from: https://pubmed.ncbi.nlm.nih.gov/31713622/
- Durinck S, Spellman PT, Birney E, et al. Mapping identifiers for the integration of genomic datasets with the R/Bioconductor package biomaRt. Nat Protoc [Internet]. NIH Public Access. 2009 [cited 2018 Sep 25] ;4(8):1184–1191. Available from: http://www.ncbi.nlm.nih.gov/pubmed/19617889
- Durinck S, Moreau Y, Kasprzyk A, et al. BioMart and Bioconductor: a powerful link between biological databases and microarray data analysis. Bioinformatics. Internet. 2005 [cited 2018 Sep 25];21(16):3439–3440. doi: 10.1093/bioinformatics/bti525
- Gervin K, Salas LA, Bakulski KM, et al. Systematic evaluation and validation of reference and library selection methods for deconvolution of cord blood DNA methylation data. Clin Epigenetics [Internet]. Clin Epigenetics. 2019 [cited 2022 Oct 4];11(1). Available from: https://pubmed.ncbi.nlm.nih.gov/31455416/
- Shi L, Jiang F, Ouyang F, et al. DNA methylation markers in combination with skeletal and dental ages to improve age estimation in children. Forensic Sci Int Genet [Internet]. Forensic Sci Int Genet. 2018 [[cited 2022 Oct 4]];33:1–9. Available from: https://pubmed.ncbi.nlm.nih.gov/29172065/
- Butcher DT, Cytrynbaum C, Turinsky AL, et al. CHARGE and kabuki syndromes: gene-specific DNA methylation signatures identify epigenetic mechanisms linking these clinically overlapping conditions. Am J Hum Genet [Internet]. Am J Hum Genet. 2017 [cited 2022 Oct 4];100(5):773–788. Available from. https://pubmed.ncbi.nlm.nih.gov/28475860/
- Butcher LM, Beck S. Probe Lasso: a novel method to rope in differentially methylated regions with 450K DNA methylation data. Methods [Internet]. Elsevier Inc. 2015;72:21–28. doi: 10.1016/j.ymeth.2014.10.036
- Peters T, Buckley M, Statham A, et al. De Novo identification of differentially methylated regions in the human genome. Epigenet Chromatin [Internet]. 2015 [[cited 2015 Feb 10]];8:6. doi: 10.1186/1756-8935-8-6.
- Pedersen BS, Schwartz DA, Yang IV, et al. Comb-p: software for combining, analyzing, grouping and correcting spatially correlated P-values. Bioinformatics Internet. 2012 [[cited 2016 Nov 16]];28(22):2986–2988. Available from: http://bioinformatics.oxfordjournals.org/cgi/doi/10.1093/bioinformatics/bts545.
- Morris TJ, Butcher LM, Feber A, et al. ChAMP: 450k chip analysis methylation pipeline. Bioinformatics. Internet. 2014 [cited 2016 Nov 15];30(3):428–430. Available from: http://bioinformatics.oxfordjournals.org/cgi/doi/10.1093/bioinformatics/btt684
- Tian Y, Morris TJ, Webster AP, et al. ChAMP: updated methylation analysis pipeline for Illumina BeadChips. Bioinformatics [Internet]. Oxford Academic. 2017 [cited 2023 May 31];33(24):3982–3984. Available from: https://academic.oup.com/bioinformatics/article/33/24/3982/4082274
- Hannon E, Dempster EL, Mansell G, et al. DNA methylation meta-analysis reveals cellular alterations in psychosis and markers of treatment-resistant schizophrenia. Elife [Internet]. Elife. 2021 [cited 2022 Oct 4];10:1–53. Available from: https://pubmed.ncbi.nlm.nih.gov/33646943/
- Hannon E, Dempster E, Viana J, et al. An integrated genetic-epigenetic analysis of schizophrenia: evidence for co-localization of genetic associations and differential DNA methylation. Genome Biol [Internet]. Genome Biol Available from. 2016 [[cited 2022 Oct 4]];17. https://pubmed.ncbi.nlm.nih.gov/27572077/
- Guxens M, Ballester F, Espada M, et al. Cohort profile: the INMA—INfancia y medio ambiente—(environment and childhood) project. International Journal Of Epidemiology Internet. 2012 [cited 2015 Apr 27];41(4):930–940. Available from. http://ije.oxfordjournals.org/content/41/4/930.long
- Min JL, Hemani G, Davey Smith G, et al. Meffil: efficient normalization and analysis of very large DNA methylation datasets. In: Hancock J, editor. Bioinformatics. Internet. 2018 [cited 2019 Dec 30]; Available from. https://academic.oup.com/bioinformatics/advance-article/doi/10.1093/bioinformatics/bty476/5042224
- Zhou W, Laird PW, Shen H. Comprehensive characterization, annotation and innovative use of Infinium DNA methylation BeadChip probes. Vol. 45. Oxford Academic; 2017 [cited 2019 Dec 30]. Available from. https://academic.oup.com/nar/article-lookup/doi/10.1093/nar/gkw967
- Aryee MJ, Jaffe AE, Corrada-Bravo H, et al. Minfi: a flexible and comprehensive Bioconductor package for the analysis of Infinium DNA methylation microarrays. Bioinformatics. Internet. 2014 [cited 2015 Jan 9];30(10):1363–1369. Available from: http://bioinformatics.oxfordjournals.org/content/30/10/1363
- Fortin J-P, Labbe A, Lemire M, et al. Functional normalization of 450k methylation array data improves replication in large cancer studies. Genome Biol. [Internet]. BioMed Central Ltd. 2014 [cited 2015 Jan 19];15(11):503. Available from: http://genomebiology.com/2014/15/11/503
- Touleimat N, Tost J. Complete pipeline for infinium® human methylation 450K BeadChip data processing using subset quantile normalization for accurate DNA methylation estimation. Epigenomics [Internet]. Future Medicine Ltd London, UK. 2012 [cited 2022 Oct 4] ;4(3):325–341. Available from: https://www.futuremedicine.com/doi/10.2217/epi.12.21
- Triche TJ, Weisenberger DJ, Van Den Berg D, et al. Low-level processing of illumina infinium DNA methylation BeadArrays. Nucleic Acids Res. 2013;41(7):e90–e90. doi: 10.1093/nar/gkt090
- Maksimovic J, Gordon L, Oshlack AS. Subset-quantile within array normalization for illumina infinium HumanMethylation450 BeadChips. Genome Biol [Internet]. BioMed Central. 2012 [[cited 2022 Oct 4]];13(6):1–12. Available from: https://genomebiology.biomedcentral.com/articles/10.1186/gb-2012-13-6-r44.
- Teschendorff AE, Marabita F, Lechner M, et al. A beta-mixture quantile normalization method for correcting probe design bias in Illumina Infinium 450 k DNA methylation data. Bioinformatics. 2013;29(2):189–196. doi: 10.1093/bioinformatics/bts680
- Liu J, Siegmund KD. An evaluation of processing methods for HumanMethylation450 BeadChip data. BMC Genomics [Internet]. BMC Genomics. 2016 [[cited 2023 Apr 3]];17(1). Available from: https://pubmed.ncbi.nlm.nih.gov/27334613/
- Pidsley R, Wong CC Y, Volta M, et al. A data-driven approach to preprocessing Illumina 450K methylation array data. BMC Genomics Internet. 2013;14(1):293. Available from: http://www.biomedcentral.com/1471-2164/14/293%5Cnhttp://www.pubmedcentral.nih.gov/articlerender.fcgi?artid=3769145&tool=pmcentrez&rendertype=abstract
- Johnson WE, Li C, Rabinovic A. Adjusting batch effects in microarray expression data using empirical Bayes methods. Biostatistics Internet. 2007 [cited 2014 Jul 10];8:118–127. doi: 10.1093/biostatistics/kxj037.
- Lemonnier N, Melén E, Jiang Y, et al. A novel whole blood gene expression signature for asthma, dermatitis, and rhinitis multimorbidity in children and adolescents. Allergy [Internet]. Allergy. 2020 [cited 2023 Apr 3];75(12):3248–3260. Available from. https://pubmed.ncbi.nlm.nih.gov/32277847/
- Maitre L, De Bont J, Casas M, et al. Human Early Life Exposome (HELIX) study: a European population-based exposome cohort. BMJ Open [Internet]. BMJ Publishing Group. 2018 [cited 2020 Oct 30];8(9):e021311. Available from: https://pubmed.ncbi.nlm.nih.gov/30206078/
- Grazuleviciene R, Danileviciute A, Nadisauskiene R, et al. Maternal smoking, GSTM1 and GSTT1 polymorphism and susceptibility to adverse pregnancy outcomes. Int J Environ Res Public Health [Internet]. Int J Environ Res Public Health. 2009 [cited 2020 Oct 30] ;6(3):1282–1297. Available from: https://pubmed.ncbi.nlm.nih.gov/19440446/
- Ruiz-Arenas C, Hernandez-Ferrer C, Vives-Usano M, et al. Identification of autosomal cis expression quantitative trait methylation (cis eQtms) in children’s blood. Elife [Internet]. Elife. 2022 [[cited 2022 Oct 5]];11. https://pubmed.ncbi.nlm.nih.gov/35302492/
- van Iterson M, Tobi EW, Slieker RC, et al. MethylAid: visual and interactive quality control of large Illumina 450k data sets. Bioinformatics Internet. 2014 [cited 2015 Oct 7];30(23):3435–3437. Available from: http://www.ncbi.nlm.nih.gov/pubmed/25147358
- Buckberry S, Bent SJ, Bianco-Miotto T, et al. MassiR: a method for predicting the sex of samples in gene expression microarray datasets. Bioinformatics [Internet]. Oxford University Press. 2014 [cited 2020 Oct 30] ;30(14):2084–2085. https://pubmed.ncbi.nlm.nih.gov/24659105/
- Leek JT, Storey JD, Qiu X, et al. Capturing heterogeneity in gene expression studies by surrogate variable analysis. PLoS Genet Internet. 2007 [cited 2016 Dec 21] ;3(9):1724–1735. https://pubmed.ncbi.nlm.nih.gov/17907809/
- Ritchie ME, Phipson B, Wu D, et al. Limma powers differential expression analyses for RNA-sequencing and microarray studies. Nucleic Acids Res. Internet. 2015 [cited 2015 Jan 21];43(7):e47. doi: 10.1093/nar/gkv007
- Court F, Tayama C, Romanelli V, et al. Genome-wide parent-of-origin DNA methylation analysis reveals the intricacies of human imprinting and suggests a germline methylation-independent mechanism of establishment. Genome Res [Internet]. Genome Res. 2014 [cited 2023 Apr 3];24(4):554–569. Available from. https://pubmed.ncbi.nlm.nih.gov/24402520/
- Ventham NT, Kennedy NA, Adams AT, et al. Integrative epigenome-wide analysis demonstrates that DNA methylation may mediate genetic risk in inflammatory bowel disease. Nat Commun [Internet]. Nat Commun. 2016 [cited 2022 Oct 5];7(1). https://pubmed.ncbi.nlm.nih.gov/27886173/
- Homs A, Codina-Solà M, Rodríguez-Santiago B, et al. Genetic and epigenetic methylation defects and implication of the ERMN gene in autism spectrum disorders. Transl Psychiatry [Internet]. Transl Psychiatry. 2016 [cited 2022 Oct 5];6(7):e855–e855. Available from. https://pubmed.ncbi.nlm.nih.gov/27404287/
- RH M, N A, C CAM, et al. Epigenome-wide change and variation in DNA methylation in childhood: trajectories from birth to late adolescence. Hum Mol Genet. [Internet]. Hum Mol Genet. 2021 [cited 2021 Aug 26];30(1):119–134. Available from. https://pubmed.ncbi.nlm.nih.gov/33450751/
- Garg P, Sharp AJ. Screening for rare epigenetic variations in autism and schizophrenia. Hum Mutat [Internet]. John Wiley and Sons Inc. 2019 [[cited 2020 Mar 26]];40:humu.23740. doi: 10.1002/humu.23740
- Fortin JP, Triche TJ, Hansen KD, et al. Preprocessing, normalization and integration of the Illumina HumanMethylationEPIC array with minfi. Bioinformatics [Internet]. Oxford Academic. 2017 [cited 2022 Oct 5] ;33(4):558–560. https://academic.oup.com/bioinformatics/article/33/4/558/2666344
- McEwen LM, Jones MJ, Lin DTS, et al. Systematic evaluation of DNA methylation age estimation with common preprocessing methods and the Infinium MethylationEPIC BeadChip array. Clin Epigenetics. [Internet]. BioMed Central Ltd. 2018 [cited 2022 Oct 5];10(1):1–9. https://clinicalepigeneticsjournal.biomedcentral.com/articles/10.1186/s13148-018-0556-2
- Brechtmann F, Mertes C, Matusevičiūtė A, et al. OUTRIDER: a statistical method for detecting aberrantly expressed genes in RNA sequencing data. Am J Hum Genet. 2018;103(6):907–917. doi: 10.1016/j.ajhg.2018.10.025
- Solomon O, Huen K, Yousefi P, et al. Meta-analysis of epigenome-wide association studies in newborns and children show widespread sex differences in blood DNA methylation. Mutat Res [ Elsevier]. 2022;789:108415. doi: 10.1016/j.mrrev.2022.108415
- Richmond RC, Simpkin AJ, Woodward G, et al. Prenatal exposure to maternal smoking and offspring DNA methylation across the lifecourse: findings from the Avon Longitudinal Study of Parents and Children (ALSPAC). Hum Mol Genet. 2015 [cited 2022 Oct 5];24(8):2201–2217. [Internet]. Oxford Academic. https://academic.oup.com/hmg/article/24/8/2201/651979
- Zhang Y, Sirard MA. Epigenetic inheritance of acquired traits through DNA methylation. Anim Front [Internet]. Oxford Academic. 2021 [cited 2022 Oct 5] ;11(6):19–27. https://academic.oup.com/af/article/11/6/19/6469035
- Sun W, Dong H, Becker AS, et al. Cold-induced epigenetic programming of the sperm enhances brown adipose tissue activity in the offspring. Nat Med 2018 249 [Internet]. Nature Publishing Group. 2018 [cited 2022 Oct 5];24(9):1372–1383. Available from. https://www.nature.com/articles/s41591-018-0102-y
- Yehuda R, Daskalakis NP, Bierer LM, et al. Holocaust exposure induced intergenerational effects on FKBP5 methylation. Biol Psychiatry. [Internet]. Elsevier USA. 2016 [cited 2022 Oct 5];80(5):372–380. Available from. http://www.biologicalpsychiatryjournal.com/article/S0006322315006526/fulltext
- Serra-Juhé C, Cuscó I, Homs A, et al. DNA methylation abnormalities in congenital heart disease. Epigenetics. Internet. 2015 [cited 2020 Nov 13];10(2):167–177. doi: 10.1080/15592294.2014.998536
- Karczewski KJ, Francioli LC, Tiao G, et al. The mutational constraint spectrum quantified from variation in 141,456 humans. Nat 2020 5817809 [Internet]. Nature Publishing Group. 2020 [cited 2022 Sep 27];581(7809):434–443. Available from. https://www.nature.com/articles/s41586-020-2308-7
- MacDonald JR, Ziman R, Yuen RKC, et al. The database of genomic variants: a curated collection of structural variation in the human genome. Nucleic Acids Res [Internet]. Nucleic Acids Res. 2014 [cited 2022 Oct 5] ;42(D1):D986–D992. https://pubmed.ncbi.nlm.nih.gov/24174537/
- Landrum MJ, Chitipiralla S, Brown GR, et al. ClinVar: improvements to accessing data. Nucleic Acids Res. 2020 [cited 2022 Oct 5];48(D1):D835–44. [Internet]. Oxford Academic Available from. https://academic.oup.com/nar/article/48/D1/D835/5645007
- Abrahams BS, Arking DE, Campbell DB, et al. SFARI Gene 2.0: a community-driven knowledgebase for the autism spectrum disorders (ASDs). Mol Autism. [Internet]. BioMed Central. 2013 [cited 2022 Oct 5];4(1):1–3. https://molecularautism.biomedcentral.com/articles/10.1186/2040-2392-4-36
- Gusev FE, Reshetov DA, Mitchell AC, et al. Epigenetic-genetic chromatin footprinting identifies novel and subject-specific genes active in prefrontal cortex neurons. Faseb J. 2019 [cited 2022 Oct 5];33(7):8161–8173. [Internet]. FASEB J. https://pubmed.ncbi.nlm.nih.gov/30970224/
- Logue MW, Smith AK, Wolf EJ, et al. The correlation of methylation levels measured using Illumina 450K and EPIC BeadChips in blood samples. Epigenomics. [Internet]. Future Medicine Ltd. 2017 [cited 2022 Oct 5];9(11):1363–1371. https://www.futuremedicine.com/doi/10.2217/epi-2017-0078