
ABSTRACT
Abnormal DNA methylation has been observed in multiple malignancies, including melanoma. In this study, we initially noticed the overexpression of DNA methyltransferase 1 (DNMT1) in melanoma samples in bioinformatics analysis and, subsequently, validated it in the purchased melanoma cell lines. After treatment with short-hairpin RNAs or Decitabine (a DNA methylation inhibitor), silencing of DNMT1 was demonstrated to suppress cell viability and invasive and migratory potentials as well as to augment apoptosis and autophagy in melanoma cells. To further explore the downstream mechanisms, we revealed that DNMT1 inhibited HSPB8 expression through augmenting HSPB8 methylation, thereby suppressing the binding between HSPB8 and BAG3. Then, we elucidated through a series of gain- and loss- of function assays that the interplay of HSPB8 and BAG3 blocked the PI3K/AKT/mTOR pathway, thereby repressing the malignant phenotypes of melanoma cells and contributing to melanoma cell apoptosis and autophagy. We further established a mouse model of melanoma and substantiated that DNMT1 enhanced the in vivo tumorigenesis of melanoma cells via activation of the PI3K/AKT/mTOR pathway through repressing the binding between HSPB8 and BAG3. Taken together, our data supported that DNMT1 repressed the binding between HSPB8 and BAG3 and activated the PI3K/AKT/mTOR pathway, thus playing a tumour-promoting role in melanoma.
Introduction
Melanoma represents the deadliest and most aggressive skin cancer and, if not diagnosed at the early stage, can be alarmingly metastatic [Citation1]. In spite of improvements in investigations of the molecular mechanisms underlying melanoma and the development of novel curative strategies such as targeted therapy and immunotherapy [Citation2], clinical treatment for melanoma remains challenging due to the strong metastatic propensity and the resistance to traditional therapy, which are distinctive characteristics of this malignancy [Citation3]. In this sense, the discovery of novel molecules and regulatory patterns underlying the malignant phenotypes of melanoma is still of urgent need.
Aberrant DNA methylation has been observed in almost all forms of malignancies, and melanoma is no exception [Citation4,Citation5]. DNA methylation catalysed by DNA methyltransferases (DNMTs) has been recognized as one of the essential epigenetic mechanisms which confers a regulatory role in cell proliferation, differentiation, apoptosis, and also cell cycle [Citation6,Citation7]. Further, DNA methyltransferase 1 (DNMT1), a critical member of the DNMTs family, has recently been reported for affecting the clinical outcome of melanoma patients [Citation8], and suppression of DNMT1 has been associated with the indolence of brain metastatic melanoma cells [Citation9]. Nonetheless, the specific role of DNMT1 as well as downstream molecules in the malignant behaviours of melanoma cells remains largely unknown.
The small heat shock protein B8 (HSPB8) belongs to the small heat shock protein (HSP) superfamily of genes, and the promoter region of HSPB8 contains abundant CpG islands (i.e., short and dispersed regions of unmethylated DNA, characterized by a high frequency of CpG dinucleotides) [Citation10,Citation11]. H11/HSPB8 contributes to the growth arrest in human melanocytes [Citation12]. Intriguingly, it has been indicated that the level of HSPB8 DNA methylation served as an effective molecular marker for 5-Aza-2’-deoxycytidine therapy in melanoma [Citation13]. Moreover, HSPB8 interaction with Bcl2-associated athanogene 3 (BAG3) is a well-established complex to recruit and activate the macroautophagy targeting misfolded proteins [Citation14,Citation15] and BAG3 itself, as a co-chaperone of Hsp70/Hsc70, has been highlighted in the modulation of cell processes such as autophagy, apoptosis, and cell motility [Citation16,Citation17]. Furthermore, HSPB8 and BAG3 have been recognized as mediators of the phosphatidylinositol-3-kinase/AKT serine/threonine kinase 1 (PI3K/AKT) pathways [Citation18,Citation19], one of the hallmark pathways in melanoma [Citation20].
Based on the aforementioned evidence, we proposed a hypothesis in the present study that DNMT1 May contribute to the development of melanoma by activation of the PI3K/AKT/mTOR pathway through repressing the binding between HSPB8 and BAG3.
Materials and methods
Ethics statement
Animal experiments were approved by the Animal Care and Use Committee of The Third Affiliated Hospital of Southern Medical University and performed in accordance with Guide for the Care and Use of Laboratory Animals.
Cell culture and transfection
Human melanoma cell lines (A375, SK-MEL-1 and SK-MEL-28) and human normal melanocytes (PIG1 and HEMn-LP) were purchased from American type culture collection (ATCC, Manassas, VA). Human melanoma cell lines were incubated in DMEM and human normal melanocytes were incubated in M-254 basal medium (Invitrogen, Carlsbad, CA) supplemented with 1% human melanocyte growth supplement-2 (HMGS-2). Both media contained 10% FBS (Hyclone, Logan, UT), penicillin (100 U/mL) and streptomycin (100 U/mL, GIBCO, Gaithersburg, MD), and the incubation was performed at 37°C with 5% CO2. Upon cell confluence of 80%, cell passage (1:3) was performed.
Sequences for short hairpin RNA (shRNA) targeting DNMT1 (sh-DNMT: 5’-GGAACTTTGTCTCCTTCAAGC-3’) and HSPB8 (sh-HSPB8: 5’-GGATCCTGTGACAGTATTTGC-3’) were designed by BLOCK-iT™ RNAi Designer software, commercially synthesized, and inserted into the pLKO.1 puro plasmid. Constructed plasmids were then transformed into and propagated in E. coli. Meanwhile, full-length sequences of DNMT1 and BAG3 were amplified in vitro, subjected to double enzyme digestion, inserted into pCDNA3.1-3×flag-c plasmids, and then transformed into E. coli.
Subsequently, cells were classified and subjected to: transfection of plasmids carrying sh-DNMT1 alone or in combination with sh-HSPB8, or DNMT1 overexpression plasmids (oe-DNMT1); or treatment with Decitabine (DNA methylation inhibitor) and DMSO; or transfection with BAG3 overexpression plasmids (oe-BAG3) in combination with DMSO/740 YP (PI3K activator) treatment, or corresponding negative control (NC). Specifically, cells were seeded into a 6-well plate, and corresponding plasmids (4 μg) were transfected into cells following the protocols of Lipofectamine 3000 (L3000015, Thermo Fisher Scientific, San Jose, CA). After 48 h of incubation, transfected cells were treated with 5 μM Decitabine (ab120842, Abcam, Cambridge, UK) for 72 h or 50 μM 740 YP (Medchem Express, Monmouth Junction, NJ) for 24 h.
Reverse-transcription quantitative polymerase chain reaction (RT-qPCR)
Total RNA was extracted using Trizol reagent (Thermo Fisher Scientific) and then reversely transcribed into cDNA using the cDNA Synthesis Kit (Beyotime, Shanghai, China). Synthesized cDNA was subsequently subjected to RT-qPCR utilizing RT-qPCR kits (Q511–02, Vazyme Biotech, Nanjing, China) and CFX96 Real-Time PCR system (Bio-Rad, Hercules, CA), with GAPDH as an internal control. Further, the 2−ΔΔCt method was used for relative quantification. Primers were commercially designed (Sangon Biotech, Shanghai, China), as listed in Supplementary Table S1.
Western blot assay
Total protein was extracted using RIPA lysis (R0010, Solarbio, Beijing, China), followed by protein concentration measurement with BCA kits (GBCBIO Technologies, Guangzhou, China). Afterwards, the protein (40 µg for each sample) was separated by SDS-PAGE, electro-transferred to PVDF membrane, and blocked with 5% BSA. Subsequently, the immunoblots were probed with diluted primary antibodies against DNMT1 (1:1000, #5032, Cell Signaling Technology [CST], Beverly, MA), BAG3 (1:5000, ab92309, Abcam), HSPB8 (1:1000, #3059, CST), mTOR (1:1000, #2972, CST), p-mTOR (1:1000, #5536, CST), p70 S6 (1:1000, #9202, CST), p-p70 S6 (1:1000, #9234, CST), AKT (1:1000, #9272, CST), p-AKT (ser473) (1:1000, #4060, CST), LC3-II/I (1:200, #4180, CST), ATG-3 (1:1000, #3415, CST), ATG-5 (1 :1000, #2630, CST), ATG-7 (1:1000, #2631, CST), ATG-12 (1:1000, #4180, CST), Beclin (1:1000, #3738, CST) and GAPDH (1:2000, ZSGB-BIO, Beijing, China) overnight at 4°C, followed by 1-h incubation with goat anti-rabbit IgG secondary antibody (1:2000, ZSGB-BIO). Protein bands were then visualized utilizing ECL solution (Beyotime) and Bio-Rad gel imager, followed by quantification by the ImageJ analysis software (normalized to GAPDH).
Co-immunoprecipitation (Co-IP) assay
Cells were treated with 5 μM of DNMT1 inhibitor Decitabine (ab120842, Abcam) for 72 h [Citation21]. Subsequently, cells were incubated with pre-cooled IP lysis buffer (#87787, Thermo Fisher Scientific), followed by 30-min centrifugation (12000 g, 4°C) to collect the supernatant. Next, 300 μg of protein was incubated with 20 μL Protein A/G magnetic beads (sc-2003, Santa Cruz Biotechnology, Santa Cruz, CA) at 4°C for 1 h, followed by 5-min centrifugation (800 g, 4°C). Harvested supernatant was then incubated with 5 μg of antibody against HSPB8 or BAG3 at 4°C for 1 h and re-added with 20 μL of Protein A/G for overnight incubation at 4°C, followed by another 5-min centrifugation (800 g, 4°C) to collect the precipitate. Western blot analysis Was performed with IgG antibody (#14705, CST) as a NC, and 10% of the total protein was set as the Input.
Immunofluorescence
Cells were then fixed with 4% paraformaldehyde and treated with 0.1% Triton X-100, followed by blocking with 5% goat serum. After that, cells were incubated with antibodies including rabbit anti-HSPB8 (1:100, ab151552, Abcam) and goat anti-BAG3 (1:500, ab112016, Abcam) at 4°C overnight. Cells were further incubated at room temperature for 1 h with anti-rabbit secondary antibodies: Dylight 488-goat (1:200, A23220, Abbkine, Wuhan, China) and Dylight 594-rabbit (1:200, A23430, Abbkine). Images were observed under a laser confocal microscope, and the co-localization of BAG3 and HSPB8 was analysed by ImageJ software.
Transwell and cell counting kit 8 (CCK-8) assays
For the Transwell migration assay, cell suspension (2 × 10⁵ cells/mL) was added to the upper insert of Transwell system, while 700 μL of pre-chilled DMEM (containing 10% FBS) was added to the lower insert. The system was incubated with 5% CO2 at 37°C for 24 h. The migrated cells were stained in 0.1% crystal violet and observed under an inverted microscope. The Transwell invasion assay was performed with upper insert precoated with matrigel (BD Biosciences). This assay was then conducted following the same procedures as the migration assay [Citation22].
CCK-8 assay was performed to detect the viability of cells [Citation23]. Cells (5 × 10³) seeded in 96-well plates were cultured for 24 h, followed by addition of 10 μL of CCK-8 solution (Beyotime) to each well. The absorbance was measured at 450 nm under microplate reader (Thermo Fisher Scientific, Waltham, MA).
Methylation-specific PCR (MSP)
Genomic DNA was isolated from cell samples using the Wizard Genomic DNA (gDNA) Purification Kit (Promega, Madison). Sulfurous acid modification of 5 µg gDNA was performed with CpGenome Fast DNA Modification Kit (Chemicon, New York, NY). MSP analysis was performed using methylation-specific primers. Primers for the methylated promoter of HSPB8 (HSPB8-M) were: forward/reverse: 5’-AATCGTTTGAATTTGGAAGGC-3’/5’-CAATATCGAAAATAATCAAAAATCG-3'; primers for the unmethylated promoter of HSPB8 (HSPB8-U) were: forward/reverse: 5’-AAGAATTGTTTGAATTTGGAAGGT-3’/5’-CAAATATCAAAAATAATCAAAAATCAAAAA-3’. MSP products were verified by 2% agarose gel electrophoresis.
Methylated DNA immunoprecipitation (MeDIP)
Melanoma cells were washed with pre-cooled PBS and treated with the EasyPure gDNA Kit (EE101–01, TransGen Biotech, Beijing, China) to extract gDNA. The gDNA sample was then subjected to ultrasound treatment to obtain fragments (approximately 300 ~ 1000 bp in length). Next, 20 μg of denatured gDNA fragment and 50 μL of protein G magnetic beads (sc-2002, Santa Cruz Biotechnology) were incubated at 4°C for 1 h, and the supernatant was collected by centrifugation, followed by incubation overnight with 5’-methylcytosine antibody (ab10805, Abcam) and IgG antibody (#14705, CST), respectively. After that, 50 μL of protein G magnetic beads was re-added for 3-h incubation and washed with 1× IP buffer, followed by 2-h incubation with proteinase K at 58°C. Afterwards, a DNA extraction kit was utilized to purify the enriched DNA fragments. The methylation enrichment was analysed through normalization to 10% untreated gDNA or IgG immunoprecipitation. MSP was subsequently performed to measure the efficiency of DNA methylation [Citation24]. Primers involved are listed in Supplementary Table S2.
Autophagy assay
For autophagy detection, 103 melanoma cells were seeded on 6-well plates containing coverslips, and the cells were incubated with 2 μg BAG3 overexpression plasmids or 50 μM PI3K agonist (740 Y-P, MedChem Express) for 24 h, followed by 10-min fixation with 4% paraformaldehyde. The cells were then incubated with 0.2% Triton X-100 for 15 min and blocked with 5% BSA at room temperature for 1 h. After PBS washing, the cells were incubated with LC3 primary antibody (1:200, #4180, CST) at 4°C overnight, followed by 1-h incubation with fluorescein isothiocyanate-labelled goat anti-rabbit IgG secondary antibody (FITC, 1:200, ZSGB-BIO) at room temperature. After that, the cells were observed under a laser confocal microscope with 10 fields of view randomly selected for cell counting.
Flow cytometry
The cells were treated with 0.5 mL of 0.25% trypsin, and re-suspended with previously collected medium to reach a density of approximately 1 × 10⁶ cells/mL. Then, cell suspension was resuspended with 0.5 mL of pre-cooled 1× binding buffer, and stained with 5 μL Annexin V-FITC and 10 μL propidium iodide (PI), followed by 15-min incubation in the dark. Next, the cells were subjected to analysis on a flow cytometer (FACS Verse/Calibur/AriaIISORP, BD Biosciences, Bedford, MA). All the reagents were purchased from Beyotime Biotech (Shanghai, China).
Establishment of a melanoma mouse model
A total of 18 6-week-old BALB/C nude mice (weighing 18–25 g) were purchased from Vital River Laboratory Animal Technology Co., Ltd. (Beijing, China) and housed in specific pathogen-free (SPF) environment. The mice were randomly grouped (n = 6) and subjected to inoculation of melanoma cells (5 × 10³ cells per mouse) previously transduced with sh-NC, sh-DNMT1 + sh-NC, or sh-DNMT1 + sh-HSPB8. From day 1 to day 40 after the inoculation, the volume of xenografted tumour was measured every 5 days. After that, the mice were euthanized with carbon dioxide asphyxiation. The volume of xenografted tumour was calculated according to the formula: V = (A × B2)/2 (A: long diameter; B: short diameter).
Statistical analysis
Data were processed by SPSS 21.0 software (IBM Corp., Armonk, NY), with p < 0.05 as a level of statistical significance. Measurement data werecharacterized as mean ± standard deviation (SD). Comparison between data of two groups was performed by independent sample t test, and that among multiple groups was performed with one-way analysis of variance (ANOVA) with Tukey’s post-hoc test. Comparison among data at different time points was performed using repeated measures ANOVA with Tukey’s post-hoc test.
Results
DNMT1 is highly expressed in melanoma tissues and enhances the malignant phenotypes of melanoma cells
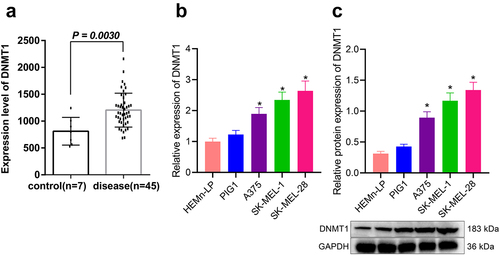
Bioinformatics analysis based on the melanoma-related microarray dataset GSE3189 indicated that the expression of DNMT1 was significantly up-regulated in melanoma tissue (p = 0.003) as compared with normal skin tissues (). Meanwhile, we determined the expression of DNMT1 in three kinds of human melanoma cell lines (A375, SK-MEL-1 and SK-MEL-28) and two kinds of human normal melanocytes (PIG1 and HEMn-LP). According to the results, DNMT1 protein and mRNA expression was up-regulated in melanoma cells, among which SK-MEL-28 cells presented with the highest level of DNMT1 (p < 0.05) (). Herein, the SK-MEL-28 cell line was selected for subsequent experiments.
Figure 1. Expression of DNMT1 in melanoma. a: Screening of differentially expressed genes in human melanoma and normal skin tissue samples in melanoma-related microarray dataset GSE3189; b: RT-qPCR measurement of DNMT1 mRNA expression in three melanoma cell lines (A375, SK-MEL-1 and SK-MEL-28) and two human normal melanocytes (PIG1 and HEMn-LP) cell lines; c: Western blot analysis of DNMT1 protein expression in three melanoma cell lines (A375, SK-MEL-1 and SK-MEL-28) and two human normal melanocytes (PIG1 and HEMn-LP) cell lines. Measurement data were characterized as mean ± SD. The comparison between data of two groups was performed by independent sample t test, and that among multiple groups was performed utilizing one-way ANOVA with Tukey’s post-hoc test. All experiments were repeated three times. *p < 0.05 versus the Normal/Control group or HEMn-LP cells.
DNMT1 promotes malignant phenotypes of melanoma cells while inhibiting cell apoptosis and autophagy
To further explore the role of DNMT1 overexpression in melanoma, we treated SK-MEL-28 cells with sh-DNMT1, DNMT1 inhibitor Decitabine, or oe-DNMT1. It was validated by Western blot that either sh-DNMT1 or DNMT1 inhibitor led to down-regulated expression of DNMT1 while oe-DNMT1 treatment led to the opposite (p < 0.05) (). Following that, results of CCK-8 and Transwell assays demonstrated that the viability, invasion and migration of the cells were attenuated in response to DNMT1 knockdown and augmented in response to DNMT1 overexpression (p < 0.05) (). Flow cytometry analysis then indicated that silencing DNMT1 stimulated the apoptosis of the cells, and DNMT1 overexpression repressed it (p < 0.05) ().
Figure 2. DNMT1 is overexpressed in melanoma and affects the malignant phenotypes of melanoma cells. a: Western blot analysis of DNMT1 protein expression in SK-MEL-28 cells treated with sh-DNMT1, oe-DNMT1, or Decitabine; b: CCK-8 assay to detect SK-MEL-28 cell viability in response to the knockdown/overexpression of DNMT1; c: Transwell assay to detect the migration and invasion of SK-MEL-28 cells in response to the knockdown/overexpression of DNMT1; d: Flow cytometry to detect the apoptosis of SK-MEL-28 cells in response to the knockdown/overexpression of DNMT1; e: Immunofluorescence staining to detect the formation of autophagic flux in SK-MEL-28 cells in response to the knockdown/overexpression of DNMT1 (blue: DAPI; red: HSPB8); f: Western blot measurement of the expression of autophagy-related proteins (Beclin, ATG-3-12 and LC3-II/I) in response to the knockdown/overexpression of DNMT1. Measurement data were characterized as mean ± SD. The comparison between data of two groups was performed by independent sample t test, and that among multiple groups was performed utilizing one-way ANOVA with Tukey’s post-hoc test. Comparison among data at different time points was performed using repeated measures ANOVA with Tukey’s post-hoc test. All experiments were repeated three times. *p < 0.05 versus the sh-NC group. #p < 0.05 versus the oe-NC group. & p < 0.05 versus the DMSO group.
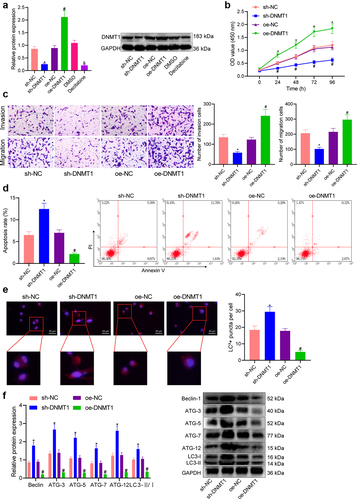
Furthermore, the autophagic flux was detected by immunofluorescence staining. Of note, autophagy is a dynamic process, and the entire process of autophagosome formation, transport of autophagic substrates to lysosomes, and degradation in lysosomes is called autophagic flux [Citation25]. Our results indicated that the autophagic flux in the cells was enhanced in the presence of DNMT1 knockdown and reduced following DNMT1 overexpression (p < 0.05) (). Consistently, the expression of autophagy-related proteins (Beclin, ATGs, and LC3) was shown to be up-regulated in response to DNMT1 silencing and down-regulated in response to DNMT1 overexpression (p < 0.05) (). Collectively, these results suggested that DNMT1 overexpression occurred in melanoma cells. It was responsible for augmented viability and invasive and migratory potentials as well as repressed apoptosis and autophagy of melanoma cells.
DNMT1 inhibits HSPB8 expression through methylation, thereby attenuating the binding of HSPB8 to BAG3
Recent data have suggested that HSPB8 is a potential molecular marker for demethylation in melanoma, serving as a promising therapeutic target [Citation12,Citation13]). To further examine whether DNMT1 affects the interaction between HSPB8 and BAG3, we utilized the Methprimer software to explore the presence of CpG islands on the HSPB8 promoter. As shown in , a CpG island was detected near −1000 bp upstream of the promoter, and the GC content exceeded 50%. Moreover, results of the MeDIP assay unravelled an increased level of HSPB8 methylation in melanoma cells (p < 0.05) ().
Figure 3. DNMT1 affects the binding of HSPB8 and BAG3 through modulating HSPB8 methylation. a: Methprimer software analysis of the degree of methylation near − 1000 bp upstream the promoter of HSPB8; b: MeDIP measurement of the degree HSPB8 methylation in three melanoma cell lines (A375, SK-MEL-1 and SK-MEL-28) and two human normal melanocytes (PIG1 and HEMn-LP) cell lines; c: Western blot analysis of HSPB8 protein expression in three melanoma cell lines (A375, SK-MEL-1 and SK-MEL-28) and two human normal melanocytes (PIG1 and HEMn-LP) cell lines; d: MeDIP measurement of the degree of HSPB8 methylation in Decitabine-treated SK-MEL-28 cells; e: Western blot measurement of HSPB8 protein expression in Decitabine- or sh-DNMT1-treated SK-MEL-28 cells; f: Immunofluorescence staining to detect the co-localization of HSPB8 and BAG3 in SK-MEL-28 cells (blue: DAPI; red: HSPB8); g: Co-IP detection of the binding of HSPB8 and BAG3 (IgG as a negative control; Input represented 10% total protein). h: Methylation status of HSPB8 promoter detected in SK-MEL-28 cells (M: methylation-specific primer amplification; U: unmethylation-specific primer amplification). All experiments were repeated three times. Measurement data were characterized as mean ± SD. The comparison between data of two groups was performed by independent sample t test, and that among multiple groups was performed utilizing one-way ANOVA with Tukey’s post-hoc test. *p < 0.05 versus the Normal group, HEMn-LP cells, or DMSO group. #p < 0.05 versus the sh-NC group.
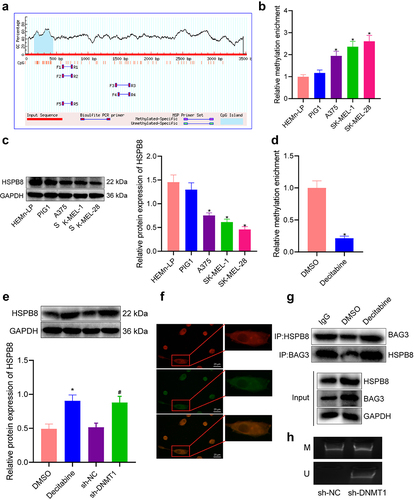
Subsequently, HSPB8 protein expression was identified, which was reduced in three human melanoma cell lines (A375, SK-MEL-1, and SK-MEL-28), especially in SK-MEL-28 cells, relative to human normal melanocytes (p < 0.05) (). Then, we treated SK-MEL-28 cells with DNMT1 inhibitor Decitabine, which was observed to repress the methylation in the HSPB8 promoter region (p < 0.05) (). Meanwhile, Decitabine or sh-DNMT1 led to increased expression of HSPB8 in the cells (p < 0.05) (). Further, a co-localization of HSPB8 and BAG3 was identified by immuno-dual fluorescence (). Co-IP results then showed that HSPB8 antibody enriched BAG3 protein and BAG3 antibody enriched HSPB8 protein in SK-MEL-28 cells treated with Decitabine (). MSP analysis revealed that sh-DNMT1 was associated with DNA demethylation in SK-MEL-28 cells (). Taken together, our results indicated that DNMT1 inhibited HSPB8 expression through augmenting HSPB8 methylation, thereby suppressing the binding between HSPB8 and BAG3.
DNMT1 augments malignant phenotypes and represses autophagy and apoptosis in melanoma cells through suppressing the interaction between HSPB8 and BAG3
It has been reported that HSPB8 can bind to BAG3 to promote autophagy and apoptosis of tumour cells [Citation10,Citation11,Citation26], so it is speculated that HSPB8 May function through BAG3. To explore whether DNMT1 functioned by affecting BAG3 through HSPB8, we then explored the effects of this mechanism on SK-MEL-28 cell bioactivities. First, we constructed sh-DNMT1 and sh-HSPB8 vectors and validated through Western blot analysis that sh-DNMT1 treatment augmented the mutual binding of HSPB8 and BAG3 while sh-HSPB8 treatment restricted it (p < 0.05) (). Results of the CCK-8 and Transwell assays then indicated that simultaneous knockdown of DNMT1 and HSPB8 could reverse the inhibitory effect of DNMT1 knockdown alone on cell viability, invasion, and migration (p < 0.05) ().
Figure 4. Knockdown of DNMT1/HSPB8 affects the viability, migration, invasion, apoptosis, and autophagy of melanoma cells. a: Western blot measurement of the protein expression of DNMT1, HSPB8 and BAG3 in SK-MEL-28 cells upon treatment with sh-DNMT1 alone or in combination with sh-HSPB8; b: CCK-8 assay to detect the viability of SK-MEL-28 cells upon treatment with sh-DNMT1 alone or in combination with sh-HSPB8; c: Transwell assay to detect the migration and invasion of SK-MEL-28 cells upon treatment with sh-DNMT1 alone or in combination with sh-HSPB8; d: Flow cytometry to detect the apoptosis of SK-MEL-28 cells upon treatment with sh-DNMT1 alone or in combination with sh-HSPB8; e: Immunofluorescence staining to observe the formation of autophagic flux in SK-MEL-28 cells upon treatment with sh-DNMT1 alone or in combination with sh-HSPB8; f: Western blot measurement of the expression of autophagy-related proteins (Beclin, ATG-3-12 and LC3-II/I) in SK-MEL-28 cells upon treatment with sh-DNMT1 alone or in combination with sh-HSPB8. Measurement data were characterized as mean ± SD. The comparison between data of two groups was performed by independent sample t test, and that among multiple groups was performed utilizing one-way ANOVA with Tukey’s post-hoc test. Comparison among data at different time points was performed using repeated measures ANOVA with Tukey’s post-hoc test. All experiments were repeated three times. *p < 0.05 versus the sh-NC + sh-NC group. #p < 0.05 versus the sh-DNMT1 + sh-NC group.
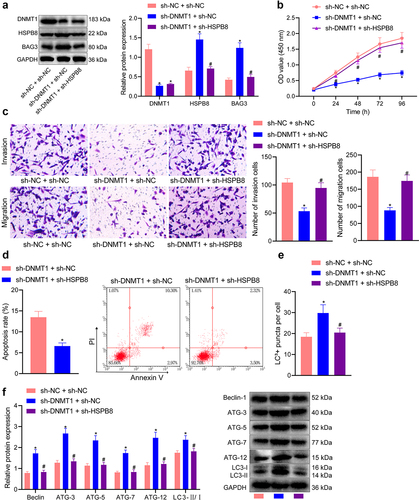
Additionally, we demonstrated through flow cytometry that sh-DNMT1-treated cells presented with increased apoptotic potential, which was then diminished when the cells were treated with sh-DNMT1+ sh-HSPB8 (p < 0.05) (). Immunofluorescence staining results further revealed an increase in the formation of autophagic flux in response to silencing DNMT1 alone, consistent with the elevated expression of autophagy-related proteins (p < 0.05) shown by Western blot analysis. While additional silencing of HSPB8 reversed the effects of DNMT1 silencing alone (p < 0.05) (). Herein, our results collectively pointed out that DNMT1 enhanced the viability as well as migratory and invasive abilities of melanoma cells and attenuated their apoptosis and autophagy, which was attributed to the suppression of HSPB8 expression by DNMT1-mediated methylation.
HSPB8 binds to BAG3 to block the activation of the PI3K/AKT/mTOR pathway, thus repressing malignant phenotypes of melanoma cells
Accumulating studies have suggested that abnormal cellular autophagy is an important mechanism of tumorigenesis [Citation27], and that the PI3K/Akt/mTOR pathway is a critical regulatory pathway of cell autophagy [Citation28], pointing to possible association between cell autophagy in melanoma and this pathway [Citation29,Citation30]. In addition, it has been shown that BAG3 can be targeted for cancer through the PI3K/Akt/mTOR pathway [Citation31]. Therefore, we then explored the effects of the activation of the PI3K/AKT/mTOR pathway mediated by HSPB8 and BAG3 on melanoma cell phenotypes.
We first determined the expression of proteins related to this pathway in melanoma cell lines (A375, SK-MEL-1 and SK-MEL-28) and normal melanocytes (PIG1 and HEMn-LP). The results displayed that the PI3K/AKT/mTOR pathway was activated in the three kinds of melanoma cells, among which SK-MEL-28 cells exhibited the most significant activation () and was thus selected for subsequent experiments. Next, we treated the cells with oe-BAG3, and BAG3 overexpression was shown to lead to reduced phosphorylation of mTOR, p70S6 and AKT (ser473), and this inhibitory effect could be abrogated by simultaneous administration of PI3K agonists (p < 0.05) ().
Figure 5. Overexpression of BAG3 regulates the PI3K/AKT/mTOR pathway to affect the bioactivities of melanoma cells. a: Western blot measurement of phosphorylation of mTOR (Ser2448), p70S6 (ser389) and AKT (ser473) in three melanoma cell lines (A375, SK-MEL-1 and SK-MEL-28) and two human normal melanocytes (PIG1 and HEMn-LP) cell lines; b: Western blot measurement of the phosphorylation of mTOR, p70S6, and AKT (ser473) in SK-MEL-28 cells in response to BAG3 overexpression alone or in combination with PI3K activator; c: CCK-8 detection of SK-MEL-28 cell viability in SK-MEL-28 cells in response to BAG3 overexpression alone or in combination with PI3K activator; d: Transwell assay to detect the migration and invasion of SK-MEL-28 cells in response to BAG3 overexpression alone or in combination with PI3K activator; e: Flow cytometry to detect the apoptosis of SK-MEL-28 cells in response to BAG3 overexpression alone or in combination with PI3K activator; f: Immunofluorescence staining to detect the formation of autophagic flux in SK-MEL-28 cells in response to BAG3 overexpression alone or in combination with PI3K activator; g: Western blot measurement of autophagy-related proteins in SK-MEL-28 cells in response to BAG3 overexpression alone or in combination with PI3K activator. Measurement data were characterized as mean ± SD. The comparison between data of two groups was performed by independent sample t test, and that among multiple groups was performed utilizing one-way ANOVA with Tukey’s post-hoc test. Comparison among data at different time points was performed using repeated measures ANOVA with Tukey’s post-hoc test. All experiments were repeated three times. *p < 0.05 versus the HEMn-LP cells or the oe-NC + DMSO group. #p < 0.05 versus the oe-BAG3 + DMSO group.
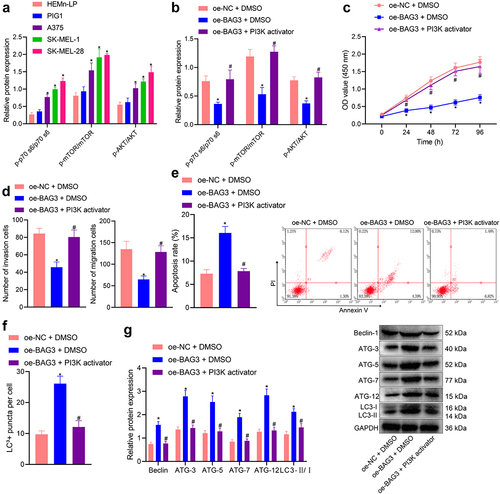
Furthermore, according to the results of CCK-8 and Transwell assays, flow cytometry and immunofluorescence staining (), BAG3 overexpression led to diminished viability, migration, and invasion as well as augmented apoptosis and autophagy in SK-MEL-28 cells, and these effects were reversed when BAG3 overexpression was combined with PI3K agonist (p < 0.05). In summary, these results suggested that the interplay of HSPB8 and BAG3 blocked activation of the PI3K/AKT/mTOR pathway, thereby repressing the malignant phenotypes of melanoma cells and contributing to melanoma cell apoptosis and autophagy.
DNMT1 accelerates the tumorigenesis of melanoma in vivo by activating the PI3K/AKT/mTOR pathway through inhibition of HSPB8 binding to BAG3
Based on obtaining the aforementioned in vitro findings, we then moved to in vivo substantiation. We treated the mice with sh-DNMT1 and sh-HSPB8 and conducted Western blot analysis on melanoma tissues. According to the results (), knocking down DNMT1 in vivo resulted in an increase in the expression of HSPB8 and BAG3, while additional HSPB8 silencing reversed the increase (p < 0.05). DNMT1 knockdown alone inhibited the PI3K/AKT/mTOR pathway, while its combination with HSPB8 knockdown negated the inhibiting effect, as reflected by increased phosphorylation of mTOR, p70S6 and AKT (ser473) (p < 0.05).
Figure 6. Knocking down DNMT1/HSPB8 affects the tumorigenesis of melanoma cells in nude mice. a: Western blot measurement of the phosphorylation of mTOR, p70S6 and AKT (ser473) in melanoma tumour tissues of nude mice treated with sh-DNMT1 alone or in combination with sh-HSPB8; b: Images of tumour xenografts in nude mice inoculated with SK-MEL-28 cells treated with sh-DNMT1 alone or in combination with sh-HSPB8; c: Weight of tumour xenografts in nude mice inoculated with SK-MEL-28 cells treated with sh-DNMT1 alone or in combination with sh-HSPB8; d: Growth curve of tumour xenografts in nude mice inoculated with SK-MEL-28 cells treated with sh-DNMT1 alone or in combination with sh-HSPB8; e: Western blot measurement of autophagy-related proteins (Beclin, ATG-3-12, and LC3-II/I) in melanoma tumour tissues of nude mice inoculated with SK-MEL-28 cells treated with sh-DNMT1 alone or in combination with sh-HSPB8. n = 6. Measurement data were characterized as mean ± SD. The comparison between data of two groups was performed by independent sample t test, and that among multiple groups was performed utilizing one-way ANOVA with Tukey’s post-hoc test. Comparison among data at different time points was performed using repeated measures ANOVA with Tukey’s post-hoc test. *p < 0.05 versus the sh-NC + sh-NC group. #p < 0.05 versus the DNMT1 + sh-NC group.
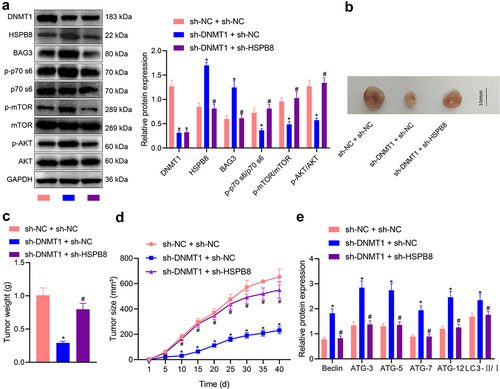
We then inoculated the mice with SK-MEL-28 cells treated with sh-DNMT1 alone or in combination with sh-HSPB8. The size of the tumour xenograft was observed to be reduced in the presence of DNMT1 silencing alone (p < 0.05) and increased when DNMT1 and HSPB8 were both silenced (p < 0.05) (). Measurement of tumour weight also confirmed the anti-tumour effects of sh-DNMT1 treatment alone, which was abrogated by additional sh-HSPB8 treatment (p < 0.05) (), and these results were consistent with the growth curve of the xenografted tumours for 40 days (p < 0.05) (). Furthermore, we determined the expression of autophagy-related proteins in tumour tissues of mice of three groups, and the results () revealed that additional HSPB8 knockdown suppressed the activation of these proteins that was induced by DNMT1 knockdown alone (p < 0.05). Taken together, our results demonstrated that DNMT1 enhanced the tumorigenesis of melanoma cells in nude mice via activation of the PI3K/AKT/mTOR pathway through repressing the binding between HSPB8 and BAG3.
Discussion
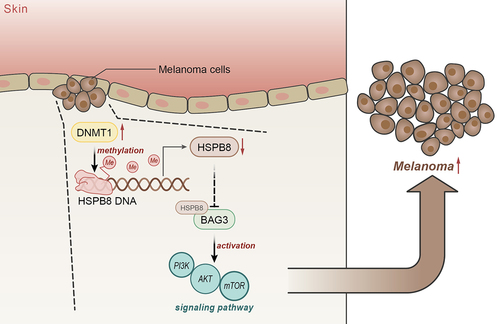
With an aim to discover novel therapeutic targets for melanoma, we elucidated in this study a new mechanism by which DNMT1 enhanced the malignant phenotypes of melanoma cells by activation of the PI3K/AKT/mTOR pathway through repressing the binding between HSPB8 and BAG3 ().
Figure 7. The mechanism graph of the regulatory network and function of DNMT1 in melanoma. DNMT1 enhances the malignant behaviours of melanoma cells and inhibits melanoma cell apoptosis and autophagy via the activation of the PI3K/AKT/mTOR pathway through repressing the binding between HSPB8 and BAG3.
Our finding of the overexpression of DNMT1 in melanoma tissues in bioinformatics analysis indicated a potential regulatory role of DNMT1 in melanoma. Moreover, our data validated the up-regulated expression of DNMT1 in melanoma cells. These findings corroborate a number of previous studies on the involvement of aberrant DNA methylation and highly expressed DNMT1 in the pathogenesis of melanoma [Citation5,Citation32,Citation33]. Further, our data revealed that silencing DNMT1 led to repressed viability and invasive and migratory potentials as well as augmented apoptosis and autophagy in melanoma cells. In relation to this, DNMT1 inhibitors have been reported to stimulate re-expression of tumour suppressor genes, such as Hexamethylene bisacetamide (HMBA) Induced Protein 1 (HEXIM1), through erasing methylation marks from their promoters [Citation34]. Decitabine, a DNMT inhibitor, is now in standard clinical use for the treatment of acute myeloid leukaemia and has been suggested for efficacy against a series of malignancies [Citation35–37].
To further explore the underlying mechanisms of DNMT1 in melanoma, our data demonstrated that DNMT1 inhibited the expression of the heat-shock protein HSPB8 through augmenting HSPB8 DNA methylation, thereby suppressing the binding between HSPB8 and BAG3. Interestingly, a prior study indicated that H11, another heat-shock protein, was silenced by aberrant DNA methylation in melanoma relative to naevi or normal skin tissues [Citation38]. More importantly, the overload of HSPB8 has been reported to stimulate melanoma cell apoptosis through activation of transforming growth factor-beta-activated kinase 1 [Citation11] and to stimulate melanoma oncolysis through mechanisms related with autophagy and pyroptosis [Citation12,Citation39]. In agreement with these reports, this study illuminated through a series of gain- and loss- of function assays that DNMT1 enhanced the viability as well as migratory and invasive abilities of melanoma cells and attenuated their apoptosis and autophagy, which was attributed to the suppression of HSPB8 expression by DNMT1-mediated methylation.
Furthermore, our results unravelled that the binding of HSPB8 and BAG3 blocked the PI3K/AKT/mTOR pathway, thereby repressing the malignant phenotypes of melanoma cells and enhancing melanoma cell apoptosis and autophagy. With a critical role to play in protein quality control, the HSPB8-BAG3 complex can recruit and activate the macroautophagy targeting misfolded proteins [Citation14,Citation15,Citation40], whereas its implication in melanoma has rarely been reported before. In contrast, the PI3K/AKT/mTOR pathway has been widely documented for their tumour-initiating role in melanoma [Citation41–43]. Consistent with our findings, accumulating evidence supports that inhibiting the PI3K/AKT/mTOR pathway could lead to augmented melanoma cell apoptosis and autophagy, accounting for the anti-melanoma effects of several chemicals including Resveratrol, Polyphyllin I, and Neogambogic acid [Citation44–46]. Based on the in vitro results, our in vivo experiments then substantiated that DNMT1 enhanced the tumorigenesis of melanoma cells in nude mice via activation of the PI3K/AKT/mTOR pathway through repressing the binding between HSPB8 and BAG3. The activation of PI3K could augment DNMT1 stability while maintaining DNA methylation and chromatin structure, thereby possibly resulting in cancer cell growth; DNMT1 overexpression could reverse the suppression of cancer cell growth caused by PI3K inhibition [Citation47]. Moreover, DNMT1 could enhance MEG3 promoter methylation to activate the PI3K/AKT/mTOR pathway in diabetic retinopathy [Citation48]. These previous studies indicate the underlying interaction between PI3K and DNMT. Similarly, our study found that DNMT1 could activate the PI3K/AKT/mTOR axis to stimulate the development of melanoma.
Accordingly, it can be concluded that DNMT1 represses the binding between HSPB8 and BAG3 and activates the PI3K/AKT/mTOR pathway, thereby enhancing the malignant behaviours of melanoma cells in vitro and stimulates the tumorigenesis of melanoma cells in vivo. By elucidating the mechanism underlying the tumour-supporting role of DNMT1 in melanoma, our study deepens the understanding of the carcinogenesis of melanoma and sheds light on the promising application of DNMT inhibitors as novel therapeutic reagents for melanoma. However, the upstream regulation mechanism still remains to be explored in the future research.
Ethics approval
Animal experiments were approved by the Animal Care and Use Committee of The Third Affiliated Hospital of Southern Medical University and performed in accordance with Guide for the Care and Use of Laboratory Animals.
Consent for publication
Not applicable.
Supplemental Material
Download MS Word (22.4 KB)Disclosure statement
The data that supports the findings of this study are available on request from the corresponding author.
Supplementary material
Supplemental data for this article can be accessed online at https://doi.org/10.1080/15592294.2023.2239607.
Additional information
Funding
References
- Di Leo L, Bodemeyer V, Bosisio FM, et al. Loss of Ambra1 promotes melanoma growth and invasion. Nat Commun. 2021;12(1):2550. doi: 10.1038/s41467-021-22772-2
- Luke JJ, Flaherty KT, Ribas A, et al. Targeted agents and immunotherapies: optimizing outcomes in melanoma. Nat Rev Clin Oncol. 2017;14(8):463–16. doi: 10.1038/nrclinonc.2017.43
- Eggermont AM, Spatz A, Robert C. Cutaneous melanoma. Lancet. 2014;383(9919):816–827. doi: 10.1016/S0140-6736(13)60802-8
- Klutstein M, Nejman D, Greenfield R, et al. DNA methylation in cancer and aging. Cancer Res. 2016;76(12):3446–3450. doi: 10.1158/0008-5472.CAN-15-3278
- Micevic G, Theodosakis N, Bosenberg M. Aberrant DNA methylation in melanoma: biomarker and therapeutic opportunities. Clin Epigenetics. 2017;9(34). doi: 10.1186/s13148-017-0332-8
- Karlow JA, Miao B, Xing X, et al. Common DNA methylation dynamics in endometriod adenocarcinoma and glioblastoma suggest universal epigenomic alterations in tumorigenesis. Commun Biol. 2021;4(1):607. doi: 10.1038/s42003-021-02094-1
- Tan YL, Chen H, Wu ZK, et al. Digital loop-mediated isothermal amplification-based absolute methylation quantification revealed hypermethylated dapk1 in cervical cancer patients. Anal Chem. 2021;93(22):8077–8083. doi: 10.1021/acs.analchem.1c01510
- Maric H, Supic G, Kandolf-Sekulovic L, et al. DNMT1 and DNMT3B genetic polymorphisms affect the clinical course and outcome of melanoma patients. Melanoma Res. 2019;29(6):596–602. doi: 10.1097/CMR.0000000000000612
- Hirata E, Ishibashi K, Kohsaka S, et al. The brain microenvironment induces dnmt1 suppression and indolence of metastatic cancer cells. iScience. 2020;23(9):101480. doi: 10.1016/j.isci.2020.101480
- Gober MD, Wales SQ, Aurelian L. Herpes simplex virus type 2 encodes a heat shock protein homologue with apoptosis regulatory functions. Front Biosci. 2005;10(1–3):2788–2803. doi: 10.2741/1736
- Li B, Smith CC, Laing JM, et al. Overload of the heat-shock protein H11/HspB8 triggers melanoma cell apoptosis through activation of transforming growth factor-beta-activated kinase 1. Oncogene. 2007;26(24):3521–3531. doi: 10.1038/sj.onc.1210145
- Smith CC, Lee KS, Li B, et al. Restored expression of the atypical heat shock protein H11/HspB8 inhibits the growth of genetically diverse melanoma tumors through activation of novel TAK1-dependent death pathways. Cell Death Dis. 2012;3(8):e371–e371. doi: 10.1038/cddis.2012.108
- Smith CC, Li B, Liu J, et al. The Levels of H11/HspB8 DNA methylation in human melanoma tissues and xenografts are a critical molecular marker for 5-Aza-2’-deoxycytidine therapy. Cancer Invest. 2011;29(6):383–395. doi: 10.3109/07357907.2011.584588
- Carra S, Seguin SJ, Landry J. HspB8 and Bag3: a new chaperone complex targeting misfolded proteins to macroautophagy. Autophagy. 2008;4(2):237–239. doi: 10.4161/auto.5407
- Varlet AA, Fuchs M, Luthold C, et al. Fine-tuning of actin dynamics by the HSPB8-BAG3 chaperone complex facilitates cytokinesis and contributes to its impact on cell division. Cell Stress Chaperones. 2017;22(4):553–567. doi: 10.1007/s12192-017-0780-2
- Fontanella B, Birolo L, Infusini G, et al. The co-chaperone BAG3 interacts with the cytosolic chaperonin CCT: new hints for actin folding. Int J Biochem Cell Biol. 2010;42(5):641–650. doi: 10.1016/j.biocel.2009.12.008
- Behl C. Breaking BAG: the co-chaperone bag3 in health and disease. Trends Pharmacol Sci. 2016;37(8):672–688. doi: 10.1016/j.tips.2016.04.007
- Ren Z, Dong Z, Xie P, et al. PNU282987 inhibits amyloid-beta aggregation by upregulating astrocytic endogenous alphaBcrystallin and HSP70 via regulation of the alpha7AChR, PI3K/Akt/HSF1 signaling axis. Mol Med Rep. 2020;22(1):201–208. doi: 10.3892/mmr.2020.11132
- Yuan T, Zhang F, Zhou X, et al. Inhibition of the PI3K/AKT signaling pathway sensitizes diffuse large B-cell lymphoma cells to treatment with proteasome inhibitors via suppression of BAG3. Oncol Lett. 2019;17(4):3719–3726. doi: 10.3892/ol.2019.10029
- Shain AH, Joseph NM, Yu R, et al. Genomic and transcriptomic analysis reveals incremental disruption of key signaling pathways during melanoma evolution. Cancer Cell. 2018;34(1):45–55 e44. doi: 10.1016/j.ccell.2018.06.005
- Mulati K, Hamanishi J, Matsumura N, et al. VISTA expressed in tumour cells regulates T cell function. Br J Cancer. 2019;120(1):115–127. doi: 10.1038/s41416-018-0313-5
- Wang L, Long H, Zheng Q, et al. Circular RNA circRHOT1 promotes hepatocellular carcinoma progression by initiation of NR2F6 expression. Mol Cancer. 2019;18(1):119. doi: 10.1186/s12943-019-1046-7
- Fang T, Lv H, Lv G, et al. Tumor-derived exosomal miR-1247-3p induces cancer-associated fibroblast activation to foster lung metastasis of liver cancer. Nat Commun. 2018;9(1):191. doi: 10.1038/s41467-017-02583-0
- Ma ZH, Yang Y, Zou L, et al. 125I seed irradiation induces up-regulation of the genes associated with apoptosis and cell cycle arrest and inhibits growth of gastric cancer xenografts. J Exp Clin Cancer Res. 2012;31(1):61. doi: 10.1186/1756-9966-31-61
- Denton D, Kumar S. Autophagy-dependent cell death. Cell Death Differ. 2019;26(4):605–616. doi: 10.1038/s41418-018-0252-y
- Gober MD, Smith CC, Ueda K, et al. Forced expression of the H11 heat shock protein can be regulated by DNA methylation and trigger apoptosis in human cells. J Biol Chem. 2003;278(39):37600–37609. doi: 10.1074/jbc.M303834200
- Chu H, Li J, Liu T, et al. Anticancer effects of Daidzein against the human melanoma cell lines involves cell cycle arrest, autophagy and deactivation of PI3K/AKT signalling pathways. J Buon. 2020;25(1):485–490.
- Sun Z, Zheng L, Liu X, et al. Sinomenine inhibits the growth of melanoma by enhancement of autophagy via PI3K/AKT/mTOR inhibition. Drug Des Devel Ther. 2018;Volume 12:12(2413–2421. doi: 10.2147/DDDT.S155798
- Du BX, Lin P, Lin J. EGCG and ECG induce apoptosis and decrease autophagy via the AMPK/mTOR and PI3K/AKT/mTOR pathway in human melanoma cells. Chin J Nat Med. 2022;20(4):290–300. doi: 10.1016/S1875-5364(22)60166-3
- Chu H, Li J, Liu T, et al. Anticancer effects of Daidzein against the human melanoma cell lines involves cell cycle arrest, autophagy and deactivation of PI3K/AKT signalling pathways. J Buon. 2021;26(1):290.
- Reilly R, Mroz MS, Dempsey E, et al. Targeting the PI3K/Akt/mTOR signalling pathway in Cystic Fibrosis. Sci Rep. 2017;7(1):7642. doi: 10.1038/s41598-017-06588-z
- Li B, Wang Y, Xu Y, et al. Genetic variants in RORA and DNMT1 associated with cutaneous melanoma survival. Int J Cancer. 2018;142(11):2303–2312. doi: 10.1002/ijc.31243
- Gassenmaier M, Rentschler M, Fehrenbacher B, et al. expression of DNA methyltransferase 1 is a hallmark of melanoma, correlating with proliferation and response to b-raf and mitogen-activated protein kinase inhibition in melanocytic tumors. Am J Pathol. 2020;190(10):2155–2164. doi: 10.1016/j.ajpath.2020.07.002
- Sharma V, Montano MM. Non-epigenetic induction of HEXIM1 by DNMT1 inhibitors and functional relevance. Sci Rep. 2020;10(1):21015. doi: 10.1038/s41598-020-78058-y
- Stomper J, Rotondo JC, Greve G, et al. Hypomethylating agents (HMA) for the treatment of acute myeloid leukemia and myelodysplastic syndromes: mechanisms of resistance and novel HMA-based therapies. Leukemia. 2021;35(7):1873–1889. doi: 10.1038/s41375-021-01218-0
- Li X, Dong L, Liu J, et al. Low-Dose Decitabine Augments the Activation and Anti-Tumor Immune Response of IFN-gamma(+) CD4(+) T cells through Enhancing IkappaBalpha degradation and nf-kappab activation. Front Cell Dev Biol. 2021;9(647713). doi: 10.3389/fcell.2021.647713
- Wang C, Liu Y, Dong L, et al. Efficacy of decitabine plus Anti-PD-1 camrelizumab in patients with Hodgkin lymphoma who progressed or relapsed after pd-1 blockade monotherapy. Clin Cancer Res. 2021;27(10):2782–2791. doi: 10.1158/1078-0432.CCR-21-0133
- Sharma BK, Smith CC, Laing JM, et al. Aberrant DNA methylation silences the novel heat shock protein H11 in melanoma but not benign melanocytic lesions. Dermatology. 2006;213(3):192–199. doi: 10.1159/000095035
- Colunga AG, Laing JM, Aurelian L. The HSV-2 mutant DeltaPK induces melanoma oncolysis through nonredundant death programs and associated with autophagy and pyroptosis proteins. Gene Ther. 2010;17(3):315–327. doi: 10.1038/gt.2009.126
- Nivon M, Abou-Samra M, Richet E, et al. NF-kappaB regulates protein quality control after heat stress through modulation of the BAG3-HspB8 complex. J Cell Sci. 2012;125(Pt 5):1141–1151. doi: 10.1242/jcs.091041
- Chamcheu JC, Roy T, Uddin MB, et al. Role and therapeutic targeting of the pi3k/akt/mtor signaling pathway in skin cancer: a review of current status and future trends on natural and synthetic agents therapy. Cells. 2019;8(8):803. doi: 10.3390/cells8080803
- Wu X, Yu J, Yan J, et al. PI3K/AKT/mTOR pathway inhibitors inhibit the growth of melanoma cells with mTOR H2189Y mutations in vitro. Cancer Biol Ther. 2018;19(7):584–589. doi: 10.1080/15384047.2018.1435221
- Hwang SY, Chae JI, Kwak AW, et al. Alternative options for skin cancer therapy via regulation of akt and related signaling pathways. Int J Mol Sci. 2020;21(18):6869. doi: 10.3390/ijms21186869
- Gong C, Xia H. Resveratrol suppresses melanoma growth by promoting autophagy through inhibiting the PI3K/AKT/mTOR signaling pathway. Exp Ther Med. 2020;19(3):1878–1886. doi: 10.3892/etm.2019.8359
- Long J, Pi X. Polyphyllin I promoted melanoma cells autophagy and apoptosis via pi3k/Akt/mtor signaling pathway. Biomed Res Int. 2020;2020(5149417):1–9. doi: 10.1155/2020/5149417
- Wu C, He J, Sun Z, et al. Neogambogic acid induces apoptosis of melanoma B16 cells via the PI3K/Akt/mTOR signaling pathway. Acta Biochim Pol. 2020;67(2):197–202. doi: 10.18388/abp.2020_5188
- Sun L, Zhao H, Xu Z, et al. Phosphatidylinositol 3-kinase/protein kinase B pathway stabilizes DNA methyltransferase I protein and maintains DNA methylation. Cell Signal. 2007;19(11):2255–2263. doi: 10.1016/j.cellsig.2007.06.014
- He Y, Dan Y, Gao X, et al. DNMT1-mediated lncRNA MEG3 methylation accelerates endothelial-mesenchymal transition in diabetic retinopathy through the PI3K/Akt/mTOR signaling pathway. Am J Physiol Endocrinol Metab. 2021;320(3):E598–E608. doi: 10.1152/ajpendo.00089.2020