
ABSTRACT
This study characterized variations in the methylation profile of mitochondrial DNA (mtDNA) during initial bovine embryo development and correlated the presence of methylation with mtDNA transcription. Bovine oocytes were obtained from abattoir ovaries and submitted to in vitro culture procedures. Oocytes and embryos were collected at various stages (immature oocyte, IM; mature oocyte, MII; zygote, ZY; 4-cells, 4C; 16-cells, 16C and blastocysts, BL). Total DNA (including mtDNA) was used for Whole Genome Enzymatic Methyl Sequencing and for quantification of mtDNA copy number. Extracted RNA was used for quantification of mitochondrial transcripts using Droplet Digital PCR. We selected ND6, CYTB, tRNA-Phe and tRNA-Gln based on their location in the mitochondrial genome, functionality and/or previous literature associating these regions with cytosine methylation. The number of mtDNA copies per oocyte/embryo was found to be similar, while methylation levels in mtDNA varied among stages. Higher total methylation levels were found mainly at 4C and 16C. In specific gene regions, higher methylation levels were also observed at 4C and 16C (ND6, CYTB and tRNA-Phe), as well as an inverse correlation with the quantity of transcripts for these regions. This is a first description of epigenetic changes occurring in mtDNA during early embryonic development. Our results indicate that methylation might regulate the mtDNA transcription at a local level, particularly around the time of embryonic genome activation.
KEYWORDS:
Introduction
Mitochondria are known to play crucial roles in all animal cells, mainly for energy generation in the form of ATP [Citation1]. Recent studies, however, have shown that mitochondria roles go beyond that, as they are also implicated in many cellular processes such as generation of metabolic intermediates, calcium signalling, stress response and apoptosis [Citation2]. One particular characteristic of mitochondria biology is that, in mammalian cells, each mitochondrion contains one or more copies of their own circular double stranded genome. The mitochondrial DNA (mtDNA) is a ~ 16kb sequence that encodes 13 protein components of the oxidative phosphorylation cascade (subunits of complexes I, III, IV, and V), as well as mitochondria ribosomal RNAs and an array of 22 transfer RNAs [Citation3]. Besides, in mtDNA, mitochondrial genes are positioned in a polycistronic sequence, and both transcription and replication begin in a specific regulatory region called Displacement Loop (D-loop), in which promoters and transcription start sites can be found [Citation4].
In the context of reproductive sciences, mitochondria organization and functions are complex, but tightly regulated by genetic and epigenetic mechanisms [Citation5]. The mature oocyte is the richest cell in terms of mtDNA content [Citation6] and the pool of mitochondria present in the oocytes is inherited by the embryo almost exclusively without paternal transmission [Citation7]. Furthermore, several studies have already associated mtDNA content with the ability of the oocyte to acquire competence for fertilization [Citation8]. More recently, piling evidence indicates that the physiological state of the mother, as well as the microenvironment surrounding the gametes, whether in vivo or in vitro, are also of great importance for the oocyte to achieve the metabolic conditions that guarantee a proper developmental trajectory for the embryo [Citation9].
In vivo, for example, studies done in bovine presented evidences that cows experiencing periods of negative energy balance have an altered composition of metabolites in their follicular fluid, i.e., increased levels of non-esterified fatty acids and glucose, which impacts oocyte quality and cumulus cell protection against lipotoxicity [Citation10]. In addition, exposure to an energy deficient metabolic environment modifies signalling by the mTOR and sirtuins pathways, implying in mitochondrial dysfunction and inhibition of transcription in the early embryo [Citation11]. In vitro, the culture media used for fertilization and embryo culture is designed to provide nutrients and other necessary factors for the developing embryo. However, studies have shown that culture factors (e.g., glucose concentration, amino acid availability, oxygen tension) can create suboptimal metabolic conditions that lead to altered mitochondrial metabolism, significantly impacting embryonic gene expression and epigenetic programming [Citation12–14].
It is noteworthy that during the early stages, important processes such as oocyte maturation, embryonic genome activation (EGA) and cell differentiation are especially sensitive to changes in the metabolic environment [Citation15]. This leads to the important question whether the mitochondrial genome, just like the nuclear genome, could be sensitive to the environment or the cell metabolism and carry on that information to the offspring via epigenetic mechanisms [Citation16–18]. Since mitochondria metabolites have a direct influence on methylation and acetylation enzymes, their amount could be controlled by the mtDNA, creating a programming cascade downstream [Citation19]. Although not yet fully characterized, mtDNA methylation has been detected in different species and cell types in health and disease processes [Citation20].
In bovine, our group was the first to show that mtDNA cytosine methylation patterns are indeed highly conserved between oocytes and embryos, but significantly differ from somatic cells (granulosa cells, for instance) [Citation21]. Besides, the profile of methylated residues was associated to the origins of the oocyte (high-quality OPU-derived oocytes versus abattoir-derived oocytes) and was inversely correlated with differences in the expression of specific mitochondrial genes [Citation21]. Furthermore, as observed in other studies, methylation was strand-biased and not restricted to CG context [Citation22].
Therefore, evidences indicate that epigenetic changes occurring in mtDNA during initial development, similar to those seen in nuclear DNA, may impact gene expression and mitochondrial function in the oocytes and consequently in the embryos. However, without a comprehensive map of the mitochondrial epigenome during this transition period, it is challenging to thoroughly investigate the biological significance of this mechanism and its effect on the regulation of individual mitochondrial genes. Thus, in the present study, we have assessed oocytes and embryos at different time points of bovine initial development, using Whole Genome Enzymatic Methyl Sequencing (WGEMS) as we aimed to identify (i) differences in the mtDNA methylation profile across embryo development (ii) the link between mtDNA methylation and possible variations in mtDNA content (iii) the relationship between mtDNA methylation levels and mitochondrial gene expression in oocytes and blastocysts.
Materials and methods
Oocyte collection and embryo production
Oocytes were collected from abattoir ovaries with the aid of syringe and needle. Only follicles between 3 and 8 mm were punctured. For in vitro maturation (IVM), groups of 25–30 COCs were placed in 90 μL drops of TCM-199 bicarbonate supplemented with 10% of Fetal Bovine Serum (FBS), 0.5 μg/mL FSH (Folltropin-V, Bioniche, Belleville, Canada) and 100 IU/mL hCG (Chorulon, Merck Animal Health, Boxmeer, The Netherlands) under mineral oil. In vitro maturation of COCs followed at 38.5°C, 5% CO2 and high humidity for 24 h.
Then, frozen commercial semen straws from one bull were thawed in a water bath at 37°C for 30 s and their contents were mixed and centrifuged on a discontinuous Percoll® gradient (45% and 90%). Sperm concentration was adjusted to 1 × 10⁶ sperm/mL. Matured COCs were transferred to 90 μL drops of fertilization media [Citation23] under mineral oil. Oocytes and sperm were incubated at the same conditions of air and temperature for 8 h. Next, the remaining granulosa cells were completely removed, presumptive zygotes were transferred to 90 µL drops of modified SOF medium supplemented with 3 mg/mL BSA, customized to present 50% of amino acids and carbohydrates from the bovine oviduct [Citation24]. On day 4, embryos were transferred to 90 μL droplets of medium modified SOF containing 3 mg/mL BSA and customized to present 50% of amino acids and carbohydrates from the bovine uterus [Citation24] where they remained until day 7. All the in vitro culture process was carried out at 38.5°C, 5% CO2, 5% O2, and high humidity.
Immature oocytes (IM; pools of 10, n = 3) were collected prior to the beginning of IVM. Mature oocytes (MII; pools of 10, n = 3) were collected after 24 h of IVM and had cumulus cells completely removed by gentle pipetting prior to storage. Zygotes were collected at 8 hpi (ZY; pools of 10, n = 3), 4-cell embryos (4C; pools of 10, n = 3) were collected at 36hpi, 16-cells embryos were collected at 72hpi (16C; pools of 10, n = 3) and finally, blastocysts were collected at 186 hpi and submitted to immunosurgery to separate trophectoderm from inner cell mass (ICM); only ICM’s were kept for further analysis (BL; pools of 10, n = 3).
Immunosurgery was carried out by first removing the zona pellucida with pronase solution (10 mg/mL). Next, embryos were incubated in SOF HEPES with 20% anti-bovine serum (B8270-2 ML, Sigma-Aldrich) for 1 h at 38.5°C followed by repeated washes to remove the excess of pronase. Then, embryos were incubated SOF HEPES supplemented with 20% guinea pig complement (Innovative Research, IGP-COMPL-21249) for 1 h at 38.5°C. Finally, ICM cells were pulled with the aid of a fine capillary and kept at −80°C until the analysis.
Droplet digital pcR (ddPCR)
Droplet Digital PCR allows gene transcription analysis by measuring the native proportions of nucleic acids [Citation25]. This is possible because the technique exploits two technical advances (i) buffers that allow the direct use of lysates and avoid the need of nucleic acid purification methods, and (ii) digital PCR analysis, which permits the absolute measurement of nucleic acid molecules in end-point PCR that is less influenced by the presence of inhibitors. Therefore, in the present study, we assessed mtDNA content (copy number) and the number of mitochondrial transcripts for specific genes in the same sample, as described below.
Quantification mtDNA copy number of mitochondrial genes transcripts
Briefly, samples of bovine oocytes and embryos from all study groups were digested with proteinase K (50 mg/mL) in M-Digestion buffer 10X (Zymo Research) for 20 min at 50°C to remove the zona pellucida. Out of the final reaction volume of each sample extract (20 µL), one part was destined to the quantification of mtDNA copy number and the other part for RNA purification and cDNA synthesis to quantify processed mitochondrial transcripts, namely, CYTB and tRNA-Phe (coded on the heavy strand), ND6 and tRNA-Gln (coded on the light strand). These four transcripts were selected because of their location (light or heavy strand), functionality in energy production (assembly of complex I [ND6] and III [CYTB] of the electron transport chain) and because there were previous reports associating the presence of methylation in those regions with changes in gene expression and/or number of mtDNA copies in other models [Citation20,Citation26,Citation27].
For mtDNA copy number quantification, DNA was diluted to the equivalent of 1 structure (1 oocyte or 1 embryo) per ddPCR reaction. For the analysis of blastocysts inner mass cells, it was not possible to know in advance the number of cells of each embryo used, therefore, in parallel we have assessed MX1, which is a bovine single-copy nuclear gene that allowed us to quantify the total input of cells in each reaction.
RNA extraction and cDNA synthesis
PicoPure RNA Isolation Kit (Applied Biosystems, USA KIT0204) was used for total RNA extraction and the High-Capacity cDNA Reverse Transcription Kit (Applied Biosystems, USA #4368814) for cDNA synthesis. Both protocols were performed following the manufacturer’s instructions.
Droplet digital PCR
Each ddPCR reaction (VF = 20 µL) contained 1× EvaGreen ddPCR Supermix (Bio-Rad), 100 nM of specific primers (Supplementary table S1) and DNA diluted to the equivalent of 1 oocyte/embryo. Prepared reactions were partitioned using a Q×100droplet generator (Bio-Rad) and the emulsions were transferred to a 96-well plate. PCR was performed at 95°C for 5 min, 50 cycles of 95°C, 57°C, and 72°C for 30 sec each, then held at 12°C. Fluorescence was measured using a Q×100droplet reader (Bio-Rad). The threshold for positive droplets was determined by the software and the final output was a concentration of starting template molecules/µL. Finally, the number of mtDNA copies or transcripts per reaction was normalized to obtain copies/per cell equivalent.
Library preparation and whole genome sequencing
Total DNA was extracted from all samples using the Quick DNA Microprep kit (Zymo Research) after a proteinase K digestion (50 mg/mL, 50°C, 20 min). Next, total DNA samples were submitted to enzymatic conversion of cytosines and library preparation using the NEBNext® Enzymatic Methyl-seq Kit (New England Biolabs) that comes with Illumina compatible index primers. Positive (puc19) and negative (lambda DNA) methylation controls were added to all samples to allow the calculation of conversion efficiency. The quality and quantity of each library was verified with Agilent TapeStation. Sequencing was performed in one lane of NovaSeq 6000 PE 150 bp (Illumina).
Data analysis
Analysis of mtDNA copy number and mtDNA transcription
The quantity of mtDNA copies per cell was calculated based on the number of structures used in each ddPCR reaction (one immature oocyte, one mature oocyte, one zygote, one 4-cell embryo or one 16-cell embryo) or with the aid of the simultaneous quantification of MX1 (in the case of blastocysts’ ICM). Results obtained with ddPCR are the absolute quantification of DNA copies or transcripts of a gene in a given sample; therefore, raw numbers were used for the comparison between consecutive stages using ANOVA followed by Fisher’s LSD test (p < 0.05). Mitochondrial expression () was calculated at each stage by averaging absolute number of transcripts for the evaluated genes per stage. Data is presented as means ± SEM.
NGS data analysis
Sequencing adapters were removed using Trimmomatic [Citation28] and base calls with low quality score were removed. Reads with a minimal length of 50 nucleotides were kept for analysis. Read conversion, alignment to the bovine mitochondrial genome (NC_006853.1) and methylation calls were obtained using Bismark [Citation29]. For each sample, conversion rate was estimated using puc19 and lambda DNA conversion success. Read conversion, alignment to the puc19 and lambda DNA and methylation calls were also obtained using Bismark (Krueger and Andrews 2011). If more than 2% of lambda cytosines are identified as methylated, the associated sample was removed from the analyses.
Differentially methylated cytosines (DMC) between two consecutive stages were identified using the MethylKit R package [Citation30]. For each C-site, a logistic regression model is fitted to calculate p-values that are then adjusted to control for false discovery rate using the BH method implemented in R 4.2.1 p.adjust function [Citation31]. Methylation difference is calculated as (treatment group – control group). For each comparison, one stage (set as control group) is compared to the next stage (set as treatment group), considering a minimum coverage of 10 reads and no missing data. Methylation difference was also calculated according to the different contexts of cytosine methylation (CG, CHH and CHG).
Finally, methylation levels at specific C-sites (# of methylated reads/# of total reads in a given position) and average methylation were calculated. Average methylation levels for the selected regions (CYTB, ND6, tRNA-Gln and tRNA-Phe) were compared between consecutive stages using ANOVA with Fisher’s LSD as a follow-up test considering an α = 5%.
Results
Sequencing of mitochondrial DNA
To investigate genome-wide mtDNA methylation patterns at single base pair resolution, mtDNA was extracted from all samples and fragmented to an average insert size of 270–290 bp (370–420 bp with adapters) with the aid of a Covaris instrument. This step is of utmost importance to avoid inefficient cytosine conversion due to the secondary and even tertiary structure of mtDNA [Citation32]. To ensure the quality of methylation calls, fully methylated (puc19) and fully unmethylated (lambda DNA) controls were spiked into all samples prior to library preparation and sequenced simultaneously alongside the bovine mtDNA samples. Only two samples presented conversion issues (conversion rate < 98%) and were removed from final analysis.
Deep sequencing was performed using a NovaSeq 6000 platform and obtained 100% coverage of the entire mtDNA with 300-400X depth (Supplementary Table S2). The level of methylation detected at each cytosine site was compared to the sequencing depth achieved for that specific position in order to obtain methylation level. Results indicate that methylation is observed in a low range in all samples, varying from 0 to 13% in all evaluated samples. Interestingly, the reads showed a bimodal distribution of methylation: all CpG sites in a read tend to be either all methylated or all unmethylated (Supplementary Figure S1).
mtDNA methylation shows variable patterns across bovine early development
In order to better visualize the variation of methylation levels in the different stages, we have stratified reads containing 0%, <1%, between 1–5% and >5% of methylation, as shown on (and supplementary table S3). It is possible to observe that at MII and ZY stages, the majority of the reads present less than 1% of methylated cytosines. The scenario starts changing at the 4C stage, but it is at the 16C stage that the wave of mtDNA methylation peaks and most part of the reads presented 1–5% of methylated cytosines.
Figure 1. Variation in the distribution of mtDNA methylation across bovine preimplantation development.
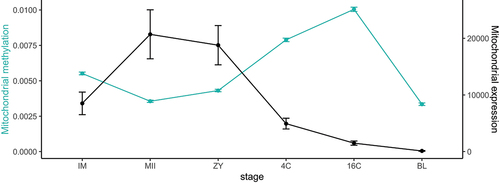
The average of methylation in the entire mitochondrial genome was also calculated in order to show how it fluctuates according to the stage of development. The average methylation was significantly different between all consecutive stages of development (IM, MII, ZY, 4C, 16C and BL; ). Confirming the previous results, there is an important increase in the average methylation from ZY stage forward that peaks at the 16C stage, which coincides with the EGA. Then, there is a significant decrease in the average methylation at the BL stage. The calculated difference in the expression of selected mitochondrial transcripts follows the opposite pattern, showing a significant increase at the MII stage of the oocyte, followed by a decrease that is observed in all the embryo-stages (4C, 16C, BL stages).
Figure 2. Average methylation levels per stage displayed together with average mitochondrial expression of the 4 representative transcripts selected for this study (ND6, CYTB, Trna-Phe and Trna-Gln). Values are represented as mean ± S.E.M.
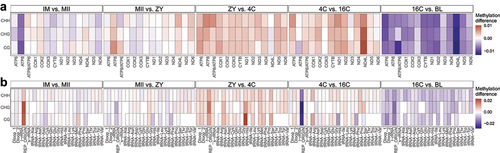
Methylation differences calculated between consecutive stages were also investigated according to the cytosine context in the coding region of the 13 genes (), 22 tRNAs and rRNAs (), but regardless of punctual differences, the overall methylation profile is similar for all contexts (CG, CHG and CHH).
Figure 3. (a) Heatmap shows the average methylation difference in the gene regions between consecutive stages and considering all cytosine contexts (CG, CHG and CHH). (b) Heatmap shows the average methylation difference in the regions encoding tRnas between consecutive stages and considering all cytosine contexts (CG, CHG and CHH). Red colour indicates an increase of methylation between the two consecutive stages, blue colour indicates a decrease of methylation between the two consecutive stages, light colour indicates no changes between the two consecutive stages.
Variations of mtDNA copy number and the relation with the replication origin.
The overall number of mtDNA copies per structure is similar for all stages, except for the BL stage, which shows lower mtDNA content because only ICM cells, which originate from the embryo itself, were evaluated at this stage. The number of mtDNA copies per cell, however, significantly differed between stages. The highest number of mtDNA molecules was observed at the oocyte stages (IM and MII), as expected. Along the rest of embryo development (ZY to BL), the proportion of mtDNA per cell tends to decrease ().
Figure 4. (a) Methylation level observed at the replication origin of the light strand in mitochondrial DNA. (b) mtDNA copy number calculated per structure or (C) per cell. ![]()
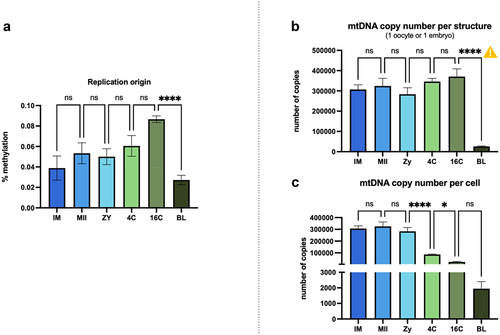
Next, we evaluated if methylation present at the light strand replication origin (OL 5519–5549 bp) could help explain variations in mtDNA copy number. It is noteworthy that the origin of replication presented the highest methylation levels observed in our dataset, with an average that varied in the range of 5–13%. Furthermore, an important increase in methylation levels at the replication origin happens from ZY to 4C stages, and the inverse relationship is observed for the mtDNA copy number per cell at the same stages.
mtDNA methylation and transcription of specific regions (CYTB, ND5, ND6, tRNA-Phe and tRNA-Gln)
Methylation level at the D-loop region (15792–16338 and 1–363 bp, ) was evaluated concomitantly with methylation and number of transcripts for genes that are coded on the light strand (ND6 and tRNA-Gln; ). In the D-loop, there was a significant higher average methylation at the 4C stage compared to the previous evaluated stage (ZY) (, p < 0.0001).
Figure 5. Methylation levels and the relationship with mitochondrial expression of the light strand. (a) methylation profile observed at D-loop region for all stages; (b) methylation levels at the ND6 encoding region and (c) the number of ND6 transcripts for all stages; (d) methylation levels at the Trna-Gln encoding region and (e) the number of Trna-Gln transcripts for all stages. Methylation levels are presented as percentages. Consecutive stages were compared using ANOVA + Fisher’s LSD considering an α = 5%. *represents p < 0.05; **represents 0 < 0.001, ***represents p < 0.0001.
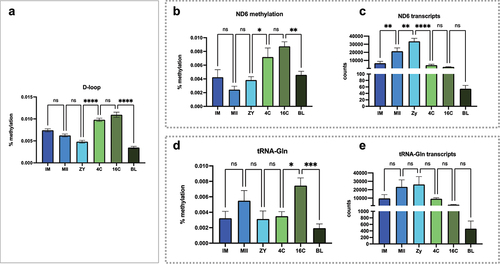
Similarly, in the ND6 coding region (13913–14440 bp), lower methylation levels were observed particularly from IM to ZY stages. Then, a significant increase is observed in methylation levels between ZY and 4C stages (, p < 0.05) that are inversely proportional to the number of transcripts observed for this gene at the same stages (, p < 0.0001). For the region that encodes the tRNA-Gln (4123–4194 bp), an increase in methylation levels was observed between 4C and 16C stages (, p < 0.05). A decrease in methylation was also observed between 16C to BL stages (, p < 0.001), but none of these changes were associated with the number of transcripts for tRNA-Gln between consecutive stages.
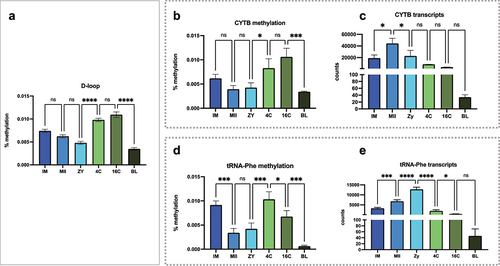
Simultaneously, methylation levels on the D-loop region () were also evaluated together with methylation and number of transcripts for genes that are coded on the heavy strand (CYTB and tRNA-Phe; ). Again, significantly higher methylation levels were observed in the coding region for CYTB between ZY and 4C stages (, p < 0.05), but the number of transcripts was not significantly different between theses stages. For the coding region of tRNA-Phe, all comparisons were significantly different for methylation levels, except between MII and ZY stages (). Interestingly, the decrease in methylation between IM and MII stages (, p < 0.001) is concomitant with an increase in the number of transcripts of this tRNA in the same stages (, p < 0.001). Likewise, the increase in methylation between ZY and 4C (, p < 0.001) coincides with the decrease in the number of transcripts between these stages (, p < 0.0001).
Figure 6. Methylation levels and the relationship with mitochondrial expression of the heavy strand. (a) methylation profile observed at D-loop region; (b and c) methylation levels at the CYTB encoding region and the number of CYTB transcripts; (d and e) methylation levels at the Trna-Phe encoding region and the number of Trna-Phe transcripts. Consecutive stages were compared using ANOVA + Fisher’s LSD considering an α = 5%.
Discussion
In this study, we evaluated genome-wide cytosine methylation profile of mitochondrial DNA in bovine oocytes and embryos using high-coverage DNA sequencing. We quantitatively assessed methylation levels both in CpG and non-CpG context, with base-pair resolution, and show evidences that, although observed at low levels, mtDNA methylation presents a temporal-specific pattern across bovine early development. These changes might also be associated with some differences in the transcription of specific mitochondrial regions.
It is worth mentioning that the field of mitochondrial epigenetics is highly controversial, with numerous reports suggesting the presence of significant amounts of methylation or the complete absence of it [Citation32–34]. Multiple recent studies have, however, shed a light on the subject showing that important technical limitations could impact the correct assessment of mtDNA methylation levels and presenting numerous evidences of cytosine methylation presence and association with cardiovascular and neurodegenerative diseases, cancer and metabolic disorders [Citation20]. In order to avoid technical issues, we have made specific methodological choices. Firstly, we have used the Enzymatic Methyl-Sequencing protocol, which is compatible with very low DNA input (>10 ng), to generate libraries for sequencing instead of the traditional DNA bisulphite conversion method. Secondly, we included a DNA shearing step, which is important to avoid overestimation of methylation due to incomplete conversion in the coiled structure of mitochondrial DNA, as described in previous reports [Citation32,Citation34].
The ability to accurately measure mtDNA methylation provides a new opportunity to investigate various crucial questions related to mtDNA methylation in reproductive biology, the first one being the modulation of addition/removal of cytosine methylation in mtDNA during oocyte maturation, fertilization and preimplantation development. The comparison between stages revealed unique cytosine methylation patterns that are more conserved in oocytes stages (IM, MII) but significantly increased from the ZY to the 16C stages. Interestingly, this profile is the opposite from what is observed during epigenetic reprogramming of nuclear DNA, where cytosine methylation is at the lowest levels during maternal-to-embryo transition [Citation35].
The epigenetic remodelling of nuclear DNA is crucial to the switch from the maternal/paternal genome to the embryo genome [Citation36]. To support this and other cellular activities such as biomass synthesis, cell proliferation, blastocoel formation, and hatching Citation37,Citation38], the embryo gradually increases oxidative metabolism [Citation39,Citation40], while it activates its own transcription machinery, a step also known as ‘Embryonic Genome Activation (EGA). Thus, it is not surprising that at this moment in time, there is a need for specific regulation of the mitochondrial genome during such a sensitive step of embryo development. In this case, higher levels of mtDNA methylation might be one mechanism regulating mitochondrial function to influence the amount of energy available but also to influence the availability of metabolites responsible of epigenetic changes in the embryo, particularly acetylation and methylation.
Furthermore, we speculate that the intensity of the mitochondrial epigenetic regulation is related to the microenvironment surrounding the oocyte during its maturation. In this scenario, information about changes in the environment that could affect the metabolic state of cells might be transmitted to offspring not only through nuclear DNA but also through mtDNA. In the case of suboptimal conditions, this type of regulation could play a protective role, preventing the overactivation of mitochondrial activity in an attempt to combat metabolic dysfunctions, thus ensuring that mitochondria passed on to the next generation suffer less damage related to oxidative stress, for example. Supporting that hypothesis, previous studies showed that indeed the oocytes obtained from cows coming from distinct microenvironments (cows from slaughterhouse versus cows submitted to hormonal stimulation protocols), also had different mtDNA methylation profiles and these profiles are transmitted to the next generation [Citation21]. A similar observation was made for metabolic stressed cows post-partum demonstrating mitochondrial dysfunction at the blastocyst stage [Citation11].
In terms of mitochondrial gene expression, the average of mitochondrial transcripts quantified in this study indicates that it follows the opposite pattern of mtDNA methylation. In other words, when mtDNA methylation starts to increase (after the ZY stage), the quantity of mitochondrial transcripts starts to decrease. Besides, the lowest number of mitochondrial transcripts was observed at the blastocyst stage, which is possibly due to the fact that only blastocysts’ ICM cells were used in the present study. Previous studies have already described that mitochondria from ICM cells remain quiescent during the preimplantation stage, unlike mitochondria from the trophectoderm cells (TE) [Citation9]. One explanation for this is that in ICM cells, higher expression of genes related to pluripotency are related to lower expression of mtDNA replication and transcription factors, as previously described [Citation41,Citation42].
Regarding mitochondrial copy number, we have calculated the number of mtDNA copies in the different stages using two different approaches. When we calculated copy number per structure, i.e., one oocyte or one embryo, the total number of mtDNA copies shows little variations up to the 16C stage (). This observation is in accordance with studies conducted on several species demonstrating that mitochondrial DNA replication does not occur during the first cleavage stages of embryogenesis [Citation43–45]. Additionally, we have also observed that the replication origin presented the highest methylation average in our data. According to the strand-displacement theory, the replication of the leading mtDNA strand starts at the OH in the D-loop region, and then proceeds until the OL (5519–5549 bp) is exposed. Then, a loop structure is formed and the polymerase is recruited to initiate the replication of the lagging strand that will continue until two full-length, dsDNA molecules are formed [Citation46]. Therefore, we speculate that the presence of increased amounts of methylation in the OL could be used as a possible mechanism to prevent mtDNA replication during the first stages of embryo development. Supporting that hypothesis, we observed higher methylation levels at the replication origin from the ZY to 4C stages, and the inverse relationship is observed for the mtDNA copy number per cell at the same stages.
When the copy number is normalized per cell, there is indeed more variation. The highest number of mtDNA copies per cell was observed in the first evaluated stages (IM, MII and ZY) supporting previous data showing that mitochondrial biogenesis occurring during oocyte maturation is crucial to constitute a mitochondrial pool large enough to support early embryo development [Citation9]. The number of mtDNA copies per cell gradually decreases in the next stages evaluated in the present study (4C, 16C and BL stages). This also corroborates previous research demonstrating that the number of mitochondria in each cell decreases as they are diluted into the nascent blastomeres during mitotic divisions and while mtDNA replication is not resumed [Citation42].
When specific mtDNA regions were investigated, we rapidly identified specific patterns of methylation distribution. Therefore, we have attempted to establish a functional relationship between the presence of methylation and mitochondrial transcription. It is important to state that epigenetic mechanisms as we know might work differently in mitochondria, in parts due to the fact that epigenetically, mitochondrial genome differs a lot from the nuclear genome [Citation47]. Unlike nuclear DNA, mtDNA is not packed into a chromatin, and it is found relatively free inside mitochondria compartments in a histone-free nucleoid form [Citation48]. Thus, the exact mechanisms through which methylation can work to regulate mitochondrial gene expression are still not deciphered.
In this study, we characterized methylation levels at the D-loop regulatory region, which contains both heavy and light strand promoters, as well as the TFAM-binding site that allows the initiation of transcription [Citation49]. In addition to that, we evaluated methylation levels in the specific regions that code for mitochondrial genes and tRNAs in both strands.
Methylation level at D-loop significantly increased at the 4C stage compared to the previous evaluated stage (ZY stage); then remained at higher levels at the 16C and significantly decreased in the BL stage. A similar profile was observed for ND6, CYTB and tRNA-Phe. In the tRNA-Gln region, however, methylation level only peaked at the 16C stage. Taken together, these results led us to hypothesize that the methylation profile established at the regulatory region might serve as some type of template for the methylation in the rest of mitochondrial genome. In other words, if D-loop is highly methylated, so it is the rest of the genome. That could also possibly help to explain the bimodal distribution of methylation observed not only in our samples, but also reported in previous studies [Citation32]. In addition, since the mitochondria mRNA is polycistronic, the origin of transcription, also in the D-Loop, may have a dominant effect on the rest of the process.
Despite that possibility, it seems that methylation can also be added/removed in particular places of the mitochondrial genome, as demonstrated by the methylation patterns observed in the replication origin and in the tRNA-Gln region, which quite differ from the pattern observed for D-loop. Besides, considering that mtDNA does not contain introns or individual gene promoters [Citation50], the exact function of methylation found in coding regions is yet to be elucidated, but it makes sense to have some mechanism to regulate mitochondrial transcription, and possibly translation in a more individualized manner. In human carcinoma cells, for example, it has been shown that cytosine methylation in gene-encoding regions marks exons for alternate splicing [Citation51], so it is possible that the role of mtDNA methylation is related to the processing of mitochondrial polycistronic transcripts, in order to better meet the very particular energy demands of the developing embryo.
Interestingly, variation of methylation levels, predominantly observed between ZY and 4C stages for both D-loop and the coding regions, is inversely proportional to the number of transcripts for some of the regions, such as ND6 and tRNA-Phe, showing evidences of a possible correlation between mtDNA methylation and transcription or mRNA stability. Other studies have already correlated the presence of methylation with a decreased transcription of specific mitochondrial genes [Citation52–54], but more studies are necessary to confirm and understand the exact nature of this relationship.
Another puzzling question is the distribution of methylation across mitochondrial which can be addressed by WGEMS sequence analysis (Suplementary Figure S1). Contrarily to a normal distribution, methylation patterns show a bimodal distribution indicating that some mitochondria are fully methylated along their genome while some are fully unmethylated. The current information available estimates one mtDNA copy per mitochondria in oocytes and early embryos [Citation42]. So, a possible hypothesis to explain this distribution would imply that some mitochondria might be protected from reactive oxygen species by having their DNA methylated and activity limited in order to ensure its quality and transmission to the next generation. This observation requires further investigation using long range sequence methylation analysis (e.g., nanopore sequencing) to assess mitochondria heterogeneity. In that sense, a recent paper in mouse has provided new data showing that methylation is possibly a protection against DNA damage at the blastocyst stage but has not investigated the heterogeneity perspective between ICM and TE cells [Citation55].
In conclusion, in the present study we demonstrate, for the first time, the fluctuations in mtDNA methylation throughout bovine preimplantation development. Cytosine methylation profile is stage-specific and may be functionally related to the expression of mitochondrial genes. We believe that although found in low levels, methylation plays a regulatory role in mitochondrial function, particularly at the maternal-to-embryo transition, when important metabolic changes take place to guarantee the correct developmental trajectory. The fact that mitochondria activity controls many epigenetic metabolites at EGA reinforce the importance of this early programming step. Future studies remain necessary to validate these findings and better understand the crosstalk between the mitochondrial and nuclear genome during the events of early development.
Supplemental Material
Download MS Word (48.4 KB)Acknowledgments
The authors would like to thank Clement Plessis for invaluable help with the bioinformatics data.
Disclosure statement
No potential conflict of interest was reported by the author(s).
Data availability statement
Data supporting the findings of this study have been deposited in the National Center for Biotechnology Information (NCBI) and are accessible through GEO Series Accession number GSE230476.
Supplementary material
Supplemental data for this article can be accessed online at https://doi.org/10.1080/15592294.2023.2241010.
Additional information
Funding
References
- Jansen RP. Origin and persistence of the mitochondrial genome. Hum Reprod. 2000;15(Suppl 2):1–13. doi: 10.1093/humrep/15.suppl_2.1
- Chakrabarty RP, Chandel NS. Beyond ATP, new roles of mitochondria. The Biochemist. 2022;44(4):2–8. doi: 10.1042/bio_2022_119
- Boore JL. Animal mitochondrial genomes. Nucleic acids res. 1999;27(8):1767–1780. doi: 10.1093/nar/27.8.1767
- Rorbach J, Minczuk M. The post-transcriptional life of mammalian mitochondrial RNA. Biochem J. 2012;444(3):357–373. doi: 10.1042/BJ20112208
- Minocherhomji S, Tollefsbol TO, Singh KK. Mitochondrial regulation of epigenetics and its role in human diseases. Epigenetics. 2012;7(4):326–334. doi: 10.4161/epi.19547
- Chiaratti MR, Garcia BM, Carvalho KF, et al. Oocyte mitochondria: role on fertility and disease transmission. Anim Reprod. 2018;15(3):231–238. doi: 10.21451/1984-3143-AR2018-0069
- Nishimura Y, Yoshinari T, Naruse K, et al. Active digestion of sperm mitochondrial DNA in single living sperm revealed by optical tweezers. Proc Nat Acad Sci. 2006;103(5):1382–1387. doi: 10.1073/pnas.0506911103
- Babayev E, Seli E. Oocyte mitochondrial function and reproduction. Curr Opin Obstet Gynecol. 2015;27(3):175–181. doi: 10.1097/GCO.0000000000000164
- May-Panloup P, Boguenet M, El Hachem H, et al. Embryo and its mitochondria. Antioxidants. 2021;10(2):139. doi: 10.3390/antiox10020139
- WARZYCH E, LIPINSKA P. Energy metabolism of follicular environment during oocyte growth and maturation. J Reprod Dev. 2020;66(1):1–7. doi: 10.1262/jrd.2019-102
- Chaput C, Sirard MA. Embryonic response to high beta-hydroxybutyrate (BHB) levels in postpartum dairy cows. Domest Anim Endocrinol. 2020;72:106431. doi: 10.1016/j.domaniend.2019.106431
- Cagnone G, Sirard M-A. The embryonic stress response to in vitro culture: insight from genomic analysis. Reproduction. 2016;152(6):R247–R261. doi: 10.1530/REP-16-0391
- de Lima CB, dos Santos ÉC, Ispada J, et al. The dynamics between in vitro culture and metabolism: embryonic adaptation to environmental changes. Sci Rep. 2020;10(1): Article 1. doi: 10.1038/s41598-020-72221-1
- Hufnagel A, Grant ID, Aiken CEM. Glucose and oxygen in the early intrauterine environment and their role in developmental abnormalities. Seminars In Cell & Developmental Biology. 2022;131:25–34. doi: 10.1016/j.semcdb.2022.03.041
- el Hajj N, Haaf T. Epigenetic disturbances in in vitro cultured gametes and embryos: implications for human assisted reproduction. Fertil Sterility. 2013;99(3):632–641. doi: 10.1016/j.fertnstert.2012.12.044
- FC Lopes A. Mitochondrial metabolism and DNA methylation: a review of the interaction between two genomes. Clin Epigenetics. 2020;12(1):182. doi: 10.1186/s13148-020-00976-5
- Milazzotto MP, Lima CBD, Fonseca Junior AMD, et al. Erasing gametes to write blastocysts: metabolism as the new player in epigenetic reprogramming. Anim Reprod. 2020;17(3):e20200015. doi: 10.1590/1984-3143-ar2020-0015
- Ross PJ, Canovas S. Mechanisms of epigenetic remodelling during preimplantation development. Reprod Fertil Dev. 2016;28(1–2):25–40. doi: 10.1071/RD15365
- Milazzotto MP, Lima CBD, Ispada J, et al. Metabolism-epigenetic interactions on in vitro produced embryos. Reprod Fertil Dev. 2022;35(2):84–97. doi: 10.1071/RD22203
- Stoccoro A, Coppedè F. Mitochondrial DNA methylation and human diseases. Int J Mol Sci. 2021;22(9):4594. Article 9. doi: 10.3390/ijms22094594
- Sirard M-A. Distribution and dynamics of mitochondrial DNA methylation in oocytes, embryos and granulosa cells. Sci Rep. 2019;9(1):1–10. doi: 10.1038/s41598-019-48422-8
- de Lima CB, Sirard M-A. Mitoepigenetics: methylation of mitochondrial DNA is strand-biased in bovine oocytes and embryos. Reproduct Domestic Animals. 2020;55(10):1455–1458. doi: 10.1111/rda.13786
- Parrish JJ, Susko-Parrish J, Winer MA, et al. Capacitation of bovine sperm by heparin. Biol Reprod. 1988;38(5):1171–1180. doi: 10.1095/biolreprod38.5.1171
- Santos ÉCD, Fonseca Junior AMD, Lima CBD, et al. Less is more: reduced nutrient concentration during in vitro culture improves embryo production rates and morphophysiology of bovine embryos. Theriogenology. 2021;173:37–47. doi: 10.1016/j.theriogenology.2021.07.010
- Podlesniy P, Trullas R. Absolute measurement of gene transcripts with Selfie-digital PCR. 2017;Sci Rep. 7(1): Article 1. doi: 10.1038/s41598-017-08270-w
- Cao K, Lv W, Wang X, et al. Hypermethylation of hepatic mitochondrial ND6 provokes systemic insulin resistance. Adv Sci. 2021;8(11):2004507. Weinheim, Baden-Wurttemberg, Germany. doi: 10.1002/advs.202004507
- Mishra M, Kowluru RA. Epigenetic modification of mitochondrial DNA in the development of diabetic retinopathy. Invest Ophthalmol Visual Sci. 2015;56(9):5133–5142. doi: 10.1167/iovs.15-16937
- Bolger AM, Lohse M, Usadel B. Trimmomatic: A flexible trimmer for Illumina sequence data. Bioinformatics (Oxford, England). 2014;30(15):2114–2120. doi: 10.1093/bioinformatics/btu170
- Krueger F, Andrews SR. Bismark: A flexible aligner and methylation caller for Bisulfite-Seq applications. Bioinformatics (Oxford, England). 2011;27(11):1571–1572. doi: 10.1093/bioinformatics/btr167
- Akalin A, Kormaksson M, Li S, et al. methylKit: A comprehensive R package for the analysis of genome-wide DNA methylation profiles. Genome bio. 2012;13(10):R87. doi: 10.1186/gb-2012-13-10-r87
- R Core Team. R: A language and environment for statistical computing. Vienna, Austria: R Foundation for Statistical Computing; 2022. https://www.R-project.org/
- Patil V, Cuenin C, Chung F, et al. Human mitochondrial DNA is extensively methylated in a non-CpG context. Nucleic Acids Res. 2019;47(19):10072–10085. doi: 10.1093/nar/gkz762
- Goldsmith C, Rodríguez-Aguilera JR, El-Rifai I, et al. Low biological fluctuation of mitochondrial CpG and non-CpG methylation at the single-molecule level. Sci Rep. 2021;11(1): Article 1. 10.1038/s41598-021-87457-8
- Liu B, Du Q, Chen L, et al. CpG methylation patterns of human mitochondrial DNA. Sci Rep. 2016;6(1): Article 1. 10.1038/srep23421
- Zeng Y, Chen T. DNA methylation reprogramming during mammalian development. Genes (Basel). 2019;10(4):257. doi: 10.3390/genes10040257
- Nagaraj R, Sharpley MS, Chi F, et al. Nuclear Localization of Mitochondrial TCA Cycle Enzymes as a Critical Step in Mammalian Zygotic Genome Activation. Cell. 2017;168(1–2):210–223.e11. doi: 10.1016/j.cell.2016.12.026
- Hamatani T, MSh K, Yamada M et al, Global gene expression profiling of preimplantation embryos. Hum Cell. 2006;19:98–117. doi: 10.1111/j.1749-0774.2006.00018.x
- Jeanblanc M, Salvaing J, Mason K. et al. Embryonic genome activation. Gynecologie, Obstetrique et Fertilite. 2008;36:1126–1132. doi: 10.1016/j.gyobfe.2008.07.015
- Gardner DK, Harvey AJ. Blastocyst metabolism. Reprod Fertil Dev. 2015;27(4):638–654. doi: 10.1071/RD14421
- Lane M, Gardner DK. Mitochondrial Malate-Aspartate Shuttle Regulates Mouse Embryo Nutrient Consumption. J Biol Chem. 2005;280(18):18361–18367. doi: 10.1074/jbc.M500174200
- Facucho-Oliveira JM, St John JC. The relationship between pluripotency and mitochondrial DNA proliferation during early embryo development and embryonic stem cell differentiation. Stem Cell Rev. 2009;5(2):140–158. doi: 10.1007/s12015-009-9058-0
- St John JC, Facucho-Oliveira J, Jiang Y, et al. Mitochondrial DNA transmission, replication and inheritance: a journey from the gamete through the embryo and into offspring and embryonic stem cells. Human Reproduction Update. 2010;16(5):488–509. doi: 10.1093/humupd/dmq002
- Ebert KM, Liem H, Hecht NB. Mitochondrial DNA in the mouse preimplantation embryo. J Reprod Fertil. 1988;82(1):145–149. doi: 10.1530/jrf.0.0820145
- El Shourbagy SH, Spikings EC, Freitas M, et al. Mitochondria directly influence fertilisation outcome in the pig. Reproduction. 2006;131(2):233–245. doi: 10.1530/rep.1.00551
- Kameyama Y, Filion F, Yoo JG, et al. Characterization of mitochondrial replication and transcription control during rat early development in vivo and in vitro. Reproduction. 2007;133(2):423–432. doi: 10.1530/REP-06-0263
- Filograna R, Mennuni M, Alsina D, et al. Mitochondrial DNA copy number in human disease: the more the better? FEBS Lett. 2021;595(8):976–1002. doi: 10.1002/1873-3468.14021
- Kowal K, Tkaczyk A, Ząbek T, et al. Comparative analysis of CpG sites and islands distributed in mitochondrial DNA of model organisms. Animals (Basel). 2020;10(4):665. doi: 10.3390/ani10040665
- Bogenhagen DF. Mitochondrial DNA nucleoid structure. Biochim Biophys Acta Gene Regul Mech. 2012;1819(9–10):914–920. doi: 10.1016/j.bbagrm.2011.11.005
- D’Souza AR, Minczuk M, Garone C, et al. Mitochondrial transcription and translation: overview. Essays Biochem. 2018;62(3):309–320. doi: 10.1042/EBC20170102
- Taanman J-W. The mitochondrial genome: structure, transcription, translation and replication. Biochim Biophys Acta Bioenerg. 1999;1410(2):103–123. doi: 10.1016/S0005-2728(98)00161-3
- Shayevitch R, Askayo D, Keydar I, et al. The importance of DNA methylation of exons on alternative splicing. RNA. 2018;24(10):1351–1362. doi: 10.1261/rna.064865.117
- Armstrong DA, Green BB, Blair BA, et al. Maternal smoking during pregnancy is associated with mitochondrial DNA methylation. Environ Epigenet. 2016;2(3):dvw020. doi: 10.1093/eep/dvw020
- Jia L, Li J, He B, et al. Abnormally activated one-carbon metabolic pathway is associated with mtDNA hypermethylation and mitochondrial malfunction in the oocytes of polycystic gilt ovaries. Sci Rep. 2016;6(1):1–11. doi: 10.1038/srep19436
- Novielli C, Mandò C, Tabano S, et al. Mitochondrial DNA content and methylation in fetal cord blood of pregnancies with placental insufficiency. Placenta. 2017;55:63–70. doi: 10.1016/j.placenta.2017.05.008
- Yue Y, Ren L, Zhang C, et al. Mitochondrial genome undergoes de novo DNA methylation that protects mtDNA against oxidative damage during the peri-implantation window. Proc Natl Acad Sci USA. 2022;119(30):e2201168119. doi: 10.1073/pnas.2201168119