
ABSTRACT
The current study was designed to use an epigenome-wide association approach (EWAS) to identify potential systemic DNA methylation alterations that are associated with obesity using 22 discordant twin pairs. Buccal cells (from a cheek swab) were used as a non-obesity relevant purified marker cell for the epigenetic analysis. Analysis of differential DNA methylation regions (DMRs) was used to identify epigenetic associations with metabolic and dietary measures related to obesity with discordant twins. An edgeR analysis provided a DMR signature with p < 1e-04, but statistical significance was reduced due to low sample size and known multiple origins of obesity. A weighted gene coexpression network analysis (WGCNA) was performed and identified modules (p < 0.005) of epigenetic sites that correlated with different metabolic and dietary measures. The DMR and WGCNA epigenetic sites were near genes (e.g., CIDEC, SPP1, ZFPG9, and POMC) with previously identified obesity associated pathways (e.g., metabolism, cholesterol, and fat digestion). Observations demonstrate the feasibility of identifying systemic epigenetic biomarkers for obesity, which can be further investigated for clinical relevance in future research with larger sample sizes. The availability of a systemic epigenetic biomarker for obesity susceptibility may facilitate preventative medicine and clinical management of the disease early in life.
KEY HIGHLIGHTS
Analysis of differential DNA methylation regions (DMRs) was used to identify epigenetic associations with metabolic and dietary measures related to obesity with discordant twins.
A weighted genome coexpression network analysis (WGCNA) was performed and identified modules of epigenetic sites that correlated with different metabolic and dietary measures.
Observations demonstrate the feasibility of identifying systemic epigenetic biomarkers for obesity, which can be further investigated for clinical relevance in future research with larger sample sizes.
The availability of a systemic epigenetic biomarker for obesity susceptibility may facilitate preventative medicine and clinical management of the disease early in life.
Introduction
No nation has been spared from the worldwide obesity epidemic [Citation1], with some countries like the United States having a prevalence near 50% of the adult population [Citation2,Citation3]. Nutrition and exercise are cornerstones of obesity prevention and treatment efforts, but an increased susceptibility for obesity (e.g., obesity gene alterations) in some individuals and populations has also been observed [Citation2]. Environmental epigenetics is known to have a critical role in metabolic disease and obesity [Citation4,Citation5]. For example, the role of epigenetic transgenerational inheritance of obesity susceptibility has been observed in several populations [Citation2,Citation5,Citation6], including humans [Citation7–10].
Epigenetics is defined as ‘molecular factors and processes around DNA that regulate genome activity, independent of DNA sequence, and are mitotically stable’ [Citation11]. The processes include DNA methylation, histone modifications, chromatin structure, non-coding RNA (ncRNA), and RNA methylation [Citation11,Citation12]. Epigenetics is critical for early developmental processes of all organisms, and each cell type has unique cell-specific epigenetics to establish the cell specificity identity and function [Citation13,Citation14]. Environmental factors impact early development more dramatically due to epigenetic programming. The developmental origins of health and disease (DOHAD) hypothesis for pathologies such as obesity involve alterations in epigenetics [Citation15].
Epigenetics has evolved in part as a mechanism for the environment to alter genome activity, given DNA sequence is not environmentally responsive [Citation11,Citation16]. Nearly all environmental factors from temperature to nutrition can alter developmental epigenetic programming and subsequent related gene expression [Citation17]. When epigenetic programming impacts the germline (sperm or egg), this can impact the physiology and disease susceptibility of subsequent generations through epigenetic inheritance [Citation11,Citation18]. When this epigenetic inheritance is transmitted to generations without direct exposure impacts, this is defined as epigenetic transgenerational inheritance [Citation17,Citation18]. This non-genetic form of inheritance is the primary mechanism for the environment to impact a population's phenotypic variation or pathology [Citation17]. When epigenetic inheritance occurs the germline transmission to stem cells in the embryo subsequently impacts all developing somatic cell types to cause systemic effects in all cells and tissues [Citation11]. These systemic effects can be assessed in non-relevant cell types and used to diagnose disease susceptibility and allow for improved clinical management of the pathology.
Twin studies are an ideal experimental approach to help control for genetic background impacts on phenotypic or disease conditions [Citation19]. Many twins develop discordant diseases and phenotypes later in life through environmental and behavioural factors acting through epigenetics as the molecular mechanism that regulates these discordant conditions [Citation19]. Therefore, epigenetic biomarkers for early life environmental impacts on later life disease have been identified for pathologies such as arthritis [Citation20], preterm birth [Citation21], paternal transmission of autism susceptibility [Citation22], and male infertility [Citation23], among others. The current study was designed to identify systemic alterations in buccal cells to develop a potential biomarker for obesity susceptibility. Although the buccal cell are not relevant to obesity etiology, it can be used as a systemic biomarker cell to assess obesity susceptibility.
The goal and logic of the current study was to identify potential systemic epigenetic associations or ‘signatures’ for obesity susceptibility using twins discordant on obesity status (i.e., one twin has normal weight and the co-twin is obese). Twin studies are ideal to control for genetic differences and twin discordance allows for ideal control for the absence or presence of the disease [Citation24]. However, genetic mutations associated with twins or general population studies occur at low frequencies of only a few percent of the population [Citation25,Citation26]. Therefore, the current study used a twin study to do an epigenome-wide association study (EWAS) for obesity. Since each cell type has a unique epigenetics, purified cell populations are required for epigenetic analysis [Citation13]. We used buccal cells from a cheek swab for the systemic epigenetic analysis in the present study, because they are one of the easiest purified cell populations to collect for humans. Buccal cell swabs are greater than 90% pure, with the primary contaminant being bacterial cells and immune cells [Citation27]. DNA methylation is very stable and found to be useful for the identification of systemic epigenetic biomarkers associated with various pathologies [Citation20,Citation21]. Homozygotic and heterozygotic twin pairs who were discordant on obesity status using standard body mass index (BMI, kg/m2) measures from the Washington State Twin Registry (WSTR) were used for the primary analysis. We also examined waist size and nutritional factors as additional parameters. Since genetic variation is not anticipated to impact environmental epigenetics, the comparisons of homozygotic and heterozygotic twins were not anticipated to show differences and correlations of the twins could be made. The objective was to identify potential systemic epigenetic biomarkers for obesity susceptibility in humans. The current study was not designed to use an obesity relevant cell to assess obesity etiology but instead used a non-relevant cell to assess systemic epigenetic alterations. Observations allow the potential contributions of epigenetic inheritance and early life developmental origins in obesity to be considered.
Results
Descriptive information for selected characteristics of the study participants are presented in by zygosity, sex, and BMI category. The participants were on average 41.7 ± 12.0 years, 54.5% female, and all participants identified as non-Hispanic White. The majority of the participants were married or living with a partner (63.6%). The average BMI for normal weight twins was 24.3 ± 2.1 kg/m2, while the average BMI for obese twins was 35.3 ± 4.6 kg/m2. The average BMI difference within pairs was 8.9 ± 3.2 kg/m2 for homozygotic twins and 13.4 ± 5.1 kg/m2 for heterozygotic twins. Waist circumference was 33.2 ± 3.4 inches for normal weight twins and 43.6 ± 6.2 inches for obese twins. Normal twins averaged 135.0 ± 125.4 min of neighbourhood walking and 136.8 ± 92.8 min of moderate-to-vigorous physical activity (MVPA) weekly. Obese twins averaged 107.7 ± 127.6 min of neighbourhood walking and 89.1 ± 93.0 min of MVPA weekly ().
Table 1. Descriptive statistics for selected demographic characteristics and outcome measures among discordant twins.
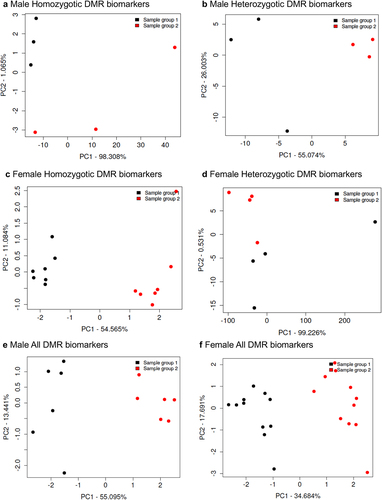
Buccal cell swabs were collected as outlined in the Methods section and shipped to the laboratory for analysis and are summarized in Supplemental Table S1. DNA was extracted from the samples for subsequent epigenetic analysis. The twin samples for each homozygotic, heterozygotic, male, and female are presented in Supplemental Table S1. Methylated DNA immunoprecipitation (MeDIP) was performed on the buccal cell DNA samples. The MeDIP was followed by DNA sequencing (MeDIP-Seq) by the Washington State University Genomics Core Laboratory, Spokane, WA. Differential DNA methylation regions (DMRs) were identified as outlined in the Methods and previously described [Citation28]. The DMRs were identified for homozygous males and females, heterozygous males and females, and all males and females combined (). The DMRs at edgeR p-value of p < 1e-04 were selected for subsequent analysis, but various edgeR p-value DMR numbers are listed to provide better context for the DMR analysis (). The majority of DMRs involve a single 1 kb window, but the heterozygous twin pairs had some multiple 1 kb window DMRs (). The genomic locations of the DMRs at edgeR p < 1e-04 are presented in for all the datasets and demonstrate a genome-wide distribution of DMRs. The genomic features of the DMRs demonstrated a CpG density of one or two CpG/100 bp and DMR length of predominantly 1 kb for all the datasets for both male and female twins, . A principal component analysis for each of the datasets using the specific DMR sites shows good separation between both the male and female discordant twins, .
Figure 1. DMR identification. the number of DMRs found using different p-value cut-off thresholds. The all-window column shows all DMRs. The multiple window column shows the number of DMRs containing at least two nearby significant windows (1 kb each). The number of DMRs with the number of significant windows (1 kb per window) at a p-value threshold of p < 1e-04 for DMR is bolded. (a) male homozygotic DMRs; (b) male heterozygotic DMRs; (c) female homozygotic DMRs; (d) female heterozygotic DMRs; (e) male all DMRs; and (f) female all DMRs.
Figure 2. DMR chromosomal locations. the DMR locations on the individual chromosomes are represented with an arrowhead and a cluster of DMRs with a black box. All DMRs containing at least one significant window at a p-value threshold of p < 1e-04 for DMR are shown. (a) male homozygotic DMRs; (b) male heterozygotic DMRs; (c) female homozygotic DMRs; (d) female heterozygotic DMRs; (e) male all DMRs; and (f) female all DMRs. The chromosome number versus size (megabase) is presented.
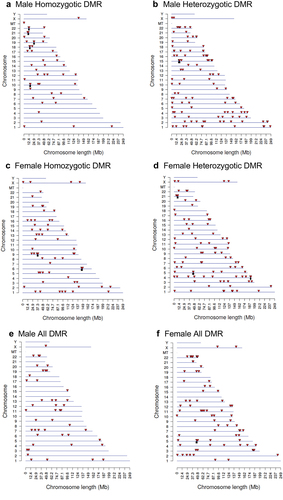
Figure 3. DMR genomic features CpG density and length. (a) male homozygotic CpG density; (b) male homozygotic DMR length; (c) male heterozygotic CpG density; (d) male heterozygotic DMR length; (e) female homozygotic CpG density; (f) female homozygotic DMR length; (g) female heterozygotic CpG density; (h) female heterozygotic DMR length; (i) male all CpG density; (j) male all DMR length; (k) female all CpG density; and (l) female all DMR length.
Figure 4. DMR principal component analysis. (a) male homozygotic DMRs; (b) male heterozygotic DMRs; (c) female homozygotic DMRs; (d) female heterozygotic DMRs; (e) male all DMRs; and (f) female all DMRs.
The DMR name, genome location, CpG density, edgeR p-value statistical significance, and gene associations are all presented for each discordant twin comparison for males and females in Supplemental Tables S2-S5. A Venn diagram at edgeR p < 1e-04 demonstrated negligible overlap between the DMR for the different twin pairs for male or female, . An extended overlap with a comparison of the edgeR p < 1e-04 DMR and a p < 0.05 DMR comparison is presented in . Negligible overlap was observed between the male and female DMR datasets. There was also negligible overlap between the heterozygotic versus homozygotic for the male or female data sets, as well as for all DMR datasets for each of the sexes, . When the male and female data were combined for homozygotic and heterozygotic twins, the overlaps did not improve. Therefore, the DMRs identified for the discordant male or female twins were predominantly distinct for both the heterozygotic and homozygotic twins. When the DMR associated genes presented in Supplemental Table S2-S5 were examined for each of the datasets, both the male and female DMR associated genes had links with previously identified obesity associated genes.
Figure 5. Discordant DMR overlaps. (a) DMR p < 1e-04 venn diagram overlap. (b) female all DMR p < 1e-04 venn diagram overlap. (c) male all DMR p < 1e-04 venn diagram overlap. (d) extended overlaps with p < 1e-04 and p < 0.05 comparisons. DMR number and percent (%) overlap presented within the rows.
Although the DMR analysis for all twins combined identified common DMRs between the heterozygous and homozygous datasets for each sex, the edgeR p < 1e-04 used for the DMR analysis when further analysed with a more classic false discovery rate (FDR) showed low significance. The datasets had an FDR of >0.1 for the majority of DMRs. Few DMRs, approximately 2% and 6% for the male heterozygous, had FDR < 0.1. Therefore, the statistical analysis of the DMR analysis suggests a low significance with FDR considered. As shown in , the sample size is limited with n = 5 homozygous male, n = 5 heterozygous male, n = 7 homozygous female, and n = 5 heterozygous female pairs for each group, Supplemental Table S1. For the DMR male or female twin analysis, a paired discordant twin procedure was used which involved n = 3 homozygotic male, n = 3 heterozygotic male, n = 7 homozygotic female, and n = 4 heterozygotic female pairs for each group, . Since genetics will not impact the epigenetics dramatically, a combination of the homozygotic and heterozygotic twins was used. An unpaired analysis with all twins within the groups had an FDR of >0.1 for most sites. Due to the FDR limitation with the DMR analysis comparison of groups, an alternate approach using weighted genome co-expression network analysis (WGCNA) was used [Citation29]. The WGCNA was originally designed for gene expression data but recently has been used for epigenetic data as well [Citation30]. This WGCNA analysis identifies within the dataset networks of genes or epigenetic sites that correlate with specific parameters within the population analysed. For the WGCNA analysis, twin pairings are not considered with each participant considered independent. The male or female combination of homozygotic and heterozygotic twins using WGCNA identified different modules of different epigenetic sites that were identified with a specific color (colored modules) and correlated them with physiological parameters, providing correlation coefficients and statistics (). The module correlations with parameters with a black box boundary identified p-values and correlation coefficients that have high significance of p < 1e-04 to p < 1e-07. A summary of the analysis of DMR-associated genes from the male or female homozygous and heterozygous groups was made and is shown in . For both zygosities, sex and age had the highest correlations among the parameters measured, as in the DMR analysis. Marital status (marstat), number of living children, and physical activity-related measures including walk score, neighbourhood walk time, and moderate to vigorous physical activity MVPA correlated with the non-obese and obese twin pairs. The obesity parameters of BMI and waist circumference, as well as diet parameters of servings of soda, servings of caffeine, and fast-food servings per week, were correlated with WGCNA modules in males (). For females, waist circumference, BMI, soda servings, and caffeine servings all correlated with identified modules (). For males, energy drink servings and fast-food servings correlated. Therefore, both male and female discordant twins had WGCNA measures associated with obesity parameters. The fast-food obesity-associated (p < 4e-04) gene associations for male twins in the tan module were near the CIDEC gene, and the soda servings obesity-associated (p < 6e-04) gene for female twins in the rosy-brown module was near the SPP1 gene. Therefore, the WGCNA analysis identified correlations, epigenetic sites, and associations with some obesity genes between the discordant groups.
Figure 6. Female WGCNA module-traits correlations p < 0.005. rows and columns removed if no correlation met threshold.
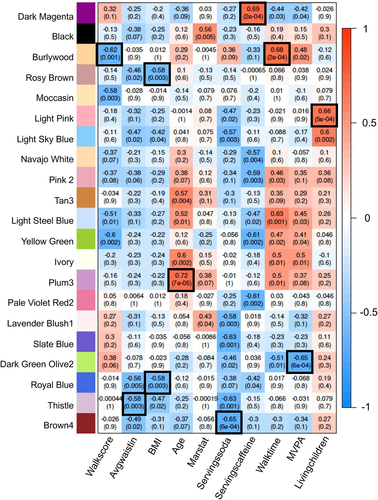
Figure 7. Male WGCNA module-traits correlations p < 0.01. rows and columns removed if no correlation met threshold.
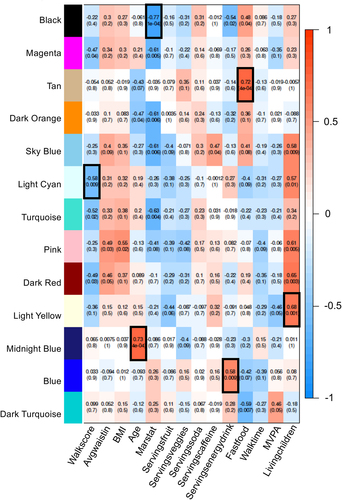
Figure 8. DMR associations with obesity genes. (a) DMR associated gene categories. (b) male DMR obesity associated genes. (c) female DMR obesity associated genes.
Discussion
Over the past several decades, there has been a dramatic increase in the prevalence of obesity within nearly all human populations [Citation31]. Although this clearly is in part due to nutrition and activity levels, the heritability of or ‘susceptibility’ to develop obesity is also a major contributor to these trends. Epigenetics and epigenetic transgenerational inheritance have been observed and associated with obesity in a number of species including humans [Citation2,Citation32]. An example of an experimental mammalian study is the exposure of a gestating rat to DDT (dichlorodiphenyltrichloroethane) during gonadal sex determination in the fetus followed by the birth of the F1 generation offspring, then propagation to the F2 grand-offspring and finally F3 generation great-grand-offspring. The only generation exposed was the gestating female F0 generation, yet observations demonstrated dramatic (>50% population) increased obesity in the F3 generation, which is the first transgenerational generation [Citation33]. The ability of environmental toxicants such as DDT to promote the epigenetic transgenerational inheritance of obesity, three generations removed from the exposure, suggests generational toxicology is also a significant factor in obesity etiology [Citation2,Citation34]. Twin studies have also shown discordance in DMRs, with correlations to measures of diet and physical activity [Citation35]. The current study was designed to use a twin study with discordance in obesity to assess systemic epigenetic alterations between the twins. The objective was to identify a potential systemic epigenetic biomarker for obesity susceptibility.
The experimental design used a biomarker cell that is not directly involved in the etiology of obesity, but that is related to a systemic effect on the individuals’ developmental epigenetics. The buccal cell is an easily isolated and purified (i.e., greater than 90%) cell population that can be used to assess epigenetic biomarkers for pathology and phenotypic variations [Citation20,Citation21]. Observations further support the use of biomarker cells such as buccal cells for disease and phenotypic change susceptibility in the populations studied.
The twin homozygotic and heterozygotic samples used were discordant for obesity. Although the discordant sample sets were not large, an epigenetic analysis was used to identify potential epigenetic biomarkers for obesity susceptibility. Males and females were analysed separately due to the dramatic differences in epigenetics between the sexes [Citation36]. The differential DNA methylation region (DMR) analysis between the obese and non-obese twins identified DMRs for the different comparisons and the genomic features of the DMRs. A PCA and gene associations were also supportive of the obesity biomarker. However, the false discovery rate (FDR) was primarily >0.1, so the statistical confidence of these DMRs is poor. Independently, the present study provides ‘proof of concept’ that such epigenetic biomarkers may be identified in larger sample populations. An additional analysis was also performed to potentially support the DMR analysis. The alternate procedure was a weighted co-expression network analysis (WGCNA) that uses the genomic information with all samples in a dataset to identify correlations [Citation29]. The WGCNA has been used in previous studies for epigenetic analysis to correlate epigenetic modifications with phenotypic information [Citation37]. The WGCNA was also performed on the male and female samples separately due to the dramatic sex differences in epigenetics. A number of correlated epigenetic modules (p < 0.005) were identified for obesity measures within the comparison of the obese and non-obese twins examined. Nutritional factors such as fast-food servings per week and soda servings per week were also correlated. The correlated modules contained sites near genes associated with obesity. This includes the male tan module gene CIDEC and female rosy brown module gene SPP1. For the DMR analysis, the male heterozygotic DMR obesity gene ZFP69 and female homozygotic DMR obesity gene POMC correlated. Therefore, the WGCNA was supportive of the DMR analysis correlations, but both analyses suggest larger numbers of twin pairs would likely enhance the observations made. Since the buccal cell is not relevant to obesity etiology, more extensive gene associations were not investigated. Associated gene categories and pathways are presented, , and all specific DMR associated genes identified in Supplemental Tables S2-S5.
The development and use of early-stage biomarkers for disease susceptibility suggests that preventative lifestyle and therapeutic approaches could be used to facilitate a prevention medicine approach. The reactionary medicine approach used today is useful to treat disease, but the detection of disease prior to its development is more powerful in terms of reducing morbidity and mortality from chronic diseases. Twin studies assist in the control for genetic and shared environmental factors to allow more efficient assessment of epigenetic disease associations in twins who are discordant for conditions of interest [Citation38]. In this obesity focused study, a statistically significant epigenetic biomarker was not identified with the DMR analysis. This is likely due to the low sample size, but also likely because obesity is a multifaceted condition. Therefore, different causal factors and origins of obesity would create potential epigenetic variation between individuals. The multiple origins must be considered and that may ultimately interfere in the identification of an epigenetic biomarker. This information also supports the need for large patient sample studies to assess the various components of the disease in the investigation of epigenetic biomarkers.
The current pilot study demonstrates that the identification of systemic epigenetic biomarkers for obesity susceptibility is feasible, but further analysis with larger sample sizes will be required to obtain a statistically significant signature of DMRs. The WGCNA analysis also supported the identification of epigenetic sites associated with obesity and nutritional measures within the normal weight and obese groups. Both analyses identified obesity-associated genes that support the observations presented. Since metabolic syndrome and obesity are multifaceted and complex, multifaceted disease correlations with epigenetic alterations may be complex. This suggests that a higher epigenetic variation within diseases, such as obesity, requires increased sample size compared with other less complex pathologies. Further analysis will help establish this potential epigenetic variation.
Considering the limitations discussed, the current study does support the feasibility of epigenetic biomarkers for obesity susceptibility. Such epigenetic biomarkers could potentially be used to identify the susceptibility to obesity later in life such that preventative lifestyle changes and therapeutics could be considered. A preventative medicine approach to conditions such as metabolic syndrome and obesity will be significantly enhanced with the availability of epigenetic biomarkers for disease. In addition, the identification of such systemic epigenetic alterations that are associated with disease provides a better understanding of the etiology of obesity and suggests a potential role for epigenetic inheritance and early life developmental origins of obesity. Clearly, obesity etiology will involve a combination of environmental and behavioural factors, as well as genetics and epigenetics.
Methods
Twin clinical sample collection and information
Participants in this study were homozygotic and heterozygotic twins recruited from the community-based Washington State Twin Registry (WSTR). Recruitment procedures and details about the WSTR have been described elsewhere [Citation39]. Identical and same-sex fraternal twins were eligible for participation in this study. We identified a potential pool of 311 twin pairs using previously collected data on BMI. Twins were sent an invitation letter which included a link to complete an online screening questionnaire. For those who did not respond to the online questionnaire, a study coordinator followed up with a phone call to determine interest and eligibility. Inclusion criteria for study eligibility included absence of any gastro-intestinal conditions, not taking prescription medications that would impact the gut microbiome, not taking medications for obesity, one twin having a normal BMI (18–24.9) and the other having an obese BMI (≥30), and not pregnant. Due to the stringent inclusion criteria, 41% of twins contacted were ineligible for the study. A total of 22 pairs of twins were enrolled in the study and completed all study procedures. The study protocol was approved by the WSU Institutional Review Board (#16509), and informed written consent was obtained from all participants prior to receiving the study materials.
Once the study coordinator determined that a twin pair was eligible for the study, they were sent a kit to collect data at home. Materials included a stool collection kit (for the gut microbiome, not included in the present analysis), a buccal brush for DNA collection, a tape measure to measure waist circumference, questionnaires, and prepaid shipping materials to return the samples and questionnaires. The materials were returned to Washington State University after data collection was completed. Every attempt was made to obtain the highest number of study samples from the WSTR.
DNA preparation
Frozen human buccal samples were thawed for analysis. As previously discussed, the purity of the buccal cell population was >90%, and contaminating bacterial cells were removed from the molecular analysis. Genomic DNA from buccal samples was prepared as follows: The buccal brush was suspended in 750 μl of cell lysis solution and 3.5 µl of Proteinase K (20 mg/ml). This suspension was incubated at 55°C for 3 h, then vortexed and centrifuged briefly. The lysis solution was then transferred to a new 1.5 µl microcentrifuge tube. The microcentrifuge tube with the buccal brush was centrifuged again to retain any remaining solution which was combined with the transferred lysis solution. The buccal brush was discarded, and 300 µl of protein precipitation solution (Promega, A795A, Madison, WI) was added to the lysis solution. The sample was incubated on ice for 15 min, then centrifuged at 4 C for 30 min. The supernatant was transferred to a fresh 2 mL microcentrifuge tube and 1,000 µl ice-cold isopropanol was added along with 2 µL glycoblue. This suspension was mixed thoroughly and incubated at −20°C overnight. The suspension was then centrifuged at 4°C for 20 min, the supernatant was discarded, and the pellet was washed with 75% ethanol, then air-dried and resuspended in 100 μl H2O. DNA concentration was measured using the Nanodrop (Thermo Fisher, Waltham, MA).
Methylated DNA immunoprecipitation (MeDIP)
Methylated DNA Immunoprecipitation (MeDIP) is an optimal procedure compared to other analyses [Citation28], and genomic DNA was performed as follows: individual DNA samples (2–4 ug of total DNA) were diluted to 130 μl with 1× Tris-EDTA (TE, 10 mM Tris, 1 mM EDTA) and sonicated with the Covaris M220 using the 300 bp setting. Fragment size was verified on a 2% E-gel agarose gel. The sonicated DNA was transferred from the Covaris tube to a 1.7 ml microfuge tube, and the volume was measured. The sonicated DNA was then diluted with TE buffer (10 mM Tris HCl, pH7.5; 1 mM EDTA) to 400 μl, heat-denatured for 10 min at 95 C, then immediately cooled on ice for 10 min. Then, 100 μl of 5X IP buffer and 5 μg of antibody (monoclonal mouse anti-5-methyl cytidine; Diagenode #C15200006) were added to the denatured sonicated DNA. The DNA-antibody mixture was incubated overnight on a rotator at 4 C. The following day magnetic beads (Dynabeads M-280 Sheep anti-Mouse IgG; 11201D) were pre-washed as follows: The beads were resuspended in the vial, then the appropriate volume (50 μl per sample) was transferred to a microfuge tube. The same volume of Washing Buffer (at least 1 mL 1XPBS with 0.1% BSA and 2 mM EDTA) was added, and the bead sample was resuspended. The tube was then placed into a magnetic rack for 1–2 min, and the supernatant was discarded. The tube was removed from the magnetic rack, and the beads were washed once. The washed beads were resuspended in the same volume of 1X IP buffer (50 mM sodium phosphate ph7.0, 700 mM NaCl, 0.25% TritonX-100) as the initial volume of beads. Fifty microlitres of beads were added to the 500 μl of DNA-antibody mixture from the overnight incubation, then incubated for 2 h on a rotator at 4 C. After the incubation, the bead-antibody-DNA complex was washed three times with 1X IP buffer as follows: The tube was placed into a magnetic rack for 1–2 min and the supernatant was discarded, then the magnetic bead antibody pellet was washed with 1X IP buffer 3 times. The washed bead antibody DNA pellet was then resuspended in 250 μl digestion buffer with 3.5 μl Proteinase K (20 mg/ml). The sample was incubated for 2–3 h on a rotator at 55 C, then 250 μl of buffered Phenol-Chloroform- Isoamyl alcohol solution was added to the sample, and the tube was vortexed for 30 sec and then centrifuged at 14000 rpm for 5 min at room temperature. The aqueous supernatant was carefully removed and transferred to a fresh microfuge tube. Then, 250 μl chloroform was added to the supernatant from the previous step, vortexed for 30 sec and centrifuged at 14000 rpm for 5 min at room temperature. The aqueous supernatant was removed and transferred to a fresh microfuge tube. To the supernatant 2 μl of glycoblue (20 mg/ml), 20 μl of 5 M NaCl and 500 μl ethanol were added and mixed well, then precipitated in −20 C freezer for 1 h to overnight. The precipitate was centrifuged at 14000 rpm for 20 min at 4 C, and the supernatant was removed while not disturbing the pellet. The pellet was washed with 500 μl cold 70% ethanol in −20 C freezer for 15 min then centrifuged again at 14000 rpm for 5 min at 4 C, and the supernatant was discarded. The tube was spun again briefly to collect residual ethanol to the bottom of the tube and as much liquid as possible was removed with gel loading tip. The pellet was air-dried at RT until it looked dry (about 5 min) then resuspended in 20 μl TE. DNA concentration was measured in Qubit (Life Technologies) with ssDNA kit (Molecular Probes Q10212).
MeDIP-Seq analysis
The MeDIP DNA samples (50 ng of each) were used to create libraries for next-generation sequencing (NGS) using the NEBNext Ultra RNA Library Prep Kit for Illumina (San Diego, CA) starting at step 1.4 of the manufacturer’s protocol to generate double-stranded DNA. After this step, the manufacturer’s protocol was followed. Each sample received a separate index primer. NGS was performed at Washington State University (WSU) Spokane Genomics Core using the Illumina HiSeq 2500 with a PE50 application, with a read size of approximately 50bp and approximately 10–27 million reads per sample, and 11 sample libraries each were run in one lane.
Molecular bioinformatics and statistics
Basic read quality was verified using information produced by the FastQC program [Citation40]. Reads were filtered and trimmed to remove low-quality base pairs using Trimmomatic [Citation41]. The reads for each sample were mapped to the GRCh38 human genome using Bowtie2 [Citation42] with default parameter options. The mapped read files were then converted to sorted BAM files using SAMtools [Citation43]. Samples with an overall mapping less than 70% were removed from the DMR analysis along with the corresponding twin samples. To identify DMRs, the reference genome was broken into 1000 bp windows. The MEDIPS R package [Citation44] was used to calculate the differential coverage between control and exposure sample groups. The edgeR p-value [Citation45] was used to determine the relative difference between the two groups for each genomic window. Windows with an edgeR p-value less than 10−4 were considered DMRs. The DMR edges were extended until no genomic window with an edgeR p-value less than 0.1 remained within 1000 bp of the DMR. CpG density and other information were then calculated for the DMR based on the reference genome. DMRs were annotated using the NCBI provided annotations. The genes that overlapped with DMRs were then input into the KEGG pathway search [Citation46,Citation47] to identify associated pathways. The DMR associated genes were then sorted into functional groups by reducing Panther [Citation48] protein classifications into more general categories. All MeDIP-Seq genomic data obtained in the current study have been deposited in the NCBI public GEO database (GEO #: GSE218363). Obesity-related genes were identified using the DisGeNET knowledge platform [Citation49].
Weighted gene coexpression network analysis (WGCNA)
The weighted gene coexpression network analysis (WGCNA) [Citation50] was performed using the WGCNA R package [Citation51]. All samples were considered independent for the WGCNA analyses, so twin pairing was ignored. All MeDIP-Seq genomic windows were ranked by the mean RPKM read depth across all samples. The top 100,000 sites were chosen for inclusion in the analysis. The size of this subset was chosen to allow for a reasonable read depth to be considered and to limit computational requirements. WGCNA is a parameter rich analysis, and only limited exploration of parameter variations was performed. Modules were calculated using the blockwiseModules function with the following parameters: maxBlockSize = 15000, power = 6 (female), 9 (male), TOMType = ‘unsigned,’ minModuleSize = 30, reassignThreshold = 0, and mergeCutHeight = 0.25. The Pearson correlation was calculated for each development stage and module. The p-value for each correlation was calculated using the corPvalueStudent function. Sites within each module were annotated using the same methods as the DMRs.
Author contributions
GED conceived study, funding acquisition, edited manuscript.
AA: patient sample acquisition, data analysis, edited manuscript.
MB: molecular analysis, data analysis, edited manuscript.
EN: sample processing, data analysis, edited manuscript.
DB: bioinformatics, data analysis, edited manuscript.
MKS conceived, data analysis, funding acquisition, wrote and edited manuscript.
Ethics
The study protocol was approved by the Washington State University Institutional Review Board (#16509), and informed written consent was obtained from all participants prior to receiving the study materials. All methods were carried out in accordance with relevant guidelines and regulations.
Supplemental Material
Download Zip (93.6 KB)Acknowledgments
We acknowledge Ms Shelby Tarutis at the Washington State Twin Registry for twin recruitment and sample collection assistance, and we thank the twins who participated in this study. We acknowledge Dr Jennifer L.M. Thorson, Ms Alexandra Korolenko, and Mr Grant Rickard for technical assistance. The current address for Dr Millissia Ben Maamar is TekTeam Medical Consulting, Palo Alto, CA. We acknowledge Ms Heather Johnson for assistance in preparation of the manuscript. We thank the Genomics Core laboratory at WSU Spokane for sequencing data.
Disclosure statement
No potential conflict of interest was reported by the author(s).
Data availability statement
All molecular data have been deposited into the public database at NCBI https://www.ncbi.nlm.nih.gov/geo/ (GEO # GSE218363), and R code computational tools are available at GitHub (https://github.com/skinnerlab/MeDIP-seq) and www.skinner.wsu.edu.
Supplementary material
Supplemental data for this article can be accessed online at https://doi.org/10.1080/15592294.2023.2268834.
Additional information
Funding
References
- Payab M, Tayanloo-Beik A, Falahzadeh K, et al. Metabolomics prospect of obesity and metabolic syndrome; a systematic review. J Diabetes Metab Disord. 2022;21(1):889–18. doi: 10.1007/s40200-021-00917-w
- King SE, Skinner MK. Epigenetic transgenerational inheritance of obesity susceptibility trends Endocrinol Metab. Trends Endocrinol Metab. 2020;31(7):478–494. doi: 10.1016/j.tem.2020.02.009
- Qasim A, Turcotte M, de Souza RJ, et al. On the origin of obesity: identifying the biological, environmental and cultural drivers of genetic risk among human populations. Obes Rev. 2018;19(2):121–149. doi: 10.1111/obr.12625
- Prasad M, Rajagopal P, Devarajan N, et al. A comprehensive review on high -fat diet-induced diabetes mellitus: an epigenetic view. J Nutr Biochem. 2022;107:109037. doi: 10.1016/j.jnutbio.2022.109037
- Shioda K, Odajima J, Blumberg B, et al. Transgenerational transcriptomic and DNA methylome profiling of mouse fetal testicular germline and somatic cells after exposure of pregnant mothers to Tributyltin, a potent Obesogen. Metabolites. 2022;12(2):95. doi: 10.3390/metabo12020095
- Panera N, Mandato C, Crudele A, et al. Genetics, epigenetics and transgenerational transmission of obesity in children. Front Endocrinol. 2022;13:1006008. doi: 10.3389/fendo.2022.1006008
- Nuttman-Shwartz O. The long-term effects of living in a shared and continuous traumatic reality: the case of Israeli families on the border with gaza. Trauma Violence Abuse. 2023;24(3):1387–1404. doi: 10.1177/15248380211063467
- Gonzalez-Rodriguez P, Fullgrabe J, Joseph B. The hunger strikes back: an epigenetic memory for autophagy. Cell Death Diff. 2023;30(6):1404–1415. doi: 10.1038/s41418-023-01159-4
- Watkins SH, Iles-Caven Y, Pembrey M, et al. Grandmaternal smoking during pregnancy is associated with differential DNA methylation in peripheral blood of their grandchildren. Eur J Hum Genet. 2022;30(12):1373–1379. doi: 10.1038/s41431-022-01081-2
- Richards Steed R, Bakian AV, Smith KR, et al. Evidence of transgenerational effects on autism spectrum disorder using multigenerational space-time cluster detection. Int J Health Geogr. 2022;21(1):13. doi: 10.1186/s12942-022-00313-4
- Nilsson E, Sadler-Riggleman I, Skinner MK, et al. Environmentally induced epigenetic transgenerational inheritance of disease. Environ Epigenet. 2018;4(2):1–13, dvy016. doi: 10.1093/eep/dvy016
- Ben Maamar M, Sadler-Riggleman I, Beck D, et al. Alterations in sperm DNA methylation, non-coding RNA expression, and histone retention mediate vinclozolin-induced epigenetic transgenerational inheritance of disease. Environ Epigenet. 2018;4(2):1–19, dvy010. doi: 10.1093/eep/dvy010
- Skinner MK. Environmental epigenetic transgenerational inheritance and somatic epigenetic mitotic stability epigenetics: official. J DNA Methylation Society. 2011;6(7):838–842.
- Al-Mousawi J, Boskovic A. Transcriptional and epigenetic control of early life cell fate decisions. Curr Opin Oncol. 2022;34(2):148–154. doi: 10.1097/CCO.0000000000000814
- Hoffman DJ, Powell TL, Barrett ES, et al. Developmental origins of metabolic diseases. Physiol Rev. 2021;101(3):739–795. doi: 10.1152/physrev.00002.2020
- Skinner MK, Nilsson EE. Role of environmentally induced epigenetic transgenerational inheritance in evolutionary biology: unified evolution theory. Environ Epigenet. 2021;7(1):1–12. dvab012. doi: 10.1093/eep/dvab012.
- Paugh JR, Nguyen T, Sasai A, et al. The efficacy of clinical tests to diagnose evaporative dry eye disease related to meibomian gland dysfunction. J Ophthalmol. 2022;2022:3889474. doi: 10.1155/2022/3889474
- Anway MD, Cupp AS, Uzumcu M, et al. Epigenetic transgenerational actions of endocrine disruptors and male fertility. Science. 2005;308(5727):1466–1469. doi: 10.1126/science.1108190
- Petronis A, Gottesman II, Kan P, et al. Monozygotic twins exhibit numerous epigenetic differences: clues to twin discordance? Schizophr Bull. 2003;29(1):169–178. doi: 10.1093/oxfordjournals.schbul.a006988
- Craig G, Kenny H, Nilsson E, et al. Epigenome association study for DNA methylation biomarkers in buccal and monocyte cells for female rheumatoid arthritis scientific reports. Sci Rep. 2021;11(1):23789. doi: 10.1038/s41598-021-03170-6
- Winchester P, Nilsson E, Beck D, et al. Preterm birth buccal cell epigenetic biomarkers to facilitate preventative medicine. Sci Rep. 2022;12(1):3361. doi: 10.1038/s41598-022-07262-9
- Garrido N, Cruz F, Rivera Egea R, et al. Sperm DNA methylation epimutation biomarker for paternal offspring autism susceptibility. Clin Epigenetics. 2021;13(6):1–13. doi: 10.1186/s13148-020-00995-2
- Luján S, Caroppo E, Niederberger C, et al. Sperm DNA methylation epimutation biomarkers for male infertility and FSH therapeutic responsiveness. Sci Rep. 2019;9(1):16786. doi: 10.1038/s41598-019-52903-1
- Kaidesoja M, Aaltonen S, Bogl LH, et al. FinnTwin16: a longitudinal study from age 16 of a population-based Finnish twin cohort. Twin Res Hum Genet. 2019;22(6):530–539. doi: 10.1017/thg.2019.106
- Birk RZ, Ermakov S, Livshits G. Common FSNP variants of fourteen bardet-biedl syndrome genes and adult body mass. Obesity (Silver Spring). 2013;21(8):1684–1689. doi: 10.1002/oby.20056
- Young KL, Graff M, Fernandez-Rhodes L, et al. Genetics of obesity in diverse populations. Curr Diab Rep. 2018;18(12):145. doi: 10.1007/s11892-018-1107-0
- Jovanovich S, Bogdan G, Belcinski R, et al. Developmental validation of a fully integrated sample-to-profile rapid human identification system for processing single-source reference buccal samples. Forensic Sci Int Genet. 2015;16:181–194. doi: 10.1016/j.fsigen.2014.12.004
- Beck D, Ben Maamar M, Skinner MK. Genome-wide CpG density and DNA methylation analysis method (MeDIP, RRBS, and WGBS) comparisons epigenetics: official. J DNA Methylation Society. 2022;17(5):518–530. doi: 10.1080/15592294.2021.1924970
- Zhao W, Langfelder P, Fuller T, et al. Weighted gene coexpression network analysis: state of the art. J Biopharm Stat. 2010;20(2):281–300. doi: 10.1080/10543400903572753
- Chuang YH, Paul KC, Bronstein JM, et al. Parkinson’s disease is associated with DNA methylation levels in human blood and saliva. Genome Med. 2017;9(1):76. doi: 10.1186/s13073-017-0466-5
- Mahmoud R, Kimonis V, Butler MG. Genetics of obesity in humans: a clinical review. Int J Mol Sci. 2022;23(19):11005. doi: 10.3390/ijms231911005
- Das L, Gupta N, Dutta P, et al. Early initiation of temozolomide therapy may improve response in aggressive pituitary adenomas. Front Endocrinol. 2021;12:774686. doi: 10.3389/fendo.2021.774686
- King SE, McBirney M, Beck D, et al. Sperm epimutation biomarkers of obesity and pathologies following DDT induced epigenetic transgenerational inheritance of disease. Environ Epigenet. 2019;5(2):1–15, dvz008. doi: 10.1093/eep/dvz008
- Nilsson EE, Ben Maamar M, Skinner MK. Role of epigenetic transgenerational inheritance in generational toxicology. Environ Epigenet. 2022;8(1):dvac001 (1–9. doi: 10.1093/eep/dvac001
- Duncan GE, Avery A, Ben Maamar M, et al. Epigenome-wide association study for physical activity and physiological parameters in discordant monozygotic twins. Sci Rep. 2022;12(1). doi: 10.1038/s41598-022-24642-3
- Govender P, Ghai M, Okpeku M. Sex-specific DNA methylation: impact on human health and development. Mol Genet Genomics. 2022;297(6):1451–1466. doi: 10.1007/s00438-022-01935-w
- Beck D, Nilsson EE, Ben Maamar M, et al. Environmental induced transgenerational inheritance impacts systems epigenetics in disease etiology. Sci Rep. 2022;12(1):5452. doi: 10.1038/s41598-022-09336-0
- Eney AE, Tsang S, Delaney JA, et al. Cross-sectional association between soda consumption and body mass index in a community-based sample of twins. Nutr J. 2017;16(1):48. doi: 10.1186/s12937-017-0269-y
- Duncan GE, Avery AR, Strachan E, et al. The Washington state twin registry: 2019 update. Twin Res Hum Genet. 2019;22(6):788–793. doi: 10.1017/thg.2019.36
- Andrews S FastQC: a quality control tool for high throughput sequence data. UK2010. Available from: https://www.bioinformatics.babraham.ac.uk/projects/fastqc/.
- Bolger AM, Lohse M, Usadel B. Trimmomatic: a flexible trimmer for Illumina sequence data. Bioinformatics. 2014;30(15):2114–2120. doi: 10.1093/bioinformatics/btu170
- Langmead B, Salzberg SL. Fast gapped-read alignment with bowtie 2. Nat Methods. 2012;9(4):357–359. doi: 10.1038/nmeth.1923
- Li H, Handsaker B, Wysoker A, et al. The sequence alignment/map format and SAMtools. Bioinformatics. 2009;25(16):2078–2079. doi: 10.1093/bioinformatics/btp352
- Lienhard M, Grimm C, Morkel M, et al. MEDIPS: genome-wide differential coverage analysis of sequencing data derived from DNA enrichment experiments. Bioinformatics. 2014;30(2):284–286. doi: 10.1093/bioinformatics/btt650
- Robinson MD, McCarthy DJ, Smyth GK. edgeR: a Bioconductor package for differential expression analysis of digital gene expression data. Bioinformatics. 2010;26(1):139–140. doi: 10.1093/bioinformatics/btp616
- Kanehisa M, Goto S. KEGG: Kyoto Encyclopedia of Genes and Genomes. Nucleic Acids Res. 2000;28(1):27–30. doi: 10.1093/nar/28.1.27
- Kanehisa M, Goto S, Sato Y, et al. Data, information, knowledge and principle: back to metabolism in KEGG. Nucleic Acids Res. 2014;42(Database issue):D199–205. doi: 10.1093/nar/gkt1076
- Mi H, Muruganujan A, Casagrande JT, et al. Large-scale gene function analysis with the PANTHER classification system. Nat Protoc. 2013;8(8):1551–1566. doi: 10.1038/nprot.2013.092
- Pinero J, Ramirez-Anguita JM, Sauch-Pitarch J, et al. The DisGeNET knowledge platform for disease genomics: 2019 update. Nucleic Acids Res. 2020;48(D1):D845–D55. doi: 10.1093/nar/gkz1021
- Zhang B, Horvath S. A general framework for weighted gene co-expression network analysis. Stat Appl Genet Mol Biol. 2005;4(1):17. doi: 10.2202/1544-6115.1128
- Langfelder P, Horvath S. WGCNA: an R package for weighted correlation network analysis. BMC Bioinf. 2008;9(1):559. doi: 10.1186/1471-2105-9-559