
ABSTRACT
An immortalized neural cell line derived from the human ventral mesencephalon, called ReNCell, and its MeCP2 knock out were used. With it, we characterized the chromatin compositional transitions undergone during differentiation, with special emphasis on linker histones. While the WT cells displayed the development of dendrites and axons the KO cells did not, despite undergoing differentiation as monitored by NeuN. ReNCell expressed minimal amounts of histone H1.0 and their linker histone complement consisted mainly of histone H1.2, H1.4 and H1.5. The overall level of histone H1 exhibited a trend to increase during the differentiation of MeCP2 KO cells. The phosphorylation levels of histone H1 proteins decreased dramatically during ReNCell’s cell differentiation independently of the presence of MeCP2. Immunofluorescence analysis showed that MeCP2 exhibits an extensive co-localization with linker histones. Interestingly, the average size of the nucleus decreased during differentiation but in the MeCP2 KO cells, the smaller size of the nuclei at the start of differentiation increased by almost 40% after differentiation by 8 days (8 DIV). In summary, our data provide a compelling perspective on the dynamic changes of H1 histones during neural differentiation, coupled with the intricate interplay between H1 variants and MeCP2.
Abbreviations: ACN, acetonitrile; A230, absorbance at 230 nm; bFGF, basic fibroblast growth factor; CM, chicken erythrocyte histone marker; CNS, central nervous system; CRISPR, clustered regulated interspaced short palindromic repeatsDAPI, 4,’6-diaminidino-2-phenylindole; DIV, days in vitro (days after differentiation is induced); DMEM, Dulbecco’s modified Eagle medium; EGF, epidermal growth factor; ESC, embryonic stem cell; GAPDH, glyceraldehyde-3-phosphate dehydrogenase; GFAP, glial fibrillary acidic proteinHPLC, high-performance liquid chromatography; IF, immunofluorescence; iPSCs, induced pluripotent stem cells; MAP2, microtubule-associated protein 2; MBD, methyl-binding domain; MeCP2, methyl-CpG binding protein 2; MS, mass spectrometry; NCP, nucleosome core particle; NeuN, neuron nuclear antigen; NPC, neural progenitor cellPAGE, polyacrylamide gel electrophoresis; PBS, phosphate buffered saline; PFA, paraformaldehyde; PTM, posttranslational modification; RP-HPLC, reversed phase HPLC; ReNCells, ReNCells VM; RPLP0, ribosomal protein lateral stalk subunit P0; RT-qPCR, reverse transcription quantitative polymerase-chain reaction; RTT, Rett Syndrome; SDS, sodium dodecyl sulphate; TAD, topologically associating domain; Triple KO, triple knockout.
KEYWORDS:
Introduction
MeCP2, methyl-CpG binding protein 2, is an important epigenetic reader of DNA methylation, especially in the brain where the protein represents a highly abundant component of chromatin [Citation1]. Mutations of this protein result in Rett syndrome (RTT) [Citation2], a rare neurodevelopmental disease [Citation3,Citation4] predominantly affecting young girls as a result of the X-chromosome location of its encoding gene.
Chromatin is the name given to the eukaryote nucleoprotein complex resulting from the association between DNA and chromosomal proteins [Citation5]. Histones are the predominant proteins of the complex and they consist of core histones and linker histones (histones of the H1 family). The former organizes DNA into a globular nucleosome core particle (NCP). Upon binding to the NCP linker histones interact with the linker DNA (and hence their name) to form the nucleosome which represents the fundamental subunit of chromatin. The chromatin fibre consists of a nucleo-filament of nucleosomes connected through the linker DNA.
The putative relation between linker histone subtypes (histones of the micro-heterogeneous H1 family [Citation6–8]), that bind to the linker DNA connecting adjacent nucleosomes in the chromatin fibre, and MeCP2, that binds to methylated nucleosomes and methylated free DNA regions of the genome [Citation9,Citation10], has been quite extensively analysed [Citation11,Citation12]. From the early in vitro studies that indicated that MeCP2 is able to displace histone H1 in a way that is dependent on DNA methylation [Citation13] to the most recent genome-wide analyses that tried to address this topic [Citation12] and all the studies in between, the chromatin relation between these two proteins remains controversial.
Several in vivo murine models are currently available that mimic to different extent the RTT phenotype [Citation14]. Importantly, and in addition to their clinical relevance, mouse models are very useful for the study of the multifaceted functional roles of MeCP2 [Citation15] as it pertains to chromatin [Citation16]. A few such models include the MeCP2 knock out mouse model developed in Adrian Bird’s lab [Citation17] and a mouse strain lacking a substantial part of MBD developed in Rudolf Jaenisch’s lab [Citation18]. As well, a few knock in mice strains expressing MeCP2 consisting of individual Rett syndrome relevant mutations, such as T158M [Citation19,Citation20] and R306C [Citation19,Citation21], and a mouse model containing C-terminal MeCP2 truncation, R294X [Citation22] are being used.
Although not much is used in chromatin studies, in vitro models also exist. Several of them combine gene-editing technologies such as clustered regulated interspaced short palindromic repeats (CRISPR) with induced pluripotent stem cells (iPSCs) [Citation23]. A similar strategy was followed using a LUHMES (Lund human mesencephalic) differentiation-inducible cell line, in which in addition to several RTT mutants a MeCP2 KO was also developed [Citation23]. Similarly, a MeCP2 KO cell line has been more recently created using ReNCell VM [Citation24]. The ReNCell VM cell line was initially generated by ReNeuron, a UK-based Proprietary Stem Cell Exosome Technologies company. The cells were derived from the ventral mesencephalon of a 10-week gestational human male foetal brain obtained from Kings College Hospital of London (UK) and immortalized with v-myc transfection [Citation25]. The system can be induced to differentiate in vitro to produce dopaminergic and other neuronal subtypes. To date, the system has been proven to be very useful for the study of neurodegenerative (Alzheimer’s) [Citation26,Citation27] and neurodevelopmental (RTT) disorders [Citation24] but only a limited biochemical characterization involving a proteomic survey [Citation28] has been carried out.
In the present article, we have characterized the ReNCell VM neural cell line from a chromatin perspective focusing mainly on MeCP2 and histone H1 and analysed its usefulness in shedding any light on the potential interplay between these two chromosomal proteins.
Materials and methods
Cell culture
Immortalized human neural progenitors (ReNCell VM, SCC008) were purchased from Merck Millipore (Burlington, MA, USA). CRISPR-Cas9 technology was used for engineering MeCP2 KO in human ReNCell VM, for more details see [Citation24]. Both WT and KO ReNCells were maintained in complete media: DMEM/F-12 (Sigma-Aldrich, St. Louis, MO), B27 (Gibco, Waltham, MA, USA) (1X), antibiotic/antimycotic (Sigma-Aldrich, St. Louis, MO, USA) and heparin with EGF and bFGF (Stemcell technologies, Vancouver, BC, Canada). Before ReNCell was plated, the culture vessel was coated with laminin (Sigma Aldrich, St. Louis, MO, USA) by incubating the plate surface in 20 µg/mL in PBS for 2 h at 37°C. To thaw ReNCell, the frozen stock was diluted in incomplete media and spun down at 1,000 × g for 3 min and the supernatant was removed. The cell pellet was diluted in complete media and plated on the laminin-coated culture vessel. For the induction of differentiation, the cells were briefly washed with DMEM/F-12 and given incomplete media: complete media without growth factors (EGF and bFGF). Days in vitro (DIV) notes the number of days after differentiation is induced. Media was changed the day after sub culturing and every other day afterwards.
HeLa cells (S3 strain) were grown in spinner culture at 37°C in the presence or absence of sodium butyrate as described elsewhere [Citation29].
Nuclear preparation for tissues
Adult mice (CD-1) brains and livers were collected at P60 as described in [Citation30]. Tissues were homogenized in four volumes of lysis buffer, ‘Buffer A’ (0.25 M Sucrose, 60 mM KCl, 15 mM NaCl, 10 mM MES (pH 6.5), 5 mM MgCl2, 1 mM CaCl2, 0.5% triton X-100) with 1:100 protease inhibitor (Protease inhibitor Roche Molecular Biochemicals, Laval, QC, Canada). The homogenate was incubated on ice for 10 min and centrifuged at 600 × g for 5 min at 4°C. The pellet was resuspended in eight volumes of Buffer A and centrifuged at 600 × g for 5 min at 4°C. The pellet was resuspended next in four volumes of nuclei wash buffer ‘Buffer B’ (50 mM NaCl, 10 mM Pipes (pH 6.8), 5 mM MgCl2, 1 mM CaCl2) and centrifuged. The pellet thus obtained resuspended in two volumes of Buffer B. For measuring the concentration of DNA, 5 µL of sample in buffer B was added to 975 µL of distiled water to lyse the nuclei, vortexed, then 20 µL of 10% SDS (final concentration of 0.2% SDS) was added and the absorbance at 260 nm was measured using CARY 1 BIO UV-Vis Spectrophotometer. An extinction coefficient A260 of DNA = 20 cm2mg−1 was used [Citation31].
Nuclear preparation for ReNCell for subsequent HCl extraction
To harvest the cells, Accutase (Sigma-Aldrich, St. Louis, MO, USA) was added to ReNCell and incubated at 37°C for 5 min. The detached cells suspended in Accutase solution were transferred to a centrifuge tube and centrifuged at 1,000 × g for 3 min at 4°C. The pellet thus obtained was resuspended in two volumes of buffer A. Then the suspension was centrifuged at 600 × g for 5 min at 4°C. The supernatant was removed, and the pellet was frozen at −80°C for 2 h. The frozen pellet was subsequently used for HCl extraction.
HCl extraction of histones
Nuclei suspended in buffer A or B was mixed with six volumes of 0.8 N HCl and homogenized. Homogenate was centrifuged at 13,000 × g for 10 min at 4°C and 6 volumes of acetone were added to the HCl supernatant. The mixture was incubated overnight at −20°C to precipitate the histones. The next day, the mixture was centrifuged at 13,000 × g for 10 min 4°C. The acetone supernatant was removed, and the pellet was washed in fresh acetone.
Due to poor resuspension of the pellet in acetone, dispersion of the pellet was facilitated using a thin spatula within the newly added acetone at room temperature. Then, the mixture was centrifuged again as per the previous conditions. The final acetone supernatant was removed, and the pellet was vacuum centrifuged on Jouan RC 1010 concentrator centrifuge for 10 min at room temperature. The dry pellet was dissolved in distiled water and mixed with 2X SDS for running in a gel or had its absorbance measured at 230 nm using Nanodrop™ (NanoDrop Technologies Inc, Wilmington, DE, USA).
SDS-PAGE
Cell or nuclear lysates were mixed with 2X Laemmli buffer (2% SDS, 10% glycerol, 0.002% bromophenol blue and 62.5 mM Tris-HCl pH 6.8) and run on an SDS gel (15% separating, 4% stacking). SDS-PAGE was performed as previously described [Citation32]. The gel was run in buffer (0.38 M glycine, 0.05 M tris-base, 0.1% SDS). For staining, the gel was incubated in Coomassie staining solution (10% acetic acid, 0.27% Coomassie Brilliant Blue G-250, 25% isopropanol) for 1 h at room temperature on shaking. The gel was then placed in de-stain solution (10% isopropanol, 10% acetic acid) for 1 h at room temperature on shaking.
Western blot (for western section)
The proteins were transferred using sodium phosphate transfer buffer (20 mM NaPO4, 15% ethanol and 10 mL of 10% SDS added directly to transfer container after blotting set up is complete) to nitrocellulose membrane for 2 h at 400 mA at 4°C. The membrane was blocked in 3% blocking buffer (3% skim milk powder in PBST; 0.1% tween-20 in 1X PBS) for 1 h. The membrane was incubated with primary antibody overnight at 4°C while shaking. The membrane was then washed three times with PBST then incubated with secondary antibody for 1 h at room temperature in dark. Membranes were imaged, and protein bands were analysed using Li-Cor Odyssey Clx (LI-COR Biosciences, Lincoln, NE, USA). The following antibodies were used: rabbit H1.0 1:500 (SC-56695, Santa Cruz, Dallas, TX, USA); rabbit H1.2 1:5,000 (PA532009, Invitrogen, Waltham, MA, USA); rabbit H1.4 1:1,000 (41328S, Cell Signalling Technologies); rabbit H1.5 1:2,000 (gift from A. Jordan, Molecular Biology Institute of Barcelona); rabbit H4 1:50,000 (in house made); rabbit MeCP2 1:5,000 (M9317, Sigma-Aldrich); mouse monoclonal NeuN 1:500 (MAB377, Sigma-Aldrich); mouse PSD95 1:1,000 (MA1–046, ThermoFisher); rabbit Synapsin-1 1:1,000 (#5297, Cell Signalling Technologies); rabbit Synaptophysin 1:1,000 (PA1–1043, ThermoFisher); mouse Bassoon 1;1,000 (Ab82958, Abcam); HRP-conjugated Vinculin 1:2,000 (#18799, Cell Signalling Technologies); HRP-conjugated β-actin (a3854, Sigma Aldrich); mouse IRDye M680 1:10,000 (Licor, Lincoln, NE, USA.926–68070); rabbit IRDye800 1:10,000 (Licor, Lincoln, NE, USA.611-132-122).
RP-HPLC
The HCL-extracts from ReNCell were reconstituted in 1 mL of distiled water at an approximate OD230 of 0.34 and filtered using a 0.45 µm Nanosep centrifugal filter. Filtrate was injected onto a C18 column (Vydac, Hesperia, CA, USA.) (4.6 × 250 mm, particle size: 5 µm, pore size: 300 Å) and eluted at 1 mL/min using mobile phase A (0.1% trifluoroacetic acid in ddH2O) and mobile phase B (100% acetonitrile). The program used a gradient of 0–60% (1%/1 mL/minute) of solvent B over 60 min. HPLC-separation of proteins was performed on Beckman Coulter SYSTEM GOLD® 126 Solvent Module equipped with SYSTEM GOLD® 168 Detector. The eluate from the HPLC column was monitored at 230 nm, and the elution peaks were recorded. Peak areas were determined with the 32 Karat software peak integrator program (Beckman Coulter Inc., Brea, CA, USA). HPLC fractions (1 mL) were collected and lyophilized overnight. The lyophilizate was than mixed with a small volume (~20 µL) of 1X SDS on SDS-PAGE gel and analysed after Coomassie staining or western blotting.
RNA extraction, cDNA synthesis, qPCR
Total RNA was extracted using Trizol. Cells were harvested from the plate using Trizol (Invitrogen, Waltham, MA, USA). RNA extraction was carried out according to the manufacturer’s instructions. One microgram of extracted RNA was reverse-transcribed with High-Capacity cDNA Reverse Transcription Kit (Applied Biosystems, Waltham, MA, USA) according to the manufacturer’s instructions. qPCR was done using Stratagene MX3005P qPCR system (Santa Clara, CA, USA) and MXPro software. Each qPCR reaction consisted of 1X SYBR Select Master Mix (Applied Biosystems, Waltham, MA, USA), 0.5 µM forward primer, 0.5 µM reverse primer, nuclease-free water and 1 µL of appropriately diluted cDNA. Each sample was run in triplicate. Data were analysed using the Pfaffl method. Neither the no template control (NTC) nor the no reverse transcriptase control (NRT) showed amplification which is an indication that there was no contaminant in any of the reactions and there was no gDNA contamination. Primer pairs used for qPCR are shown below.
Mass spectrometry
The lyophilized histone samples were prepared for LC-MS as previously described [Citation35]. Briefly, 0.2 µg of protein was pressure-loaded onto a PLRP-S pre-column containing vasoactive intestinal peptide and angiotensin I internal standards. The pre-column was connected to a PLRP-S analytical column and rinsed with Solvent A for 25 min at a flow rate of ~130 nL/min. The proteins were eluted using a gradient of 0-20-25-40-100% Solvent B in 0-5-15-25-40 min at a flow rate of ~160 nL/min and analysed by ESI-LC-MS using a Thermo Scientific Orbitrap Fusion Tribrid Mass Spectrometer. Full MS1 scans were acquired using the Orbitrap (120k resolution) and ion trap mass analysers. Using a three-second cycle, multiply-charged ions (z ≥ 4) were selected from the Orbitrap MS1 for fragmentation and MS2 analysis. Precursor ions were isolated by the quadrupole with a 3 m/z width and fragmented in an m/z-dependent manner. Ions with 400—800 m/z were fragmented by stepped HCD at 21-24-27% normalized collision energy and ETD using calibrated reaction times, ions with 500—800 m/z were fragmented by CAD at 35% normalized collision energy and ETD, and ions with 800—1,500 m/z were fragmented by EThcD with 20% supplemental activation energy and HCD. All MS2 scans were acquired using the Orbitrap at 60k—120k resolution. Ions detected twice in 20 s were placed onto an exclusion list.
Targeted MS2 for histone H1 phosphorylation site assignment
Approximately 0.1 µg of protein was loaded, rinsed, and eluted as described above. Phosphorylated H1 subtypes identified by the screening experiments were targeted using an MS/MS ETD-based method with set reaction times. The phosphorylated H1 ions (z = 39 and 40) were isolated by the quadrupole with a 1 m/z width, ion target AGC of 5e5, and maximum inject time of 200 ms. Phosphorylated histones H1.2 and H1.4 were fragmented by 2 ms and 10 ms ETD reactions, and phosphorylated histone H1.5 was fragmented by 3 ms and 13 ms ETD reactions. The ETD reagent ion target AGC was set to 4e5. All MS2 scans were acquired using the Orbitrap mass analyser at a resolution of 120k and a 100—2,000 m/z range.
MS data analysis
Unprocessed MS1 and MS2 spectra were manually inspected using Qual Browser 4.0.27.10 (Thermo Scientific). Canonical human histone H1 sequences were obtained from Uniprot [Citation36]. Histone H1 subtypes were identified from the MS1 spectra using predicted intact H1 isotopic distribution patterns (Predator Manual Validation Helper v2.8, National High Magnetic Field Laboratory) and manually validated from the MS2 spectra with the aid of an in-house fragment ion calculator. The targeted MS2 spectra were deconvolved using the Xtract algorithm (Thermo Scientific) [Citation37] and manually annotated. Modification site assignments were cross-referenced with TopFD [Citation38] annotations generated by MASH Native [Citation39].
Double immunofluorescence
ReNCell was cultured on 12 mm coverslips (Bellco Glass Inc., Vineland, NJ, USA) pre-coated at 37°C with laminin (20 µg/mL) at least 2 h before plating. At defined DIV times, media was removed, and the cells were fixed on ice for 15 min using ice-cold 4% PFA (Electron Microscopy Sciences (EMS) Hatfield, PA, USA) diluted in modified-PBS (containing 1 mM CaCl2 and 1 mM MgCl2). Then, PFA was removed and coverslips were washed 3 times for 5 min each with modified-PBS. Cells were blocked for 1 h in blocking solution (5% BSA with 0.3% TRITONTM X-100 in modified-PBS). Next, the primary antibodies were diluted in blocking solution and incubated overnight at 4°C in a humidified chamber. The antibodies used were: anti-rabbit MAP2 (1:200, #8707, Cell Signalling), anti-mouse GFAP (1:500, G3893, Thermo Fisher), anti-rabbit Synapsin-1 (1:200, #5293, Cell Signalling) and anti-rabbit Synaptophysin (1:200, PA1–1043, Thermo Fisher). The following day, the antibody was removed, and coverslips were washed with modified-PBS 3 times for 5 min each. Secondary antibodies were diluted in blocking solution and incubated for 1 h at room temperature in a dark chamber (Alexa Flour anti-rabbit (488, ab150077) anti-mouse (647, ab150115) both from Abcam). After removal of the secondary antibody, the coverslips were incubated with DAPI for 5–10 min in the dark. Finally, the coverslips were washed with water 2 times for 5 min each. Coverslips were mounted face-down on a glass slide using Immumount as mounting medium and imaged using the Nikon C2 confocal microscope (Nikon, Tokyo, Japan) with a numerical aperture of 1.3. Images were processed using the ImageJ software. SGC5 (Biotium, Fremont, CA, USA) was used to stain the cytoplasmic membrane. NeuroStudio analysis and 3D neuronal reconstruction were performed as explained in [Citation24].
MAP2 and GFAP area determination
The images were acquired as Z-stacks with a thickness of 1 micron per stack using a Confocal Zeiss LSM 710 microscope. The size of the Z-stacks varied depending on the specific region or sample, and the number of stacks was adjusted to encompass the entire depth of the sample, typically ranging from 15 to 20 stacks. To quantify the area covered by MAP2 and GFAP markers, we employed the IMAGE J software (version 1.53t). Firstly, we reconstructed the Z-stacks, and then we applied the process tool to remove any noise present in the images. Subsequently, the images were converted into binary pictures, and a threshold value of 255 was set to distinguish the marker-positive regions from the background. Using the measurement tool in IMAGE J, we calculated the area of coverage for each marker, providing quantitative data for the extent of MAP2 and GFAP expression in each image (n = 10 per sample).
MECP2 and histone double immunofluorescence
The analysis of the co-distribution of MeCP2 and histone proteins (H1.2, H1.4, and H1.5) presented challenges and necessitated thorough optimization. This involved the utilization of antibodies from diverse sources and careful consideration of various handling conditions. The following antibodies were used: anti-rabbit histone H1.2 (ab17677, 1:200) from Abcam, anti-rabbit histone H1.4 (#41328S, 1:200) from Cell Signalling Technology, anti-rabbit histone H1.5 (#711912, 1:100) from ThermoFisher and anti-mouse MeCP2 (sc -137,070, 1:50) from Santa Cruz Biotechnology. Cells were plated on laminin pre-coated coverslips (25 mm diameter) placed on 12-well plates and allowed to grow until the moment of the experiment. The optimized protocol consisted of fixing the cells for 10 min with 2% formalin (added directly to the medium) and incubate the cells at room temperature gently shaking (<30 rpm). Slides were washed 3 times for 3 min each with modified-PBS (containing 5 mM CaCl2 and 5 mM MgCl2). Permeabilization was carried out using 0.25% Triton X-100 in modified-PBS for 10 min in a low-speed shaker, followed by a single wash step with modified-PBS for 3 min. Cells were blocked for 1 h using a mixture of 5% goat serum, 5% donkey serum and 5% BSA with 0.1% Triton X-100 diluted in the modified-PBS. This was followed by overnight incubation with the primary antibodies mentioned above, diluted in 3% BSA with 0.1% Triton X-100 in modified-PBS, coverslips were placed on a humidified chamber at 4°C. The following morning cells were let to warm at the bench for 30 min, next they were washed 3 times with modified-PBS followed by 1h30 incubation with secondary antibodies (protected from the light): Alexa Fluor donkey anti-mouse 555 and Alexa Flour goat anti-rabbit 647 (both at 1:1,000, from Thermo Fisher) diluted in 1% BSA with 0.1% Triton X-100 in modified-PBS. After three washes with modified-PBS (3 min each), nuclei were stained with DAPI (1:10,000) for 5 min. Finally, the coverslips were washed twice with distiled water (for 5 min each), slightly dried, and mounted on glass slides using FluorSave GOLD® (Millipore). The slides were allowed to dry overnight on the bench protected from the light and were visualized the next day. Images were captured on a Confocal Zeiss LSM 710 microscope and analysed using ImageJ software (version 1.53t).
Co-localization analysis
Co-localization analysis was performed using Image J software and JACoP plugin, developed by Bolte and Cordelières (2006). To measure the overlapping pixels on the dual-channel images (MeCP2+ and Histone+) the threshold was set between 50 and 100 depending on the selected image (n = 6 per conditions); the co-localization was quantified by Pearson’s coefficient, as it considers the average intensity values on a linear correlation ranging from 0 to 1 (for more details refer to [Citation40]).
Statistical analysis
All experiments were performed at least in triplicates. Graphs and statistical analyses were obtained with GraphPad Prism 9.2.0 and Excel software. Unless otherwise stated, RT-qPCR data are expressed as the mean with SD. Comparative analyses of differences between experimental groups were performed using Mann-Whitney’s U test or unpaired samples t-test, and one-way ANOVA with Bonferroni post hoc test or two tailed Fisher’s exact test for intergroup comparisons. Results were considered significant for values of * p < 0.05, ** p < 0.01 or *** p < 0.001.
Results
The analysis of MeCP2 during cellular differentiation of ReNcell
MeCP2 has been shown to increase during cell differentiation in brain and in cultured cells stimulated to differentiate in vitro into neuron-like post-mitotic cells [Citation41]. Therefore, we analysed the level of MeCP2 in WT ReNCell at multiple time points after differentiation. An increase of MeCP2 was observed along the process until 8–12 days in vitro (DIV 8 to 12). However, beyond this point, MeCP2 started to decrease (). The decrease beyond this point was more pronounced when actin () was used as a control compared to histone H4 (). Such discrepancy is not surprising as actin might decrease during differentiation as a result of synaptogenesis and also as MecP2 might control the expression of nuclear architectural proteins (see Discussion section). The decrease preceded by a small inflection beyond 8/11 DIV observed using histone H4 resembles that which is observed in mouse brain during the transition from P4/P15 to P30 (see supplementary Fig. S1A in [Citation40] and in [Citation41]). Because of the primary chromatin focus of this paper and the potential interplay between MeCP2 and histone H1 it was important to find a time point where the level of MeCP2 is at its highest point of expression. As shown in , this occurs at around 8 DIV at which point a 5–6-fold increase compared to 0 DIV is observed, similar to what had been previously described in other in vitro differentiation inducible neuronal cell lines [Citation41]. An earlier study carried out at the time when ReNCell was first generated showed that while the ReNCell proteome changes from the proliferating stage to 4 DIV were vast, these changes became smaller from 4 DIV to 7 DIV [Citation42]. Therefore, for all subsequent studies, it was decided to set 8 DIV as the end point of the differentiation studies.
Figure 1. Changes in MeCP2 during ReNCell differentiation. Western blot analysis of MeCP2 at different DIVs normalized to ß-actin (a) and histone H4 (b). Graph shows mean ± standard error of three independent experiments. DIV: days in vitro, P30 L and P30 B: mouse liver and brain respectively at 30 days after birth.
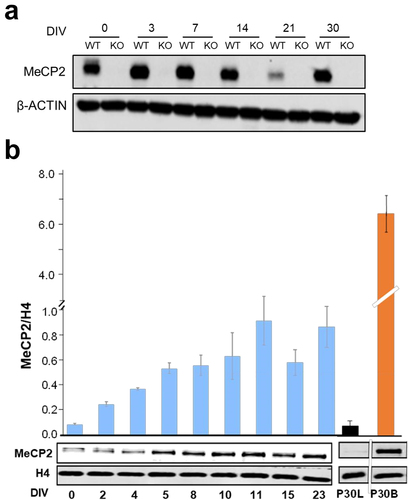
Despite the fivefold increase in MeCP2 observed in WT ReNCell, it is important to note here that such an increase, as well as those similarly found in other differentiation-inducible systems, is approximately tenfold lower than that observed in whole mouse (P30) brain (.) and about 15–20-fold of that which is present in cortical neurons [Citation16].
Changes in cell morphology and composition during ReNCell cell differentiation
An early concern with the use of MeCP2 KO ReNCell was that the absence of MeCP2 in these cells could compromise their neuronal differentiation. It has been reported that MeCP2 is a protein involved in maintaining the differentiated state of neurons and that in its absence they are under-developed and exhibit a less complex arborization [Citation43]. Therefore, it was imperative to check the MeCP2 KO cells’ ability to differentiate into neurons. To confirm this, a western analysis was performed using NeuN, a marker found in neuronal nuclei that is often used for this purpose [Citation44]. Interestingly, the comparative NeuN western results for the WT and KO cells () showed that the latter expressed more NeuN during the stimulation to differentiate as DIV increased ( right panel).
Figure 2. Characterization of WT and KO ReNCell during induced cell differentiation. (a) evolution of NeuN protein expression after several days of induced differentiation (DIV). Histone 4 was used as endogenous control. (b) western blot analyses of MAP2 and GFAP in WT and KO in DIV 0 and 8. Histone H4 was used as endogenous control and the graphs correspond to average of three technical replicates. Error bars represent standard error. (c) changes in cell morphology between WT and KO as progenitors (DIV 0) and after 8 days of differentiation (DIV 8). Cells were stained by SGC5 membrane dye (green); and nuclei by DAPI (blue). Scale bar: 50 µm. (d-e) morphological differences between neurons (MAP2+) in astrocyte (GFAP+) between WT and KO cells as progenitors (DIV 0) and 7-day differentiated cells (DIV 7). MAP2+ cells are represented in cyan and GFAP+ in magenta. Nuclei was stained with DAPI (blue). Scale bars: 50 µm. Percentage of covered area of MAP2+ and GFAP+ in WT and KO (n = 10 per sample) in DIV 7. Error bars represent standard error.
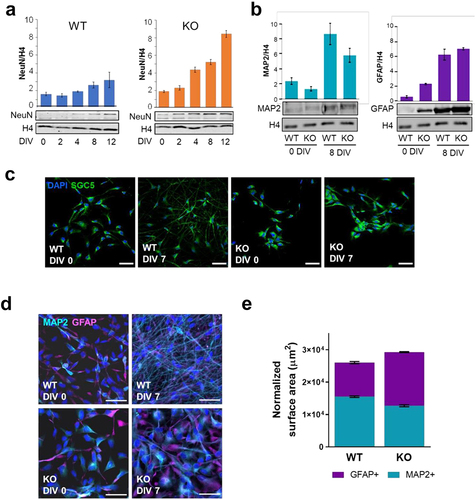
A combination of the plasma membrane dye SGC5 with the DNA-binding dye (DAPI) for the nucleus was used to visualize the cell morphology using fluorescence microscopy (), As shown in this figure, ReNCell exhibits significant morphological differences between the WT and MeCP2 KO cells. Interestingly, while WT 0 DIV cells seem to have a fibroblast-like morphology, KO 0 DIV cell membrane does not extend much from the nucleus. Striking differences were observed for 8 DIV cells between WT and MeCP2 KO cells (see Suppl for a quantification). For ReNCell WT cells, SGC5 staining showed the elongated projections from the cell body corresponding to the dendrites and axons. These projections are thin and elongated as it is to be expected from properly differentiating neurons. The projections are also webbed, showing that the cells are in the process of establishing complex networks as it is observed in in vivo neuronal networks. Of note, at this DIV, the cell bodies of WT cells are much smaller than those observed in the KO cells ( right panels). For MeCP2 KO cells, there is almost no elongation of the membrane. In fact, the membrane shows characteristics of preliminary differentiation as indicated by the stretching of the membrane into structures that resemble lamellipodia. The KO cells also seem to start initiating or establishing some connections amongst themselves. An important difference between ReNCell WT and KO cells was the tendency of the latter to aggregate at this DIV ().
Figure 3. Linker histone composition of ReNCell at 0 and 8 DIV. (a-1) RP-HPLC chromatograms of KO RenCell 8 DIV. Elution fractions (38 to 41) were visualized using Coomassie blue stained SDS-PAGE and western blotting using H1.2, H1.4 and H1.5. The asterisks point to contaminating non-histone proteins arising from the whole-cell nature of the HCl extracts used in the HPLC analyses. (a-2) SDS-PAGE of HCl-extracts from different tissues and ReNCell. CM: chicken erythrocyte marker. The red rectangles highlight the histone H1 region. (b-1-2) Linker histone/core histone ratio calculated by quantifying signals from HPLC chromatograms and Coomassie-stained bands respectively (see Fig.S1 and fig S2). Data represent mean of 3–5 independent experiments ± standard error. Unpaired two-tailed t-tests were used to generate the P-values (HPLC p-values are 0.8369 for DIV 0 and 0.0031 for DIV 8. Coomassie p-values are 0.4506 for DIV 0 and 0.0011 for DIV 8). (c) molar ratio linker histone/core histone ratio estimated from (b). The average experimental value of 0.298 obtained for CM, using both approaches, was assigned to a previously determined molecular ratio of 1.3 [Citation45] (shown in red) and this was used as a normalizer for the other tissue and ReNCell samples. The approach provided a 0.76 molar ratio for mouse liver [Citation45] (shown in orange) in good agreement with previously published experimental value. mAU = mili-absorbance units, ACN = acetonitrile.
![Figure 3. Linker histone composition of ReNCell at 0 and 8 DIV. (a-1) RP-HPLC chromatograms of KO RenCell 8 DIV. Elution fractions (38 to 41) were visualized using Coomassie blue stained SDS-PAGE and western blotting using H1.2, H1.4 and H1.5. The asterisks point to contaminating non-histone proteins arising from the whole-cell nature of the HCl extracts used in the HPLC analyses. (a-2) SDS-PAGE of HCl-extracts from different tissues and ReNCell. CM: chicken erythrocyte marker. The red rectangles highlight the histone H1 region. (b-1-2) Linker histone/core histone ratio calculated by quantifying signals from HPLC chromatograms and Coomassie-stained bands respectively (see Fig.S1 and fig S2). Data represent mean of 3–5 independent experiments ± standard error. Unpaired two-tailed t-tests were used to generate the P-values (HPLC p-values are 0.8369 for DIV 0 and 0.0031 for DIV 8. Coomassie p-values are 0.4506 for DIV 0 and 0.0011 for DIV 8). (c) molar ratio linker histone/core histone ratio estimated from (b). The average experimental value of 0.298 obtained for CM, using both approaches, was assigned to a previously determined molecular ratio of 1.3 [Citation45] (shown in red) and this was used as a normalizer for the other tissue and ReNCell samples. The approach provided a 0.76 molar ratio for mouse liver [Citation45] (shown in orange) in good agreement with previously published experimental value. mAU = mili-absorbance units, ACN = acetonitrile.](/cms/asset/7dab93af-3f50-4ebe-8305-24288e481b41/kepi_a_2276425_f0003_oc.jpg)
It was observed that ReNCell neural progenitors have the ability to differentiate into a mixed cell population consisting of neuron and glial cells (). The result is in agreement with previous data showing that MeCP2 suppresses astrocytic differentiation while promoting neuronal differentiation and its absence stimulates neural progenitor cells to differentiate into non-neuronal cells [Citation46]. Therefore, we decided to analyse the cell composition during its differentiation from the progenitor stage (0 DIV) to 7–8 DIV using both western blot analysis () and immunocytochemistry () using MAP2 and GFAP as markers for neurons and astrocytes, respectively. Western blot analysis indicated that neurons were the prevalent cells at 0 DIV in the WT (~80%) but represented about 35% of the neural cells in the KO at this DIV. Upon differentiation, the relative proportion of neurons decreased to ~60% at 8 DIV for the WT but remained to ~40% in the KO, a value that is also corroborated by the immunocytochemistry results (). No significant signal could be obtained for oligodendrocytes in our western blot and IF analyses.
Linker histone content in WT and KO ReNcell
MeCP2 KO ReNCell is a good neural differentiation system to analyse the effect(s) of MeCP2 on linker histones. A MeCP2 KO mouse system has been used for this type of analysis using neurons isolated from whole brain [Citation16] and ESCs differentiated into neurons [Citation47]. The ability to compare WT and MeCP2 KO cells at the same stage of differentiation in the ReNCell system is advantageous.
Histones were first fractionated using reversed phase HPLC () from total cell HCl extracts (). Whole-cell extracts instead of nuclear extracts were used in order to maximize the amount of material obtained. The peaks corresponding to histone H1 were analysed using mass spectrometry (MS) and SDS-PAGE and allowed us to identify three main histone H1 subtypes in ReNCell: H1.2, H1.4, and H1.5. The area under the peaks (elution fractions 38–41) corresponding to these three main subtypes, highlighted by the red rectangle in the HPLC chromatogram was used to quantify the overall linker histone/core histone ratio for the WT and MeCP2 KO counterpart at both 0 DIV and 8 DIV ( and legend to ). An integration software available from the HPLC system was used to this purpose (see Fig S1). A similar analysis was carried out using the densitometrically scanned images of the SDS-PAGE shown in (Fig. S2). The results thus obtained () show similar results as those of for the HPLC. The linker histone/core histone ratios obtained from the two approaches were averaged and used to produce the estimated linker histone/core histone molar ratios shown in . The results thus obtained show that, with the exception of KO 8 DIV, these molar ratios (0.85 ± 0.01) are very similar to that observed in HeLa cells (0.87) (). Interestingly, the molar ratio was observed to increase to 1.18 for KO at 8 DIV which is reminiscent of the value of 1.07 observed in ox glia [Citation45].
ReNCell exhibits negligible levels of H1.0 and an exceptionally elevated abundance of the histone H1.5 subtype, both prior to and following induction of differentiation RP-HPLC fractionation of the HCl extracts (1) was optimized using mouse liver and HeLa cell HCl extracts. In the process, we found that the ReNCell HPLC chromatograms did not show any signal for H1.0 which, with the liver and HeLa samples, corresponded to an early eluting peak (HPLC fraction 37). This prompted us to analyse the expression of this subtype, using Western blot analysis of whole-cell extracts (), beyond the DIV at which MeCP2 is maximally expressed during differentiation (). The results indicate a very low abundance of this linker histone subtype. This result is somewhat unexpected considering that H1.0 is highly expressed in some other neural cells such as cortical neurons [Citation48].
Figure 4. Levels of expression histone H1 subtypes (H1.0, H1.2, H1.4 and H1.5) and RT-qPCR analysis of their transcripts in ReNcell. (a) western blot analysis of histone H1.0 at different DIV for ReNCell WT and KO in comparison to mouse liver and brain. (b) histone H1/histone H4 ratio for H1.2, H1.4 and H1.5 isoforms for ReNCell WT and KO at 0 DIV; data represent mean of three biological replicates ± standard error. (c) RT-qPCR data for ReNCell 0 DIV and 8 DIV. Histone subtype (H1.2, H1.4 and H1.5) transcripts were quantified via RT-qPCR. RT-qPCR data were analysed using the geomean pfaffl method. Data represent mean of three biological replicates ± standard error. (d) expression of histone H1 gene subtypes H1.2, H1.4 and H1.5 relative to H1.0 expression in WT and KO ReNCell at 0 and 8 DIV.
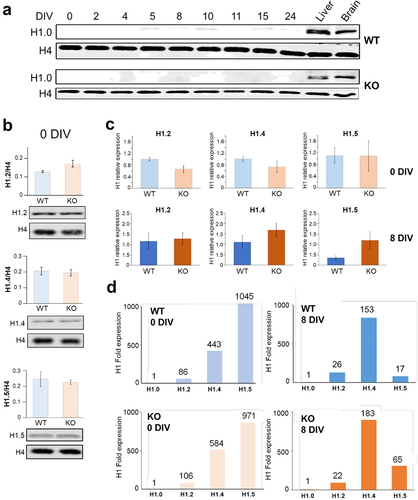
As it has been mentioned earlier, a preliminary MS analysis alerted us to the presence of H1.5 in addition to the H1.2 and H1.4 subtypes in ReNCell. The levels of H1.4 and H1.5 in WT and KO ReNCell at 0 DIV were similar and slightly higher than that of H1.2 (). Histone H1.4 is usually the most abundant linker histone in neurons [Citation48].
In order to determine the expression of the linker histone H1.0, H1.2, H1.4 and H1.5 subtypes in ReNCell, the transcript levels were analysed by RT-qPCR using RNA extracted from WT and MeCP2 KO ReNCell (). While at 0 DIV the expression of H1.5 was similar in the WT and KO cells, at 8 DIV it remained relatively unchanged in the KO while it decreased by almost half in the WT. A decrease of 50% for this subtype was observed in neurons upon differentiation [Citation48] as it is expected from the decrease observed in this subtype during cell differentiation [Citation49]. The overall increase observed in the H1.2, H1.4 and H1.5 at 8 DIV in MeCP2 KO ReNCell is in good agreement with overall increase in histone H1 observed at this time point ().
In addition to the expression of H1.2, H1.4 and H1.5, we also determined the expression of H1.0 which, in agreement with the protein levels shown in , turned out to be exceedingly low as it is emphasized by plotting the expression of the first three subtypes relative to the expression of H1.0 (). The relative patterns of expression of H1.2, H1.4 and H1.5 at 8 DIV are reminiscent of those found in differentiated neurons [Citation48]. They also highlight once more the unusually high abundance of H1.5 and slightly higher abundance of H1.4 in the MeCP2 KO ReNCell at 8 DIV compared to the WT counterpart.
Histone H1 phosphorylation decreases during ReNCell cell differentiation in a way that is independent of MeCP2
Linker histones of ReNCell consistently eluted between fractions 38 and 41 in our HPLC system and western blot detection of linker histone proteins using these fractions and subtype-specific antibodies indicated differences in their respective patterns of elution which varied with DIV and the WT and KO nature of the cell (results not shown). Such variability suggested a potential transition in their PTMs during the differentiation process. To investigate this, the WT and KO fractions at 0 DIV and 8 DIV were analysed using LC-MS ().
Figure 5. MS analysis of histone H1 phosphorylation. (a) relative amounts of histone H1 phosphorylation for histone H1.2, H1.4 and H1.5 for the HPLC fractions 38 to 41 shown in fig. 3A.1 for WT and KO ReNCell at 0 and 8 DIV. (b) phosphorylation sites determined by targeted MS2 (see materials and methods).
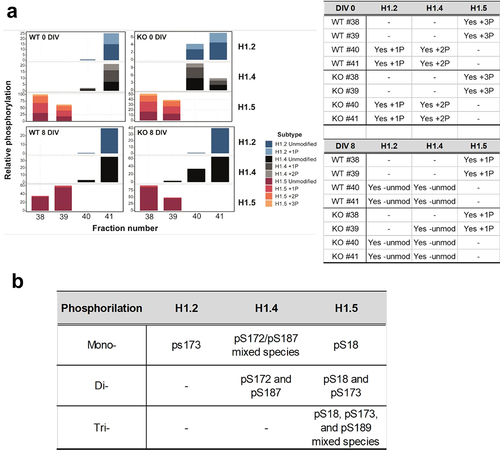
All the fractions analysed using this approach showed that, as expected from previous MS work [Citation50–52], all the histone H1 subtypes exhibited constitutive Methionine-1 cleavage and Serine-2 acetylation. In addition, in the early proliferating stages at 0 DIV, H1.2 was mono-phosphorylated whereas H1.4 and H1.5 were di- and tri-phosphorylated, respectively (see ). Interestingly, though, the levels of phosphorylation decreased dramatically for both H1.2 and H1.4 at 8 DIV during the differentiation process in both WT and KO cells while H1.5 retained a reduced amount of mono-phosphorylation (~10%) ().
In our MS analysis, we used targeted MS2 for histone H1 phosphorylation site assignment to further determine the sites corresponding to the mono- di- and tri-phosphorylated forms of the histone H1.2, H1.4 and H1.5 subtypes ().
Nuclear distribution of MeCP2 and histone H1 subtypes
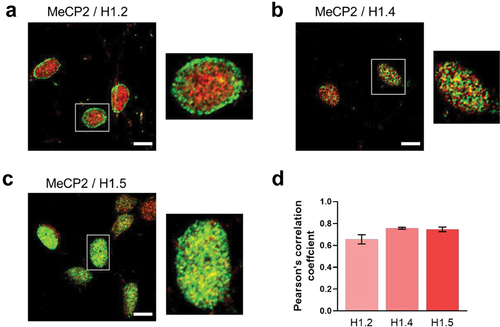
We next explored the nuclear distribution of MeCP2 and the linker histones in the ReNCell model. show immunofluorescence images of WT and MeCP2 KO ReNCell at 7 DIV using H1.2, H1.4, H1.5 and MeCP2 antibodies. Of interest was the punctate pattern of histones H1.4 and H1.5 distributions in chromatin (). Such peculiar organization was visualized both in the WT and the KO although in the latter there is a more diffuse distribution of the puncta. Histone H1.2 displays a differential association with enrichment in the nuclear periphery (). Regardless of their nuclear distribution the three histone H1 isoforms exhibit a significant extent of overlap with MeCP2 as seen in the magnified overlays in .
Figure 6. Immunofluorescence imaging of ReNCell WT and KO at 7 DIV. (A) ReNCell WT cells imaged with bright field, DAPI (blue), MeCP2 antibody (red) and histone H1.2, H1.4 and H1.5 antibodies (green). (B) same as in (A) for ReNCell KO. (C) magnified images of the histone isoform staining corresponding to the white rectangles shown in (A) for WT. (D) same as in (C) for KO. Scale bar: 20 µm.
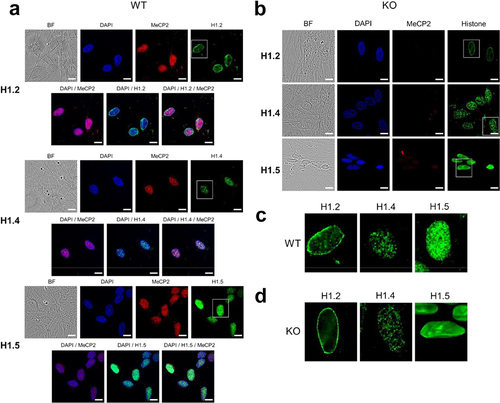
Figure 7. Histone H1 isoform/MeCP2 co-localization. (a) histone H1.2; (b) histone H1.4; (c) histone H1.5. Magnified images for the insets shown in the white rectangles are also provided. (d) quantification of the histone H1 isoform/MeCP2 co-localization using the Pearson’s correlation coefficient (n = 6). Scale bar: 10 µm.
Change in the nuclear size during ReNCell differentiation
Though the differentiated ReNCell culture was a mixed cell population expressing different neural cell markers (), the overall nuclear size of ReNCell remained quite homogeneous for each DIV in a way that depended on the WT or KO nature of the system (). The homogeneity of the nuclear sizes under different conditions can be assessed from the small standard error (). At 0 DIV, the nuclear size average (assuming a spherical conformation) was about 40% smaller in the KO compared to the WT. In the transition from 0 to 8 DIV, the size of the nuclei in WT cells decreased while that of the KO cells increased by 40% ().
Figure 8. Area of nuclei of WT and MeCP2 KO ReNCell at 0 DIV and 8 DIV. (A) DAPI images and a magnified image of representative sample in (a); (b) measurement of the nuclear areas as those shown in (a) (n = 570 for WT 0; n = 59 for KO 0; n = 285 for WT 8; n = 105 for KO 8. Two sample t-test assuming unequal variances, p < 0.0001 for all comparisons). (c) the change in nuclear diameter (size) during cortical neuron differentiation in WT and MeCP2 KO mouse are shown [Citation92] (purple lines). Also shown are the changes MeCP2 levels (blue) [Citation30,Citation95].
![Figure 8. Area of nuclei of WT and MeCP2 KO ReNCell at 0 DIV and 8 DIV. (A) DAPI images and a magnified image of representative sample in (a); (b) measurement of the nuclear areas as those shown in (a) (n = 570 for WT 0; n = 59 for KO 0; n = 285 for WT 8; n = 105 for KO 8. Two sample t-test assuming unequal variances, p < 0.0001 for all comparisons). (c) the change in nuclear diameter (size) during cortical neuron differentiation in WT and MeCP2 KO mouse are shown [Citation92] (purple lines). Also shown are the changes MeCP2 levels (blue) [Citation30,Citation95].](/cms/asset/99fb99e0-141c-45f5-ac39-253a86578fd0/kepi_a_2276425_f0008_oc.jpg)
Discussion
A MeCP2 knock-out in vitro cell system for the study of neural differentiation
Mutation-modified iPSCs and currently available neural progenitors that can be stimulated to differentiate into neuron-like cells have their own complexities. The former can display chromosomal instability and lead to the accumulation of chromosomal abnormalities during somatic reprogramming [Citation53], aberrant insertions, and loss of heterozygosity [Citation54] during prolonged in vitro culture. Cultured neural progenitor cell lines that can be simulated to differentiate in vitro such as the neuroblastoma-glioma NG108–15, neuroblastoma SH-SY5Y and pheochromocytoma PC12 have been used to analyse the change in MeCP2 during the neuronal differentiation process [Citation41]. This approach partially circumvents the intrinsic complexity of the in vivo models [Citation55] and it provides important tools in the study of neurogenesis and its alterations in neurodevelopmental and neurodegenerative disorders as well as in the development of therapeutic strategies. However, as with iPSCs, some of these cell lines also display genetic anomalies [Citation23]. To partly circumvent this, more recently an alternative LUHMES (Lund human mesencephalic) cell line has been successfully used to generate an in vitro inducible differentiation cell system containing several RTT relevant mutations [Citation23] including a MeCP2 knock-out. For this study, ReNCell VM cell line that can be differentiated in vitro to different types of neural cells was used to generate a MeCP2 knock-out counterpart [Citation24].
The initial results of the present study show that our differentiation strategy brings ReNCell to a differentiated state similar to that observed with other inducible systems [Citation41], as measured by the level of MeCP2 (). Nevertheless, as pointed out in the results section, the extent of differentiation for the in vitro ReNCell culture system is limited and by far lower than what is observed in fully differentiated in vivo neurons [Citation16,Citation56]. Therefore, ReNCell might be comparable to an early stage of differentiation rather than to a stage reached under in vivo conditions in the mature brain. Fully differentiated neurons and astrocytes exhibit an almost fivefold difference in their MeCP2 abundance [Citation57]. However, under the limited differentiation achieved, the increase in MeCP2 () that results from the mixed cell population (neurons and astrocytes) found in ReNCell culture () is assumed to be contributed similarly by both cell types.
Deletion of MeCP2 increases the level of NeuN and influences the relative neuron-astrocyte ratio during the differentiation of ReNcell
Monitoring of differentiation as it pertains to neurons produced an unexpected result in the MeCP2 KO cells in which the level of NeuN was almost doubled (). Such an increase in the neuronal differentiation marker NeuN (Fox-3, Rbfox3, or hexaribonucleotide Binding Protein-3) in the MeCP2 KO when compared to WT () is surprising. Unfortunately, the understanding of the functionality of this predominantly nuclear protein is not yet properly understood. As with MeCP2, the contribution to the abundance of this marker might be shared between the neurons and astrocytes (or cells expressing the GFAP marker). Evidence has been provided that NeuN is detected not only in neurons but also in cells expressing GFAP [Citation44]. Nevertheless, it has been reported that an altered level of NeuN can be an indicator of immature and/or suffering neurons [Citation58]. In this regard, the increase of NeuN in MeCP2 KO ReNCell at 8 DIV along with the lamellipodia structures observed () indicate that these cells may be immature and/or stressed.
Regardless of the potential significance of the NeuN results, the data presented here with the MeCP2 KO ReNCell provide support to the notion that MeCP2 plays a very important role in facilitating cell differentiation as visualized by the cellular changes observed under the microscope () in agreement with previous observations [Citation46]. Moreover, the cell compositional changes in the ReNCell culture during differentiation provide evidence for the role of the protein in specifying the cell fate during neural differentiation [Citation59].
ReNcell shows a unique histone H1 subtype composition and a decrease in H1 phosphorylation during cell differentiation
While the linker histone/core histone ratios remain constant from 0 DIV to 8 DIV in the WT ReNCell and similar to that of HeLa cells (), the apparent increase observed in the KO cells at 8 DIV () is interesting. HeLa and other non-neuronal human cell lines contain low levels of MeCP2 compared to neuronal cell lines. Therefore, it is hard to attribute such an increase to a compensatory increase of histone H1 in the absence of MeCP2 seen in MeCP2 KO mouse [Citation16] especially since no decrease in the levels of H1 were observed in the WT ReNCell during the transition from 0 DIV to 8 DIV. Any alternative explanation would have to involve a potential functional regulation of histone H1 or its subtypes [i.e. H1.4 and/or H1.5 ()] by MeCP2, something that might warrant further exploration. In this regard, the increase observed in the level of histone H1.5 at 8 DIV in the MeCP2 KO cells compared to the WT cells is unusual (). Histones H1.2 and H1.4 behave as expected as the decrease in the expression of the other subtypes (i.e. H1.2) leads to an approximate 70% predominance of histone H1.4, which has a slow turnover rate [Citation48]. In good agreement, a 78% and a 68% increase of histone H1.4 were observed for the WT and KO cells at 8 DIV, respectively (). However, while H1.2 and H1.4 exhibit the highest mRNA levels in human cell lines and exhibit a positive transcriptional co-regulation, histone H1.5 does not [Citation60]. It is thus tempting to speculate a potential involvement of MeCP2 in the regulation of histone H1.5 (see below).
Histone H1.0 is a replication-independent linker histone. It is the product of an orphan gene which is evolutionarily related to several invertebrate sperm histone H1s [Citation61,Citation62]. In vertebrates, histone H1.0 has often been associated with terminal differentiation [Citation63,Citation64] as for instance in mammalian cortical neurons [Citation65]. Thus, while the almost absence of H1.0 in ReNCell is surprising, this may be explained by previous results showing that not every neuronal cell type expresses histone H1.0 [Citation66]. The lack of histone H1.0 cannot be attributed to the dual cellular composition of the ReNCell culture as histone H1.0 is expressed in astrocytes [Citation67,Citation68] where proliferation and differentiation are not directly related to the accumulation of this histone H1 subtype [Citation67]. Whether the low levels of H1.0 are due to the mesencephalic origin of the cell line or to the artificial immortalization used to generate the cell line remains to be elucidated.
While it has been described that pluripotent cell differentiation affects the phosphorylation of histone H1 [Citation69], the drastic decrease of this PTM in ReNCell () is interesting and not unprecedented. It has also been described that histone H1 phosphorylation is regulated in a site-specific fashion during pluripotent cell differentiation [Citation69]. As seen in , the higher levels of H1 phosphorylation in ReNCell were observed with H1.5, in agreement with the results previously obtained with pluripotent NT2 cells [Citation69]. Histone H1.5 also had a larger number of phosphorylated sites (pS18, pS173, and S189) with pS18 present in the mono-phosphorylated, di-phosphorylated (pS18-pS173) and tri-phosphorylated (pS18, pS173-pS189) combinations. They correspond to the growth-associated sites previously reported for the histone H1.5 subtype that appear to sequentially accumulate along the progression of the cell cycle [Citation70]. Histones H1.2 and H1.4 had a less complex phosphorylation composition, and the sites were in agreement with earlier data [Citation69–71] with H1.2 consisting only of a mono-phosphorylated pS173 [Citation71]. The drastic decrease of this PTM in ReNCell () is interesting and not unprecedented as dephosphorylation of linker histone H1 has been involved in the modulation of the chromatin dynamics which is necessary for erythroid differentiation [Citation72].
Histone H1 predominantly co-localizes with MeCP2 in WT ReNcell
Histones H1.4 and H1.2 are the ancestral histone H1s responsible for the primordial organization of chromatin into heterochromatin and euchromatin domains [Citation64] and hence they can be considered to be good markers for these chromatin domains.
Relative affinity and chromatin compaction analyses using biophysical approaches indicate that histone H1.4 strongly binds to and compacts chromatin, which deem this subtype one of the ideal candidates for facilitating heterochromatinization [Citation64]. In this regard, an interesting observation regarding histones H1.4 and H1.5 has to do with their punctate distribution (). The similar distribution of these two isoforms in ReNCell is not surprising as H1.5 has also been localized to gene inactivation regions in differentiating cells [Citation49,Citation64] and both isoforms have a similar chromatin binding affinity [Citation73,Citation74]. The average diameter of the puncta observed in is about 300 nm. Assuming these puncta correspond to spherical chromatin domains each one of them would contain approximately 20,000 nucleosomes (average diameter 11 nm) which corresponds to about 4,000 kb. Every cell has TADs [Citation75], and each TAD can range in size from 100 kb to 5 Mb [Citation76]. The average number of genes per TAD in neurons is approximately 2.6 [Citation77]. Hence, it appears that H1.4 and H1.5 in the ReNCell at 7 DIV are homogeneously distributed across the nucleus and accumulate in large TADs, which is indicative of a remarkable organization of chromatin. The punctate organization of H1.4 has also been observed in proliferating T47D cancer cells [Citation78]. Regardless of such unique organization, both histones H1.4 and H1.5 display a substantial overlap with MeCP2 ().
In contrast to H1.4 and H1.5, histone H1.2 showed a preferential enrichment towards the nuclear periphery (), in agreement with [Citation78]. However, considering that chromatin regions containing only H1.2 have an open chromatin conformation [Citation64] and that the chromatin regions at such location LADs (nuclear lamina associated domains) generally correspond to repressive environments of the genome [Citation79], such an enrichment at that location remains unexplained.
From the immunofluorescence analyses, it seems that MeCP2 and histone H1 substantially overlap in ReNCell () with histone H1.2 displaying the lowest overlap as determined by the Pearson’s correlation coefficient (PCC) (). Thus, within the limits of resolution with this technique, a segregated compartmentalization between global histone and MeCP2 [Citation80] is not observed.
The lack of MeCP2 changes cell morphology and nuclear size during differentiation
MeCP2 KO ReNCell appears to struggle during the differentiation process as evidenced by a cellular shape that significantly differs from that of the WT counterpart () more clearly visualized at 8 DIV. At this stage, the KO cells are less differentiated and/or attempting to differentiate with incipient axon-dendrite like cytoplasmic projections. Importantly, the cells seem to aggregate with each other (, ‘KO 8 DIV’). A possible explanation for this behaviour is provided by the early observations of Armstrong et al. where neurons from MeCP2 KO mice showed a decrease in the number and length of dendrites as well as more dense packing of neurons [Citation81]. Assuming that MeCP2 KO ReNCell mimics the phenotype of the in vivo MeCP2 KO mouse neurons, the changes caused by the lack of MeCP2 may cause ReNCell to stay close together as opposed to the WT where cells have proper neurite outgrowths and are spaced out. Chen et al. had similar observations where the deletion of the MBD of MeCP2 led to neurons being more densely packed [Citation18]. A recent study using cerebrospinal fluid proteomes and metabolic convergent ontologies in humans and animal models of RTT has shown that loss of function of MeCP2 (as in RTT-associated mutations) results in synaptic, metabolic, and mitochondrial dysfunction [Citation82]. The critical involvement of MeCP2 for synapse formation had been previously documented [Citation83] and MeCP2 deficiency impairs ciliogenesis [Citation84]. Hence, the impaired changes in cell morphology we observe in the MeCP2 KO ReNCell are not surprising.
An important finding in this paper is the changes observed in the nuclear size of the ReNCell in the absence of MeCP2 (). Decrease in the size of the nucleus of cortical neurons from the mouse MeCP2 KO has been attributed to the increase in histone H1 observed in these neurons [Citation16,Citation47]. Such claim was based on the observations made in an earlier work from the Gorovsky lab using Tetrahymena where the size of the nucleus decreased with the increase of linker histones [Citation85]. However, as mentioned throughout the text, ReNCell experiences a moderate increase in MeCP2 during differentiation () compared to what is observed in brain [Citation56,Citation57] or in cortical neurons [Citation16]. If nothing else, the slight increase in histone H1 observed in MeCP2 KO ReNCell at 8 DIV () counterintuitively exhibits the opposite trend. Moreover, a mouse RTT model expressing low amounts of a truncated version of MeCP2 with a partially deleted MBD with an unaffected H1 composition [Citation86] exhibits a nuclear decrease similar to that observed in [Citation47].
Factors affecting the nuclear size appear to be complex. In addition to DNA compaction (and hence histone H1), nuclear size can be regulated by the nuclear membrane and nuclear lamina composition [Citation87]. For instance, a correlation has been demonstrated to exist between chromatin mobility and nuclear size recently [Citation88]. Lamin B1 expression is downregulated in ReNCell [Citation42]. MeCP2 further alters the expression of lamins [Citation89] and it interacts with inner nuclear membrane lamin B receptor [Citation90,Citation91]. In the case of the ReNCell system, it appears that MeCP2 rather than histone H1 is the primary cause of the nuclear changes observed in the MeCP2 KO cells (). Of interest, the nuclear size changes observed by us () agree well with those observed in the in vivo MeCP2 KO mouse model () during differentiation [Citation92].
An important consideration in all the above is the low standard error for the nuclear size at the different DIVs despite the mixed cell population in the ReNCell culture consisting of two main cell types expressing a neuron (NeuN) and an astrocyte (GFAP) marker (). This is despite the fact that astrocytes have been reported to contain approximately 1/6–1/7 the amount of MeCP2 as in neurons [Citation57]. A speculative explanation for that is that the immortalization process of the ReNCell itself, which involves v-myc transfection could affect the nuclear lamin composition. Both v-myc and c-myc encoded proteins associate with matrix-lamin and their alteration can affect the nuclear structure organization [Citation93]. However, the effect on the nuclear size from the v-myc transfection is most likely overridden by the effect from the lack of MeCP2 in the MeCP2 KO cells. If this is indeed the case, it would imply that the involvement of the lack of MeCP2 in the nuclear size is not of a structural but of a regulatory nature. In addition to altering the expression of lamins, MeCP2 may regulate other genes involved in membrane formation such as histone H1.5, which showed a higher expression in the MeCP2 KO at 8 DIV compared to 0 DIV (). Indeed, in differentiated cells, H1.5 has been shown to preferentially bind to genes encoding for membrane and membrane – related proteins [Citation94].
Concluding remarks
This study represents a preamble to the use of this powerful MeCP2 knockout cell line for the study of functional implications of MeCP2 related to chromatin. It shows that despite the cell line’s potential for functional studies, such an approach has certain limitations that need to be considered when using such systems.
The limited increase in MeCP2 observed with the ReNCell during differentiation, which is almost identical to that achieved with other cultured cell lines that can also be differentiated in vitro into neuron-like post-mitotic cells [Citation41], limits their efficacy for the study of the effects of MeCP2 on chromatin. However, as shown here, ReNCell provides a venue to study the regulatory effects of MeCP2 on other chromosomal proteins and on nuclear organization.
Author contributions
B.K. and E.S., experimental work (biochemical/immunofluorescence); L.R., Mass spectrometry work; J.S. and D.F.H., Mass spectrometry; K.D., R.C., M.E., and S.G., conceptualization; J.A. Writing of the manuscript and conceptualization; B.K., L.R., S.G. and J.S., Proofreading and editing.
All authors have read and agreed to the published version of the manuscript.
Supplemental Material
Download Zip (159.6 KB)Acknowledgments
This work was supported by a grant of the Ontario Rett Syndrome Association (ORSA) to JA and NIH grant GM037537 to D.F.H. We thank Lissa C. Anderson of the National High Magnetic Field Laboratory (NHMFL) for advice on mass spectrometry experiments and data analysis, and Greg Blakney of NHMFL for Predator Manual Validation Helper v2.8. We thank Dina L. Bai of the University of Virginia for Fragment Calculator.
Disclosure statement
No potential conflict of interest was reported by the author(s).
Data availability statement
Data available upon request at https://osf.io/cn9sd/?view_only=5204f3c32a644514a249c40365591556
Supplementary material
Supplemental data for this article can be accessed online at https://doi.org/10.1080/15592294.2023.2276425
Correction Statement
This article has been republished with minor changes. These changes do not impact the academic content of the article.
Additional information
Funding
References
- Ausio J. MeCP2 and the enigmatic organization of brain chromatin. Implications for depression and cocaine addiction. Clin Epigenetics. 2016;8(1):58. doi: 10.1186/s13148-016-0214-5
- Amir RE, Van den Veyver IB, Wan M, et al. Rett syndrome is caused by mutations in X-linked MECP2, encoding methyl-CpG-binding protein 2. Nat Genet. 1999;23(2):185–24. doi: 10.1038/13810
- Rett A. [On a unusual brain atrophy syndrome in hyperammonemia in childhood]. Wien Med Wochenschr. 1966;116(37):723–726.
- Neul JL, Zoghbi HY. Rett syndrome: a prototypical neurodevelopmental disorder. Neuroscientist. 2004;10(2):118–128. doi: 10.1177/1073858403260995
- van Holde KE. Chromatin. NY: Springer-Verlag; 1988.
- Cole RD. A minireview of microheterogeneity in H1 histone and its possible significance. Anal Biochem. 1984;136(1):24–30. doi: 10.1016/0003-2697(84)90303-8
- Parseghian MH, Hamkalo BA. A compendium of the histone H1 family of somatic subtypes: an elusive cast of characters and their characteristics. Biochem Cell Biol. 2001;79(3):289–304. doi: 10.1139/o01-099
- Millan-Arino L, Izquierdo-Bouldstridge A, Jordan A. Specificities and genomic distribution of somatic mammalian histone H1 subtypes. Biochim Biophys Acta. 2015;1859(3):510–519. doi: 10.1016/j.bbagrm.2015.10.013
- Vincent JB, Ausio J. MeCP2: latest insights fundamentally change our understanding of its interactions with chromatin and its functional attributes. BioEssays. 2021;43(3):e2000281. doi: 10.1002/bies.202000281
- Lee W, Kim J, Yun J-M, et al. MeCP2 regulates gene expression through recognition of H3K27me3. Nat Commun. 2020;11(1):3140. doi: 10.1038/s41467-020-16907-0
- Ghosh RP, Horowitz-Scherer RA, Nikitina T, et al. MeCP2 binds cooperatively to its substrate and competes with histone H1 for chromatin binding sites. Mol Cell Biol. 2010;30(19):4656–4670. doi: 10.1128/MCB.00379-10
- Ito-Ishida A, Yamalanchili HK, Shao Y, et al. Genome-wide distribution of linker histone H1.0 is independent of MeCP2. Nat Neurosci. 2018;21(6):794–798. doi: 10.1038/s41593-018-0155-8
- Nan X, Campoy FJ, Bird A. MeCP2 is a transcriptional repressor with abundant binding sites in genomic chromatin. Cell. 1997;88(4):471–481. doi: 10.1016/S0092-8674(00)81887-5
- Tillotson R, Bird A. The molecular basis of MeCP2 function in the brain. J Mol Biol. 2019;432(6):1602–1623. doi: 10.1016/j.jmb.2019.10.004
- Good KV, Vincent JB, Ausio J. MeCP2: the genetic driver of Rett syndrome epigenetics. Front Genet. 2021;12:620859. doi: 10.3389/fgene.2021.620859
- Skene PJ, Illingworth RS, Webb S, et al. Neuronal MeCP2 is expressed at near histone-octamer levels and globally alters the chromatin state. Mol Cell. 2010;37(4):457–468. doi: 10.1016/j.molcel.2010.01.030
- Guy J, Hendrich B, Holmes M, et al. A mouse Mecp2-null mutation causes neurological symptoms that mimic Rett syndrome. Nat Genet. 2001;27(3):322–326. doi: 10.1038/85899
- Chen RZ, Akbarian S, Tudor M, et al. Deficiency of methyl-CpG binding protein-2 in CNS neurons results in a Rett-like phenotype in mice. Nat Genet. 2001;27(3):327–331. doi: 10.1038/85906
- Brown K, Selfridge J, Lagger S, et al. The molecular basis of variable phenotypic severity among common missense mutations causing Rett syndrome. Hum Mol Genet. 2016;25(3):558–570. doi: 10.1093/hmg/ddv496
- Lamonica JM, Kwon DY, Goffin D, et al. Elevating expression of MeCP2 T158M rescues DNA binding and Rett syndrome–like phenotypes. J Clin Invest. 2017;127(5):1889–1904. doi: 10.1172/JCI90967
- Heckman LD, Chahrour MH, Zoghbi HY. Rett-causing mutations reveal two domains critical for MeCP2 function and for toxicity in MECP2 duplication syndrome mice. Elife. 2014;3:3. doi: 10.7554/eLife.02676
- Merritt JK, Collins BE, Erickson KR, et al. Pharmacological read-through of R294X Mecp2 in a novel mouse model of Rett syndrome. Hum Mol Genet. 2020;29(15):2461–2470. doi: 10.1093/hmg/ddaa102
- Shah RR, Cholewa-Waclaw J, Davies FCJ, et al. Efficient and versatile CRISPR engineering of human neurons in culture to model neurological disorders. Wellcome Open Res. 2016;1:13. doi: 10.12688/wellcomeopenres.10011.1
- Siqueira E, Obiols-Guardia A, Jorge-Torres OC, et al. Analysis of the circRNA and T-UCR populations identifies convergent pathways in mouse and human models of Rett syndrome. Mol Ther Nucleic Acids. 2022;27:621–644. doi: 10.1016/j.omtn.2021.12.030
- Donato R, Miljan EA, Hines SJ, et al. Differential development of neuronal physiological responsiveness in two human neural stem cell lines. BMC Neurosci. 2007;8(1):36. doi: 10.1186/1471-2202-8-36
- Choi SH, Kim YH, Hebisch M, et al. A three-dimensional human neural cell culture model of Alzheimer’s disease. Nature. 2014;515(7526):274–278. doi: 10.1038/nature13800
- Choi SH, Kim YH, Quinti L, et al. 3D culture models of Alzheimer’s disease: a road map to a “cure-in-a-dish”. Mol Neurodegener. 2016;11(1):75. doi: 10.1186/s13024-016-0139-7
- Song Y, Subramanian K, Berberich MJ, et al. A dynamic view of the proteomic landscape during differentiation of ReNcell VM cells, an immortalized human neural progenitor line. Sci Data. 2019;6(1):190016. doi: 10.1038/sdata.2019.16
- Ausió J, van Holde KE. Histone hyperacetylation: its effects on nucleosome conformation and stability. Biochemistry. 1986;25(6):1421–1428. doi: 10.1021/bi00354a035
- Martínez de Paz A, Khajavi L, Martin H, et al. MeCP2-E1 isoform is a dynamically expressed, weakly DNA-bound protein with different protein and DNA interactions compared to MeCP2-E2. Epigenet Chromatin. 2019;12(1):63. doi: 10.1186/s13072-019-0298-1
- Ausió J, Borochov N, Seger D, et al. Interaction of chromatin with NaCl and MgCl2. Solubility and binding studies, transition to and characterization of the higher-order structure. J Mol Biol. 1984;177(3):373–398. doi: 10.1016/0022-2836(84)90291-2
- Laemmli UK. Cleavage of structural proteins during the assembly of the head of bacteriophage T4. Nature. 1970;227(259):680–685. doi: 10.1038/227680a0
- Medrzycki M, Zhang Y, McDonald J F et al. Profiling of linker histone variants in ovarian cancer. Front Biosci. 2012;17(1):396–406. doi: 10.2741/3934
- Geigges M, Gubser PM, Unterstab G, et al. Reference genes for expression studies in human CD8+ naïve and effector memory T cells under resting and activating conditions. Sci Rep. 2020;10(1):9411. doi: 10.1038/s41598-020-66367-1
- D’Ippolito RA, Minamino N, Rivera-Casas C, et al. Protamines from liverwort are produced by post-translational cleavage and C-terminal di-aminopropanelation of several male germ-specific H1 histones. J Biol Chem. 2019;294(44):16364–16373. doi: 10.1074/jbc.RA119.010316
- UniProt C, Martin M-J, Orchard S. UniProt: the universal protein knowledgebase in 2023. Nucleic Acids Res. 2023;51(D1):D523–D531. doi: 10.1093/nar/gkac1052
- Senko MW, Beu SC, McLaffertycor FW. Determination of monoisotopic masses and ion populations for large biomolecules from resolved isotopic distributions. J Am Soc Mass Spectrom. 1995;6(4):229–233. doi: 10.1016/1044-0305(95)00017-8
- Wu Z, Roberts DS, Melby JA, et al. MASH explorer: a universal software environment for top-down Proteomics. J Proteome Res. 2020;19(9):3867–3876. doi: 10.1021/acs.jproteome.0c00469
- Kou Q, Xun L, Liu X. TopPIC: a software tool for top-down mass spectrometry-based proteoform identification and characterization. Bioinformatics. 2016;32(22):3495–3497. doi: 10.1093/bioinformatics/btw398
- Bolte S, Cordelieres FP. A guided tour into subcellular colocalization analysis in light microscopy. J Microsc. 2006;224(3):213–232. doi: 10.1111/j.1365-2818.2006.01706.x
- Jung BP, Jugloff DGM, Zhang G, et al. The expression of methyl CpG binding factor MeCP2 correlates with cellular differentiation in the developing rat brain and in cultured cells. J Neurobiol. 2003;55(1):86–96. doi: 10.1002/neu.10201
- Hoffrogge R, Mikkat S, Scharf C, et al. 2-DE proteome analysis of a proliferating and differentiating human neuronal stem cell line (ReNcell VM). Proteomics. 2006;6(6):1833–1847. doi: 10.1002/pmic.200500556
- Kishi N, Macklis JD. MECP2 is progressively expressed in post-migratory neurons and is involved in neuronal maturation rather than cell fate decisions. Mol Cell Neurosci. 2004;27(3):306–321. doi: 10.1016/j.mcn.2004.07.006
- Gusel’nikova VV, Korzhevskiy DE. NeuN As a Neuronal Nuclear Antigen and Neuron Differentiation Marker. Acta Naturae. 2015;7(2):42–47. doi: 10.32607/20758251-2015-7-2-42-47
- Bates DL, Thomas JO. Histones H1 and H5: one or two molecules per nucleosome? Nucleic Acids Res. 1981;9(22):5883–5894. doi: 10.1093/nar/9.22.5883
- Tsujimura K, Abematsu M, Kohyama J, et al. Neuronal differentiation of neural precursor cells is promoted by the methyl-CpG-binding protein MeCP2. Exp Neurol. 2009;219(1):104–111. doi: 10.1016/j.expneurol.2009.05.001
- Yazdani M, Deogracias R, Guy J, et al. Disease modeling using embryonic stem cells: MeCP2 regulates nuclear size and RNA synthesis in neurons. Stem Cells. 2012;30(10):2128–2139. doi: 10.1002/stem.1180
- Piña B, Martínez P, Suau P. Changes in H1 complement in differentiating rat-brain cortical neurons. Eur J Biochem. 1987;164(1):71–76. doi: 10.1111/j.1432-1033.1987.tb10994.x
- Prendergast L, Reinberg D. The missing linker: emerging trends for H1 variant-specific functions. Genes Dev. 2021;35(1–2):40–58. doi: 10.1101/gad.344531.120
- Wisniewski JR, Zougman A, Krüger S, et al. Mass spectrometric mapping of linker histone H1 variants reveals multiple acetylations, methylations, and phosphorylation as well as differences between cell culture and tissue. Mol & Cell Proteomics. 2007;6(1):72–87. doi: 10.1074/mcp.M600255-MCP200
- Harshman SW, Young NL, Parthun MR, et al. H1 histones: current perspectives and challenges. Nucleic Acids Res. 2013;41(21):9593–9609. doi: 10.1093/nar/gkt700
- Garcia BA, Busby SA, Barber CM, et al. Characterization of phosphorylation sites on histone H1 isoforms by tandem mass spectrometry. J Proteome Res. 2004;3(6):1219–1227. doi: 10.1021/pr0498887
- Liu X, Li C, Zheng K, et al. Chromosomal aberration arises during somatic reprogramming to pluripotent stem cells. Cell Div. 2020;15(1):12. doi: 10.1186/s13008-020-00068-z
- Simkin D, Papakis V, Bustos BI, et al. Homozygous might be hemizygous: CRISPR/Cas9 editing in iPscs results in detrimental on-target defects that escape standard quality controls. Stem Cell Rep. 2022;17(4):993–1008. doi: 10.1016/j.stemcr.2022.02.008
- Azari H, Reynolds BA. In Vitro Models for Neurogenesis. Cold Spring Harb Perspect Biol. 2016;8(6):8(6. doi: 10.1101/cshperspect.a021279
- Thambirajah AA, Ng MK, Frehlick LJ, et al. MeCP2 binds to nucleosome free (linker DNA) regions and to H3K9/H3K27 methylated nucleosomes in the brain. Nucleic Acids Res. 2012;40(7):2884–2897. doi: 10.1093/nar/gkr1066
- Zachariah RM, Olson CO, Ezeonwuka C, et al. Novel MeCP2 isoform-specific antibody reveals the endogenous MeCP2E1 expression in murine brain, primary neurons and astrocytes. PLoS One. 2012;7(11):e49763. doi: 10.1371/journal.pone.0049763
- Lavezzi AM, Corna MF, Matturri L. Neuronal nuclear antigen (NeuN): a useful marker of neuronal immaturity in sudden unexplained perinatal death. J Neurol Sci. 2013;329(1–2):45–50. doi: 10.1016/j.jns.2013.03.012
- Nakashima H, Tsujimura K, Irie K, et al. MeCP2 controls neural stem cell fate specification through miR-199a-mediated inhibition of BMP-Smad signaling. Cell Rep. 2021;35(7):109124. doi: 10.1016/j.celrep.2021.109124
- Ponte I, Andrés M, Jordan A, et al. Towards understanding the regulation of histone H1 somatic subtypes with OMICs. J Mol Biol. 2021;433(2):166734. doi: 10.1016/j.jmb.2020.166734
- Schulze E, Schulze B. The vertebrate linker histones H10, H5, and H1M are descendants of invertebrate ?orphon? histone H1 genes. J Mol Evol. 1995;41(6):833–840. doi: 10.1007/BF00173162
- Eirin-Lopez JM, Ausio J. Origin and evolution of chromosomal sperm proteins. BioEssays. 2009;31(10):1062–1070. doi: 10.1002/bies.200900050
- Zlatanova J, Doenecke D. Historie H1°: a major player in cell differentiation? FASEB J. 1994;8(15):1260–1268. doi: 10.1096/fasebj.8.15.8001738
- Parseghian MH. What is the role of histone H1 heterogeneity? A functional model emerges from a 50 year mystery. AIMS Biophys. 2015;2(4):724–772. doi: 10.3934/biophy.2015.4.724
- Piña B, Martínez P, Simón L, et al. Differential kinetics of histone H1o accumulation in neuronal and glial cells from rat cerebral cortex during postnatal development. Biochem Biophys Res Commun. 1984;123(2):697–702. doi: 10.1016/0006-291X(84)90285-7
- Ponte I, Martínez P, Ramírez A, et al. Transcriptional activation of Histone H1° during neuronal terminal differentiation. Brain Res Dev Brain Res. 1994;80(1–2):35–44. doi: 10.1016/0165-3806(94)90087-6
- Ortiz-Caro J, Yusta B, Pascual A, et al. Proliferation and differentiation are not directly related to H1(0) accumulation in cultured glial cells. Brain Res. 1988;470(2):229–237. doi: 10.1016/0165-3806(88)90241-6
- Schiera G, DI LIEGRO CM, SALADINO P, et al. Oligodendroglioma cells synthesize the differentiation-specific linker histone H1° and release it into the extracellular environment through shed vesicles. Int J Oncol. 2013;43(6):1771–1776. doi: 10.3892/ijo.2013.2115
- Liao R, Mizzen CA. Site-specific regulation of histone H1 phosphorylation in pluripotent cell differentiation. Epigenet Chromatin. 2017;10(1):29. doi: 10.1186/s13072-017-0135-3
- Talasz H, Sarg B, Lindner HH. Site-specifically phosphorylated forms of H1.5 and H1.2 localized at distinct regions of the nucleus are related to different processes during the cell cycle. Chromosoma. 2009;118(6):693–709. doi: 10.1007/s00412-009-0228-2
- Sarg B, Helliger W, Talasz H, et al. Histone H1 phosphorylation occurs site-specifically during interphase and mitosis: identification of a novel phosphorylation site on histone H1. J Biol Chem. 2006;281(10):6573–6580. doi: 10.1074/jbc.M508957200
- Yellajoshyula D, Brown DT. Global modulation of chromatin dynamics mediated by dephosphorylation of linker histone H1 is necessary for erythroid differentiation. Proc Natl Acad Sci U S A. 2006;103(49):18568–18573. doi: 10.1073/pnas.0606478103
- Liao LW, Cole RD. Condensation of dinucleosomes by individual subfractions of H1 histone. J Biol Chem. 1981;256(19):10124–10128. doi: 10.1016/S0021-9258(19)68752-1
- Raghuram N, Carrero G, Stasevich TJ, et al. Core histone hyperacetylation impacts cooperative behavior and high-affinity binding of histone H1 to chromatin. Biochemistry. 2010;49(21):4420–4431. doi: 10.1021/bi100296z
- Schmitt AD, Hu M, Jung I, et al. A compendium of chromatin contact maps reveals spatially active regions in the human genome. Cell Rep. 2016;17(8):2042–2059. doi: 10.1016/j.celrep.2016.10.061
- Rocha PP, Raviram R, Bonneau R, et al. Breaking TADs: insights into hierarchical genome organization. Epigenomics. 2015;7(4):523–526. doi: 10.2217/epi.15.25
- Long HS, Greenaway S, Powell G, et al. Making sense of the linear genome, gene function and TADs. Epigenet Chromatin. 2022;15(1):4. doi: 10.1186/s13072-022-00436-9
- Serna-Pujol N, Salinas-Pena M, Mugianesi F, et al. Coordinated changes in gene expression, H1 variant distribution and genome 3D conformation in response to H1 depletion. Nucleic Acids Res. 2022;50(7):3892–3910. doi: 10.1093/nar/gkac226
- Briand N, Collas P. Lamina-associated domains: peripheral matters and internal affairs. Genome Biol. 2020;21(1):85. doi: 10.1186/s13059-020-02003-5
- Wang L, Hu M, Zuo M-Q, et al. Rett syndrome-causing mutations compromise MeCP2-mediated liquid–liquid phase separation of chromatin. Cell Res. 2020;30(5):393–407. doi: 10.1038/s41422-020-0288-7
- Armstrong D, Dunn JK, Antalffy B, et al. Selective dendritic alterations in the cortex of Rett syndrome. J Neuropathol Exp Neurol. 1995;54(2):195–201. doi: 10.1097/00005072-199503000-00006
- Zlatic SA, Duong D, Gadalla KKE, et al. Convergent cerebrospinal fluid proteomes and metabolic ontologies in humans and animal models of Rett syndrome. iScience. 2022;25(9):104966. doi: 10.1016/j.isci.2022.104966
- Chao HT, Zoghbi HY, Rosenmund C. MeCP2 controls excitatory synaptic strength by regulating glutamatergic synapse number. Neuron. 2007;56(1):58–65. doi: 10.1016/j.neuron.2007.08.018
- Frasca A, Spiombi E, Palmieri M, et al. MECP2 mutations affect ciliogenesis: a novel perspective for Rett syndrome and related disorders. EMBO Mol Med. 2020;12(6):e10270. doi: 10.15252/emmm.201910270
- Shen X, Yu L, Weir JW, et al. Linker histories are not essential and affect chromatin condensation in vivo. Cell. 1995;82(1):47–56. doi: 10.1016/0092-8674(95)90051-9
- Stuss DP, Cheema M, Ng MK, et al. Impaired in vivo binding of MeCP2 to chromatin in the absence of its DNA methyl-binding domain. Nucleic Acids Res. 2013;41(9):4888–4900. doi: 10.1093/nar/gkt213
- Vahabikashi A, Adam SA, Medalia O, et al. Nuclear lamins: Structure and function in mechanobiology. APL Bioeng. 2022;6(1):011503. doi: 10.1063/5.0082656
- Yesbolatova AK, Arai R, Sakaue T, et al. Formulation of chromatin mobility as a function of nuclear size during C. elegans embryogenesis using polymer physics theories. Phys Rev Lett. 2022;128(17):178101. doi: 10.1103/PhysRevLett.128.178101
- Babbio F, Castiglioni I, Cassina C, et al. Knock-down of methyl CpG-binding protein 2 (MeCP2) causes alterations in cell proliferation and nuclear lamins expression in mammalian cells. BMC Cell Biol. 2012;13(1):19. doi: 10.1186/1471-2121-13-19
- Guarda A, Bolognese F, Bonapace IM, et al. Interaction between the inner nuclear membrane lamin B receptor and the heterochromatic methyl binding protein, MeCP2. Exp Cell Res. 2009;315(11):1895–1903. doi: 10.1016/j.yexcr.2009.01.019
- Liokatis S, Edlich C, Soupsana K, et al. Solution structure and molecular interactions of lamin B receptor Tudor domain. J Biol Chem. 2012;287(2):1032–1042. doi: 10.1074/jbc.M111.281303
- Singleton MK, Gonzales ML, Leung KN, et al. MeCP2 is required for global heterochromatic and nucleolar changes during activity-dependent neuronal maturation. Neurobiol Dis. 2011;43(1):190–200. doi: 10.1016/j.nbd.2011.03.011
- Eisenman RN, Tachibana CY, Abrams HD, et al. V-myc- and c-myc-encoded proteins are associated with the nuclear matrix. Mol Cell Biol. 1985;5(1):114–126. doi: 10.1128/MCB.5.1.114
- Li JY, Patterson M, Mikkola HKA, et al. Dynamic distribution of linker histone H1.5 in cellular differentiation. PLoS Genet. PLoS Genet. 2012;8(8):e1002879. doi: 10.1371/journal.pgen.1002879
- Olson CO, Zachariah RM, Ezeonwuka CD, et al. Brain region-specific expression of MeCP2 isoforms correlates with DNA methylation within Mecp2 regulatory elements. PLoS One. 2014;9(3):e90645. doi: 10.1371/journal.pone.0090645