
ABSTRACT
DNA methylation plays a key role in sex determination and differentiation in vertebrates. However, there are few studies on DNA methylation involved in chicken gonad development, and most focused on male hypermethylated regions (MHM). It is unclear whether there are specific differentially methylated regions (DMRs) in chicken embryonic gonads regulating sex determination and differentiation. Here, the DNA methylation maps showed that the difference of DNA methylation level between sexes was much higher at embryonic day 10 (E10) than that at embryonic day 6 (E6), and the significant differentially methylated regions at both stages were mainly distributed on the Z chromosome, including MHM1 and MHM2. The results of bisulphite sequencing PCR (BSP) and qRT-PCR showed hypomethylation of female MHM and upregulation of long non-coding RNAs (lncRNAs) whose promoter in the MHM region was consistent with the sequencing results, and similar results were in brain and muscle. In female sex-reversed gonads, the methylation pattern of MHM remained unchanged, and the expression levels of the three candidate lncRNAs were significantly decreased compared with those in females, but were significantly increased compared to males. The fluorescence in situ hybridization (FISH) results also showed that these lncRNAs were highly expressed in female embryonic gonads. The results of methyltransferase inhibitor and dual-luciferase reporter assay suggest that lncRNA expression may be regulated by DNA methylation within their promoters. Therefore, we speculated that MHM may be involved in cell-autonomous sex identity in chickens, and that lncRNAs regulated by MHM may be involved in female sexual differentiation.
Introduction
Avian sex is genetically determined by the composition of sex chromosomes during fertilization. SRY has been identified as a sex determinant in mammals but not in birds. Two sex determination hypotheses, Z chromosome dosage determination and W chromosome determination, have been proposed for chickens [Citation1]. Later, many studies indicated that chicken sex determination might depend on the dosage mechanism of Z chromosome genes, and the most likely candidate gene is DMRT1 [Citation2]. Decreased levels of DMRT1 have been shown to lead to feminization of genetic male (ZZ) gonads [Citation3], and overexpression of DMRT1 masculinizes genetic female (ZW) gonads [Citation4]. ZZ chicken embryos with a single functional copy of DMRT1 developed an ovary in place of the testes, suggesting that DMRT1 is the key sex determination switch in birds and is essential for testis development [Citation5]. However, these ZZ adult birds with ovaries were indistinguishable in appearance from wild-type adult males, supporting the concept of cell-autonomous sex identity (CASI) in birds [Citation5].
Cell-autonomous sex identity plays an important role in sexual indifference and sexual dimorphism in birds. Analysis of bilateral sex chimeric birds revealed that they were exposed to the same gonad hormones on both sides, but responded differently on each side, suggesting that gonad development and the sexual phenotype are cell-autonomous [Citation6]. The cellular identity of males and females in avian tissues is a direct result of a large number of sex chromosome genes being expressed at different levels between the sexes. These CASI genes are considered to be expressed in a sexually dimorphic fashion in all cells and tissues at all stages of development [Citation7]. In a study of the chicken gonadal chimera model, it was found that CASI was only applied to the formation of the medulla and not the cortex. Therefore, we propose that the left and right medulla differentiate along the male or female pathway strictly based on CASI, depending on whether the cells are ZW or ZZ; however, the formation of the cortex can occur independently of the phenotypic sex of the medulla and be promoted by oestrogen signalling [Citation8].
Epigenetics plays an important role in the regulation of gene expression during sex determination and sexual differentiation in animals. The role of DNA methylation in temperature-dependent sex determination in animals has been widely reported. Previous studies have shown that the promoter of the aromatase gene CYP19A1 in fish and reptiles has higher DNA methylation levels in males than in females. In European seabass, elevated temperatures during a critical period of early development increased DNA methylation levels at the aromatase promoter, which prevented the expression of CYP19A1 [Citation9]. In alligators, elevated CYP19A1 promoter methylation levels and decreased gene expression levels were observed in gonads when embryos were incubated at male production temperatures compared to those incubated at female production temperatures [Citation10]. Expression of the mammalian sex-determining gene Sry has also been reported to be regulated by DNA methylation in the promoter region [Citation11].
DNA methylation may play a role in the regulation of avian sex chromosomes. The distribution of CpG islands has been shown to significantly affect Z-linked gene dosage compensation in chickens [Citation12]. It had been identified a region of the chicken Z chromosome that is differentially methylated between males and females, known as the male hypermethylated region (MHM) [Citation13]. Genes near the MHM region show significantly higher expression in females than in males [Citation14]. In a recent whole-genome bisulphite sequencing (WGBS) study of four tissues (brain, retina, lung, and muscle) in chickens and white-throated sparrows, DNA methylation differences between Z chromosomes were limited to only a few regions, including the previously identified male hypermethylated region 1 (MHM1) and a newly discovered male hypermethylated region (MHM2) [Citation15].
However, genome-wide DNA methylation analysis in chicken embryonic gonads has not yet been performed, and it is unclear whether gonad-specific differentially methylated regions (DMRs) regulate sex determination and sexual differentiation. To fill this gap, chromosomal DNA methylation landscapes between sexes were explored in chicken gonads at different stages of sexual differentiation, and the findings of integrating transcriptome and methylome data offer new insights into the epigenetic regulation of gene expression between sexes.
Materials and methods
Sample collection
Fertilized chicken eggs were obtained from a commercial supplier and incubated under humid condition at 37.8°C. Chicken embryos were removed from eggs at embryonic day 6 (E6) and embryonic day 10 (E10), and the gonads, brains, and leg muscles were excised. For female-reversed chicken, a portion of eggs incubated with E3 were injected with 0.1 mL of 10 mg/mL Aromatase inhibitors (AI) and incubated until E10 as mentioned by Cheng et al. [Citation16]. Embryos were sexed by PCR using the primers for the CHD1 gene: 5’-GTTACTGATTCGTCTACGAGA-3’ and 5’-ATTGAAATGATCCAGTGCTTG-3.’ After sexing, more than 15 pairs of gonads were pooled for each replicate (3 replicates were collected for each tissue). All animal experiment procedures were conducted following the Scientific Ethics Committee of Huazhong Agricultural University (Wuhan, China).
DNA isolation and WGBS sequencing
Genomic DNA was extracted using a DNA extraction kit (TIANGEN, Beijing, China), according to the manufacturer’s protocol. After evaluating quality, the genomic DNA was fragmented to 200–300 bp, followed by terminal repair and A ligation. Different cytosine-methylated barcodes were ligated to sonicated DNA for different samples. DNA bisulphite conversion was performed using the EZ DNA Methylation Gold Kit (Zymo Research, Irvine, CA, USA), and amplification was performed to obtain the libraries. After quantification, libraries were sequenced on an Illumina HiSeq 2500 sequencer. Library construction and sequencing were completed by BGI (Shenzhen, China).
Methylcytosine identification and analysis of differentially methylated regions
Raw reads were processed using FastQC and Trim Galore to generate sequence quality reports and to trim or filter low-quality bases and adapter sequences, respectively. The cleaned data for each sample were merged and aligned to the reference genome (GRCg6a) using bowtie2 in the Bismark software with the following parameters: score_min L, 0, −0.2, -X 700. Aligned reads were deduplicated, non-bisulphite-converted reads were filtered using filter_non_conversion (with the – percentage_cutoff 20 option), and methylcytosine information was extracted using Bismark_methylation_extractor.
Differential methylation regions (DMRs) were analysed by DSS with the following parameters [Citation17]: smoothing, smoothing distance of 200 bp, p.threshold of 1e−05, minimum length of DMR identification of 50 bp, minimum number of loci of 3 bp, and merge distance of 100 bp. Genes in which DMR overlapped with the gene body region (from transcription start sites (TSS) to transcription end sites (TES)) or the promoter region (2 kb upstream of the gene TSS) were defined as differentially methylated genes (DMGs). GO functional annotation enrichment and KEGG pathway enrichment were performed on the DMGs to study their biological functions and regulatory pathways.
RNA isolation, RNA-seq data and differential analysis
The dissected gonads from E6 and E10 embryos were pooled according to sex. Approximately 15 gonads of females or males were used for each group, each including 3 replicates. Total RNA was extracted from the tissues using TRIzol reagent (Invitrogen, Carlsbad, CA, USA) according to the manufacturer’s protocol. The quantity and purity of the RNA were measured using a NanoDrop 8000 spectrophotometer (NanoDrop Technologies, Wilmington, DE, USA). Approximately 2 μg of total RNA per sample was reverse-transcribed to create cDNA, followed by paired-end sequencing on the Illumina Hiseq 2500 platform. Transcriptome data of E10 chicken embryonic gonads were sequenced using Personalbio (Personalbio, Shanghai, China). The E6 transcriptome data were obtained from the GEO database (Bioproject PRJNA171809).
Raw data were processed by adapter trimming, read alignment, and read counting. Using HISAT2, the clean reads were mapped to the chicken reference genome GRCg6a. The HtSeq count was used to calculate the reads mapped to known genes. Differentially expressed RNAs between the groups were identified using the DESeq package. Differential expression with P value < 0.05, and |log2 (fold-change) |>1 were used as the criteria of significance.
The correlation of DNA methylation and gene expression in samples
To explore whether gene expression levels were influenced by DNA methylation, Spearman’s correlation analysis was performed to discern the statistical relationships between DNA methylation levels and gene expression. A positive correlation is indicated by rho > 0, whereas rho < 0 indicates a negative correlation.
Bisulfite sequencing PCR (BSP) analysis
The DNA samples were treated with bisulphite (EZ DNA Methylation Gold Kit, Zymo Research), and Takara EpiTaq HS (for bisulphite-treated DNA) was used for PCR amplification of gene promoter fragments. Primer sequences used are listed in Table S1. The PCR products were subjected to agarose gel electrophoresis and recovered after identification. The amplified fragments were cloned into the pMD19 T-Vector (Takara) and sequenced by the Wuhan Qingke Biological Company. Sequencing results were analysed using the QUMA software with the following parameters:10 alignment mismatches, 90% identity, and 95% converted CpHs.
RT-qPCR analysis
The gonadal RNA template was reverse transcribed into cDNA using the PrimeScript™ RT Kit (TaKaRa, Dalian, China). RT-qPCR was carried out using SuperReal PreMix Plus (Tiangen, Beijing, China) in Bio-RAD CFX384 Real-Time Detection system. Samples were normalized to GAPDH using the comparative CT method (ΔΔCT). All primer sequences are listed in Table S2. These transcripts, ENSGALT00000100225.1 from ENSGALG00000051419, ENSGALT00000104340.1 from ENSGALG00000050012, and ENSGALT00000088960.2 from ENSGALG00000045887, were used to design primers to measure their expression levels.
Fluorescence in situ hybridization (FISH) for RNA spatial positioning analysis
Specific probes for the target RNA were designed by Spatial FISH Ltd (Shenzhen, China). Gonadal samples of E10 embryos were fixed with 4% paraformaldehyde and then covered with a reaction chamber to perform the following reactions: After dehydration and denaturation of the samples with methanol, the hybridization buffer with specific targeting probes was added to the chamber and incubated at 37°C overnight. The samples were then washed three times with PBST, followed by ligation of the target probes in the ligation mix at 25°C for 3 h. Next, the samples were washed three times with PBST and subjected to rolling circle amplification using Phi29 DNA polymerase at 30°C overnight. Subsequently, fluorescent detection probes in hybridization buffer were applied to the samples. Finally, the samples were dehydrated using an ethanol series and mounted with mounting medium. After capturing the images, the signal dots were decoded to interpret RNA spatial position information. Information on the specific targeting probes is provided in Table S3. These transcripts, ENSGALT00000100225.1 from ENSGALG00000051419, and ENSGALT00000104340.1 from ENSGALG00000050012 were used to design probes to detect their expression locations in the gonads.
Cell culture
The DF-1 cell line of chicken embryonic fibroblasts (ATCC, Manassas, VA, USA) was cultured in Dulbecco’s Modified Eagle’s Medium (DMEM) (Gibco) supplemented with 10% foetal bovine serum (FBS; Gibco) and 1% penicillin-streptomycin solution (Invitrogen), followed by incubation at 37°C in 5% CO2 for the following experiments.
Gonadal cells were prepared from chicken embryos at the age of E18.5. Gonadal pieces were digested with 0.25% (w/v) trypsin–0.02% (w/v) ethylenediamine tetraacetic acid (EDTA) at 37°C for 10 min, followed by centrifugation to remove the trypsin and addition of 1 mg·mL−1 collagenase (Type I; Sigma) for digestion at 37°C for 20 min. After filtering through a 70-μm mesh and centrifuging to remove collagenase, the cells were resuspended in 4 mL DMEM containing 10% (v/v) FBS. After counting with a Counting Star cell counter, gonadal cells were spread on dishes to be cultured in DMEM medium containing 10% (v/v) FBS, and incubated at 37°C in 5% CO2 for the following experiments.
Demethylation
Concentration of 0 μM, 0.1 μM, 0.2 μM, 0.4 μM, 0.8 μM and 1.6 μM of 5-Aza-CdR (Abcam, Shanghai, China) were added when the DF-1 cells were plated in 6-well plates. After an additional 24 h of incubation, the treated cells were harvested for RNA extraction and RT-qPCR, as described above.
Dual-luciferase reporter system to detect the promoter activity
The genomic sequences upstream and downstream of the TSS of ENSGALG00000050012 and ENSGALG00000051419 were amplified, and the primers used are shown in Table S4. The restriction enzymes of KpnI and XhoI were used to double-digest the pGL3-Basic vector, and the recovered DNA fragment was subjected to homologous recombination with the double-digested pGL3-Basic vector using the ClonExpress II One Step Cloning Kit (Vazyme, Nanjing, China). The recombinant vector was transfected into DF-1 or chicken gonadal cells using jet PRIME (Polyplus-transfection, New York, USA), and the activity of the promoter was detected in triplicate using the dual-luciferase reporter system (Promega, Beijing, China) according to the manufacturer’s instructions. The ratio of firefly luciferase to Renilla luciferase was calculated as the relative fluorescence activity of the promoter.
Result
Genome-wide DNA methylation analysis of chicken embryonic gonads between sexes
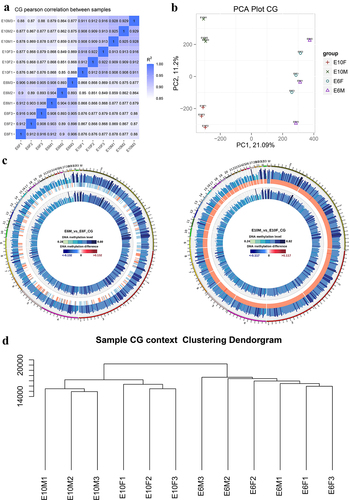
A total of 1.85 × 10⁹ reads with a sequencing depth of 20.9 × were obtained, and 75.03% were mapped to the reference genome. The sequencing depth and cumulative distribution of the effective sequencing depth by the C base proved the uniformity and high quality of the WGBS sequencing data (). The efficiency of bisulphite treatment was > 99% after detection using lambda DNA. Methylation profiles between pairs of samples were compared at the global CpG level. As expected, the correlations between samples were high (r > 0.9) within the same sex and relatively low (r < 0.87) between sexes (). Combined with the results of the cluster analysis and principal component analysis, it was shown that DNA methylation patterns between males and females were slight differences at the E6 stage, but with large differences at E10 (). For each chromosome, there was a little difference in methylation levels between males and females at E6, whereas at E10, the global methylation level of male samples was obviously higher than that of females on all chromosomes ().
Figure 1. DNA methylome characteristics of chicken embryonic gonads: (a) CG methylation level Pearson correlation analysis. The varying shades of color represent the degree of correlation; (b) Principal component analysis (PCA) of DNA methylation at the genome-wide level; (c) genome-wide differences in methylation levels between sexes at E6 (left panel) and E10 (right panel). From outside to inside are male methylation level, difference in methylation level between males and females, and female methylation level, respectively; color grading indicates the methylation level; (d) dendrogram clustering of CG methylation levels in each sample. The closer distance, the higher similarity among them.
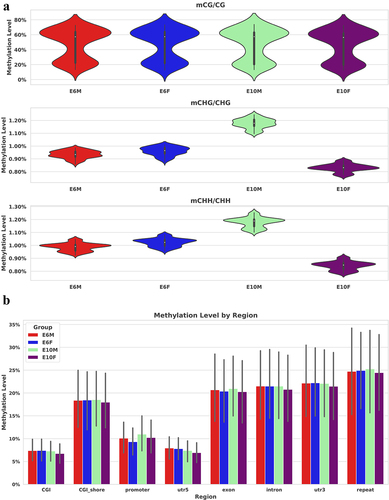
CG, CHG, and CHH are symbols used to describe the methylation status of DNA, where H represents any nucleotide other than G. The cytosine methylation levels in chicken embryonic gonads indicate that the methylation levels at CG sites are concentrated at 60% and 20%, while the methylation levels at CHG and CHH sites are around 1%. In E10 males, the methylation level of CHG and CHH is higher compared to females (). The methylation level of different functional elements has similar trends in females and males, the higher level with about 50–60% was in exons, introns, 3’UTR and CGI shore, and promoter region was 29% on average. There were no significant differences observed among the samples within each group (p > 0.05) ().
Figure 2. Distribution of DNA methylation levels in chicken embryonic gonads: (a) the violin plot displays the DNA methylation levels of CG, CHG, and CHH contexts in males and females at E6 and E10, where H represents any nucleotide other than G; (b) the bar chart illustrates the methylation levels of functional elements, with the gray bars representing T-test error bars. There were no significant differences observed among the samples within each group. CGI (CpG island) refers to DNA regions that have a high density of CG sites and are typically longer (> 200 bp) than surrounding regions. CGI shore represents the regions adjacent to CGIs, generally defined as a DNA region within 1000 bp of the CGI itself.
Functional analysis of differentially methylated genes
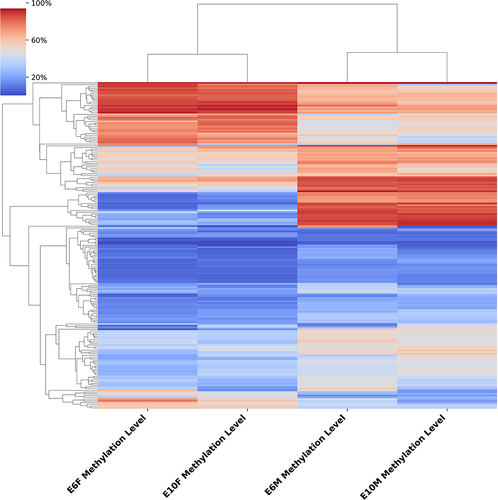
DMRs in chicken embryonic gonads between the two sexes at the two stages were identified and annotated. At E6, 962 DMRs (884 CG-DMR, 71 CHH-DMRs, and 7 CHG-DMRs) were identified between males and females, of which 35 were located in promoters, 42 in exons, and 463 in introns (Table S5). At E10, 3147 DMRs (1838 CG-DMR, 1233 CHH-DMR, and 76 CHG-DMR) were identified between males and females, of which 229 were located in promoters, 287 in exons, and 1213 in introns (Table S6). At these two stages, DMRs with a difference of more than 30% in methylation levels were mainly distributed on the Z chromosome, with 210 DMRs in E6 and 291 DMRs in E10 (Table S5–6). Comparing the DMRs information of these two stages, we found that 157 DMRs were shared at both E6 and E10, 738 stage-specific DMRs were shared at E6, and 2835 stage-specific DMRs were shared at E10 (Table S7–8). Cluster analysis of the shared DMRs of the two stages showed that DMRs of the same sex at different stages had similar methylation levels ().
Figure 3. Cluster analysis of differentially methylated regions between sexes at E6 and E10. The varying shades of color represent the methylation level.
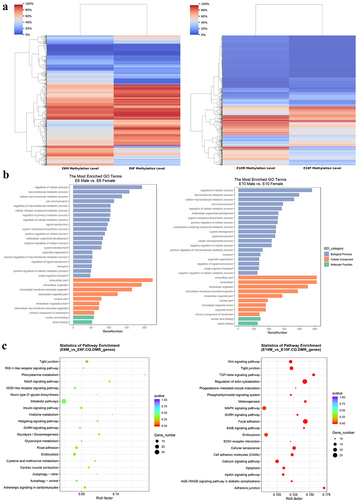
Differentially methylated genes (DMGs) in CG-DMR were annotated using GO annotation and KEGG pathway enrichment analysis. There were 297 stage-specific DMGs at E6 and 660 stage-specific CG-DMGs at E10 (, Table S7–8). The GO results showed that the DMGs between males and females at both stages were enriched in similar biological processes, such as cellular processes, metabolic processes, cell communication, signal transduction, system development, and organelle organization (). The pathway of DMGs at E6 was mainly enriched in metabolic pathway, but MAPK signalling pathway, regulation of actin cytoskeleton, focal adhesion, cellular senescence, tight junction, Wnt signalling pathway and cell adhesion molecules were significantly enriched at E10 ().
Figure 4. Functional enrichment analysis of differentially methylated genes: (a) the cluster heatmap displays the methylation levels of CG-DMRs between sexes at E6 (left panel) and E10 (right panel). The varying shades of color represent the methylation level; (b) GO enrichment analysis of differentially methylated genes between sexes at E6 (left panel) and E10 (right panel); (c) KEGG pathway analysis of differentially methylated genes between sexes at E6 (left panel) and E10 (right panel).
Functional analysis of differentially expressed genes (DEGs)
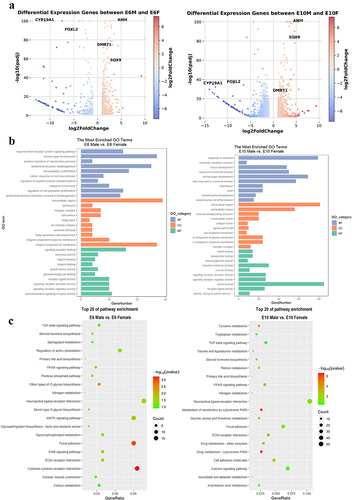
There were 746 DEGs at E6, of which 467 genes were highly expressed in males and 279 genes were highly expressed in females; while there were 1906 DEGs at E10, of which 734 genes were highly expressed in males and 1172 genes were highly expressed in females (padj <0.05, |log2Fold Change| ≥1) (Table S9–10). The well-known sex-biased genes, FOXL2 and CYP19A1 in females, DMRT1, SOX9 and AMH in males, were found in DEGs at both stages (). GO enrichment and KEGG pathway analyses were performed for differentially expressed genes (). The results showed that DEGs between males and females at E6 were mainly enriched in enzyme-linked receptor protein signalling pathways, animal organ development, positive regulation of reproductive processes, anatomical structure morphogenesis, cell population proliferation, and cellular response to hormone stimulus. At E10, besides tissue and organ development, the biological processes of DEGs were mainly involved in xenobiotic metabolic processes, responses to external stimuli, cellular response to chemical stimulus, and mesenchyme development. TGF-beta signalling pathways, neuroactive ligand receptor interaction, focal adhesion and PPAR signalling pathways etc. were enriched at both of two stages. Cytokine-cytokine receptor interaction and regulation of actin cytoskeleton were significantly enriched at E6, while calcium signalling pathways and metabolism of xenobiotics by cytochrome P450 were enriched at E10.
Figure 5. Functional enrichment analysis of differentially expressed genes: (a) the volcano plot displays DEGs between sexes at E6 (left panel) and E10 (right panel), highlighting the major genes involved in sex determination in chickens; (b) GO enrichment analysis of DEGs between sexes at E6 (left panel) and E10 (right panel); (c) KEGG pathway analysis of DEGs between sexes at E6 (left panel) and E10 (right panel).
Combined analysis of differentially methylated and differentially expressed genes
DNA methylation, especially which located in gene promoter regions, generally represses gene transcription. Our analysis suggested that a proportion of gene expression shows a negative correlation with methylation levels in these regions (, ). And there was no linear correlation between gene expression and methylation levels in exonic, intronic, and promoter regions during the E6 and E10 stages (). The Venn diagram revealed that there were 44 and 131 DEGs shared with DMGs at E6 and E10, respectively (). In addition, 4 and 10 shared genes of each stage were in differentially methylated promoters (). Among these genes, the methylation of the promoters of ENSGALG00000051419, ENSGALG00000050012 and ENSGALG00000045887, which were distributed in the previously reported MHM region on Z chromosome, was found to be significantly negatively correlated with their gene expression at both stages.
Figure 6. Combined analysis of differentially methylated genes and differentially expressed genes: (a-c) the scatter plot shows the log2 fold change of gene expression and differential methylation levels between sexes at E6 (left panel) and E10 (right panel) in promoter (a), exon (b), and intron (c); (d) correlation heatmap of between sexes at E6 (top panel) and E10 (bottom panel) in promoter, exon, and intron; (e) the Venn diagram illustrates the intersection and differences between DMGs and DEGs.
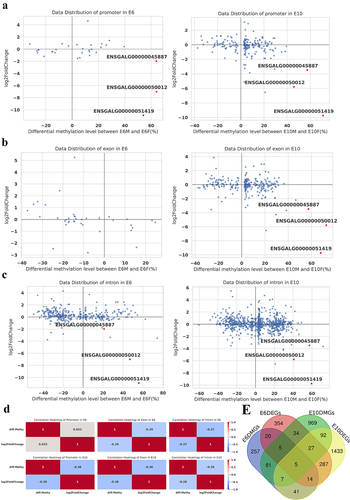
Table 1. Correlation of DNA methylation differences in functional regions with differential mRNA expression.
Table 2. Differentially methylated promoter and differentially expressed genes.
BSP and qRT-PCR verification
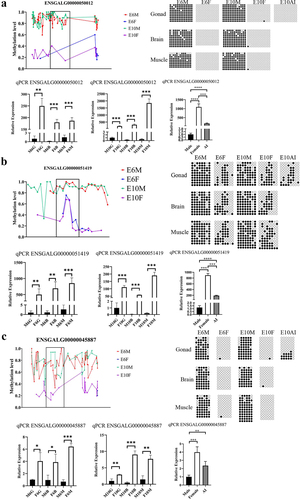
We selected ENSGALG00000050012, ENSGALG00000051419, and another sexually differentially methylated gene, ENSGALG00000045887, for further analysis. To explore whether the sex differences in the methylation and expression levels of the three candidate genes were tissue-specific, gonads, brain, and muscle tissues of chicken embryos at E6 and E10 were subjected to BSP and qRT-PCR. The results showed that the methylation levels of the promoter of the three candidate genes were significantly higher than those of females, and the expression levels of females were significantly higher than those of males (). Additionally, to investigate whether DNA methylation and expression levels of candidate genes are affected by oestrogen levels and sex reversal, gonads of aromatase inhibitor (AI) treated female (ZW) sex-reversed chicken embryos were used to perform BSP and qRT-PCR. The results showed that the methylation of ENSGALG00000051419 and ENSGALG00000050012 in female sex-reversed chicken embryos was consistent with that in females, while the methylation level of the ENSGALG00000045887 gene promoter was increased but still lower than that in males. In female sex-reversed chicken embryo gonads, the expression levels of the three candidate genes were significantly decreased compared to those in females, but the expression levels were still significantly higher than those in males ().
Figure 7. BSP and qRT-PCR of candidate lncRnas. (a), (b), and (c) show the validation results for ENSGALG00000050012, ENSGALG00000051419, and ENSGALG00000045887, respectively. In each figure, the upper left figure shows the WGBS sequencing result, the box is the verification region, the upper right figure is the BSP sequencing result, the black dots indicate the sites where methylation groups occurred, and the white dots indicate non-methylated sites. The lower figure is the result of qRT-PCR. G, B, and M represent the gonads, brain, and muscle, respectively, and AI represents the aromatase inhibitor treatment group. Asterisks above the bars indicate statistically significant differences between samples: *P < 0.05, **P < 0.01, ***P < 0.005, ****P < 0.001.
Differential expression of ENSGALG00000050012 and ENSGALG00000051419 in male and female chicken embryonic gonads
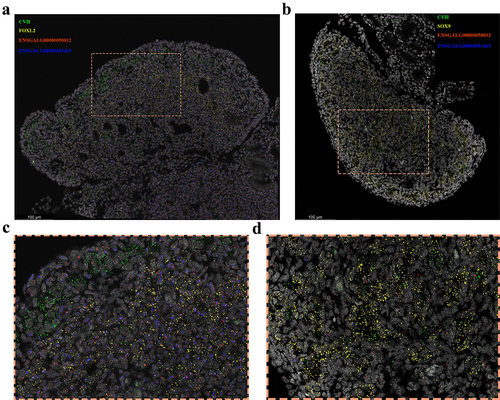
The expression of ENSGALG00000050012 and ENSGALG00000051419 in chicken embryonic gonads at E10 was detected using the gonadal cell markers CVH, SOX9, and FOXL2 by FISH. CVH is expressed in primordial germ cells, FOXL2 is specifically expressed in the ovarian follicle cells of females, and SOX9 is specifically expressed in testicular Sertoli cells of males. The results showed that ENSGALG00000050012 and ENSGALG00000051419 were highly expressed in female embryonic gonads and distributed throughout the gonads, including the location of primordial germ cells and follicle cells (, c, ). However, the expression of ENSGALG00000050012 in male embryonic gonads was lower than that in female embryonic gonads and was scattered throughout the male gonad (). ENSGALG00000051419 was hardly detected in the male embryonic gonads.
Figure 8. FISH reveals the spatial expression of candidate lncRnas. Marker genes and candidate genes are displayed in different colors, with the marker gene CVH for primordial germ cells shown in green, the marker genes FOXL2 for ovarian follicle cells and SOX9 for testicular Sertoli cells depicted in yellow. The candidate genes ENSGALG00000050012 and ENSGALG00000051419 are respectively represented in red and blue. (a) and (b) represent the female gonad and male gonad, respectively. (c) and (d) show enlarged views of the orange-boxed regions in the upper images.
5-aza-CdR treatment of cells affects gene expression
DNA methyltransferase inhibitors 5-Aza-CdR (5-Azacytidine) can inhibit DNA methyltransferases, preventing the process of DNA methylation on molecules. This leads to a reduction in the methylation levels of certain gene promoter regions, which may facilitate the expression of these genes. DF-1 cells were treated with different concentration of 5-Aza-CdR for 24 h and the expression levels of candidate genes were determined. The results showed that the expression of ENSGALG00000051419 and ENSGALG-00000050012 were significantly increased after low doses of 5-Aza-CdR treatment (0.1–0.2 μM), and the expression was decreased with increasing concentration (). ENSGALG00000045887 expression was significantly elevated by treatment with different concentration of 5-Aza-CdR (). These results indicate that demethylation affects the expression levels of these candidate genes.
Figure 9. Validation of candidate gene expression after 5-Aza-CdR treatment in DF-1 cells by qPCR. (a): ENSGALG00000050012; (b): ENSGALG00000051419; (c): ENSGALG00000045887. Different letters of a, b and c above the bars indicate a statistically significant difference (p < 0.05) among different groups, while the same letters indicate that the difference is not statistically significant (p > 0.05).
Promoter activity analysis and transcription factor prediction of candidate genes
The promoters of ENSGALG00000050012 and ENSGALG00000051419 were truncated into several fragments and cloned into the pGL3-Basic vector to construct recombinant vectors for the transfection of DF-1 cells and gonadal cells. The results of the dual-luciferase reporter assay showed that the fluorescence activity of P1-P5 (−608/+1108) in ENSGALG00000050012 was significantly increased, of which P5 (−608/+246) had the highest value, and the activity of P6 (−940/+246) and P7 (−1244/+246) decreased significantly compared to P5. This indicates that the transcription factor-binding site between −306 and + 246 plays an important role in regulating the transcriptional activation of the ENSGALG00000050012 gene, and there may be some enhancers between −608 and −306 or repressors between −940 and −608 to enhance or inhibit the transcriptional expression of the gene. The binding sites of transcription factors that might be affected by DNA methylation, such as YY1, NRF1, and ZEB1, in the fragment of −306 to + 246, were predicted using JASPAR ().
Figure 10. Fluorescence activity analysis of truncated promoter and prediction of transcription factor binding sites. (a) ENSGALG00000050012, (b) ENSGALG00000051419, the top panel and bottom panel were fluorescence activity in promoter and predicted transcription factor binding sites in the promoter, respectively.
The promoter truncation assay of ENSGALG00000051419 showed that the fluorescence activity of P1-P2 (−113/+2602, −113/+2202), P5-P8 (−113/+1082, −113/+682, −113/+284, −515/+284) increased significantly, while the activities of P3 (−113/+1882) and P4 (−113/+1482) decreased significantly compared with P5. This indicates that the transcription factor binding site between −113 and + 284 plays an important role in regulating the transcriptional activation of the gene, and there may be repressors between + 1082 and + 1482 and enhancers between + 1882 and + 2202. Transcription factor-binding sites on CpG sites of some important genes, such as Lhx8, E2F1, SNAI1, and Foxn1, were predicted ().
Discussion
DNA methylation, the most intensively studied epigenetic modification, plays an essential role in the transcriptional regulation of genes and many biological processes. Currently, there are few studies on genome-wide DNA methylation in chicken. This study is the first to construct a whole genomic DNA methylation map in chicken embryonic gonads and found that the overall DNA methylation levels between sexes vary with developmental stage, which provides a basis for understanding epigenetic regulation in chicken gonad differentiation.
Comparing the DNA methylation status of the male and female gonads of chicken embryos at two stages of E6 and E10, we found that the genome-wide methylation patterns between males and females at E10 were relatively more different than that at E6, and the methylation level of male gonads was higher than that of female gonads in the whole genome, suggesting that DNA methylation is involved in the regulation of chicken gonadal sex differentiation. During the process of gonad differentiation in chickens, the morphologies of male and female gonads are distinguishable at E6.5 and undergo significant changes from the process of E6.5 to E10.5; the medullary cords become thicker in male gonads, asymmetric development occurs in female gonads, and transcription of cell lineages in the gonads begins to diverge [Citation18,Citation19]. Overall, our findings on sexual differences in DNA methylation were consistent with chicken gonadal development. With the development of sexual differentiation, the difference in methylation levels between males and females increases and male genomes tend to be relatively hypermethylated. Additionally, biological function analysis of DMGs between the two stages also revealed that DNA methylation is involved in the regulation of more genes and developmental pathways at E10. The difference in DNA methylation dynamics between sexes may be in the regulation of genes related to sexual differentiation, and especially have an important impact on those related to right gonad regression in females.
The role of DNA methylation in animal sex determination has been of great interest, but there have been few studies on birds. In the comparison study of sex methylation differences between chickens and white-throated sparrows which based on the WGBS data of brain, retina, lung and muscle, authors found that DNA methylation in two regions of the avian Z chromosome was highly differentiated between males and females, which were named MHM1 and MHM2, respectively [Citation15]. The methylation status of the MHM1 region (previously referred to as ‘MHM’) was established on embryonic day 1, and MHM1 was transcribed into non-coding RNA only in females and accumulated at transcription sites adjacent to the DMRT1 locus in the nucleus [Citation13]. MHM1 and MHM2 share several similarities: (1) both MHMs show higher chromatin accessibility in females than in males; (2) lncRNAs transcribed by both MHMs are highly expressed in female tissues such as muscle, brain, kidney, heart, and lung; and (3) the expression of MHM-adjacent genes is higher in females than in males [Citation15]. In this study, DMRs with a difference of more than 30% in methylation levels between males and females were mainly distributed on chromosomes Z, 1, and 2. Most of the DMRs on the Z chromosome were hypermethylated in males, and there were two Z chromosome regions in E6 and E10, with extremely significant differential methylation between males and females, located at Z:27.14Mb-27.39Mb and Z:73.372Mb-73.376Mb, respectively. The former corresponds to MHM1 and the latter corresponds to MHM2, which is consistent with the results reported by Sun et al. [Citation15]; however, the MHM2 sequence identified in this study is longer than the previously identified region.
The methylation of CGIs in promoter regions is thought to inhibit the initiation of gene transcription. By combining WGBS and transcriptome data of chicken embryonic gonads, this study found that the promoter regions of three differentially expressed lncRNAs were located on MHM1 and MHM2, that is, ENSGALG00000051419 and ENSGALG00000050012 were located on MHM1, and ENSGALG00000045887 was located on MHM2, and the expression levels of these lncRNAs in females were much higher than those in males at both E6 and E10. The female-biased expression of ENSGALG00000050012 and ENSGALG00000051419 has also been verified in E10 gonads using FISH, particularly in the location of primordial germ cells and follicle cells. This difference existed in chicken gonads, brain, and muscle tissue, suggesting that these genes may be regulated by methylation levels in the MHM region, and this regulatory relationship is not tissue-specific, which is consistent with previous findings that genes near MHM are highly expressed in females [Citation15]. In previous studies, the non-coding sequence containing a 2.2 kb repeat unit in the MHM region was first identified by slot-blot hybridization [Citation13], and several splice variants of the MHM sequences were obtained by northern blot analysis [Citation20]. The DE lncRNAs identified in this study are members of these MHM splice variants. The exogenous transduction of MHM into the testes of 13-week-old roosters and chicken embryos resulted in some changes, including the downregulation of DMRT1 and upregulation of ERα in males and altered asymmetric ovarian development in females, indicating that MHM plays a role in chicken gonadal sex differentiation [Citation20,Citation21]. Although the specific higher expression of three non-coding RNAs in females, their complex transcription and unknown function in chicken sex determination and gonadal development requires further investigation.
We then explored the expression of candidate genes related to DNA methylation and hormone regulation. In our previous study, gonadal morphology and marker gene expression of AI-treated female gonads were similar to those of normal testes [Citation16]. In the gonads of the AI sex-reversed female chickens, the methylation levels of two regions of MHM1 were found to be consistent with those in females, and the expression levels of lncRNAs were significantly decreased compared with those in females, but still much higher than those in males. The methylation level of the promoter of another gene in MHM2, ENSGALG00000045887, was increased in sex-reversed female chicken embryo gonads, but its DNA methylation level was still lower than that in males. DNA methylation in individuals of different sexes has been widely analysed, especially in fish species. In the large yellow croaker, sex-reversed males have methylation patterns closer to those of males than females [Citation22]. The methylome data of a flatfish, Chinese tongue sole (Cynoglossus semilaevis), revealed that the DNA methylation level in males and pseudomales was higher than that in females [Citation23]. In Oestrogen-feminized male chicken gonads, although DNA methylation of FemZZs could be distinguished from that of normal ZZ and ZW gonads, the combination data of expression profiles of Z-linked genes, autosomal repetitive sequences, and DNA methylomes demonstrated that both somatic and germline cell populations in morphologically feminized chickens maintain significant transcriptomic and epigenetic memories of genetic sex as well as CASI [Citation24]. Our results are consistent with those of oestrogen-feminized male chickens, indicating that unlike lower vertebrates such as fish, the genomic DNA methylation pattern in chickens may not be easily affected by sex hormones. In addition, we treated DF-1 cells with the methyltransferase inhibitor 5-Aza-CdR, and showed that the expression level of candidate lncRNAs was significantly increased after the methylation level was decreased. It is speculated that methylation is removed from some sites, and the efficiency of transcription is improved, which proves that the candidate lncRNA is regulated by DNA methylation. In conclusion, the chicken MHM region has extremely significant methylation differences between males and females in all tissues detected in this study and is not affected by sex hormones, and the genes near this region are both regulated by DNA methylation and sex hormones. Therefore, we speculate that the MHM region may be involved in cell-autonomous sex identity in chickens, and these lncRNAs regulated by MHM may be expressed in a sex-dimorphic manner in all cells and tissues at all developmental stages. Further studies may use CRISPR-dCas9 to demethylate MHM and verify the methylation regulation of the MHM site.
DNA methylation can inhibit gene expression by weakening the binding of transcription factors to promoter regions and may also inhibit transcription by binding to proteins with inhibitory transcriptional activity [Citation25]. To explore whether the upstream regulator of lncRNAs regulates their expression through DNA methylation of the promoter, we constructed truncated vectors of the promoter of genes and performed dual fluorescent reporter assays. Within the promoter regions of two lncRNAs, ENSGALG00000050012 and ENSGALG00000051419, which are located in MHM1, some transcription factor-binding sites affected by DNA methylation were predicted using JASPAR software. We found some of transcription factors play roles in sex differentiation and female reproduction, such as YY1 [Citation26], NRF1 [Citation27], ZEB1 [Citation28], Lhx8 [Citation29], and E2F1 [Citation30,Citation31]. We speculate that the predicted transcription factors in chicken female gonads may regulate female gonad development by binding to the promoter region of lncRNA on the MHM to regulate its transcription, while the hypermethylated status in males inhibits their expression.
Based on the results of genome-wide DNA methylation analysis of chicken embryonic gonads, we found that DNA methylation dynamics differ between the sexes and may play an important role in the regulation of sexual differentiation-related genes in females. Interestingly, lncRNA expression and DNA methylation status within the MHM region may be involved in the process of cell-autonomous sex identity in chickens.
Data availability of statement
WGBS datasets for chicken gonad samples were deposited in the Sequence Read Archive (SRA) under accession number PRJNA951352.
Supplemental Material
Download Zip (4.7 MB)figures_of_S1_S3.docx
Download MS Word (3.9 MB)Disclosure statement
The authors declare that the research was conducted in the absence of any commercial or financial relationships that could be construed as potential conflicts of interest.
Supplementary material
Supplemental data for this article can be accessed online at https://doi.org/10.1080/15592294.2023.2283657
Correction Statement
This article has been republished with minor changes. These changes do not impact the academic content of the article.
Additional information
Funding
References
- Chue J, Smith CA. Sex determination and sexual differentiation in the avian model. FEBS J. 2011;278(7):1027–20. doi: 10.1111/j.1742-4658.2011.08032.x
- Nanda I, Shan Z, Schartl M, et al. 300 million years of conserved synteny between chicken Z and human chromosome 9. Nat Genet. 1999;21(3):258–259. doi: 10.1038/6769
- Smith CA, Roeszler KN, Ohnesorg T, et al. The avian Z-linked gene DMRT1 is required for male sex determination in the chicken. Nature. 2009;461(7261):267–271. doi: 10.1038/nature08298
- Lambeth LS, Raymond CS, Roeszler KN, et al. Over-expression of DMRT1 induces the male pathway in embryonic chicken gonads. Dev Biol. 2014;389(2):160–172. doi: 10.1016/j.ydbio.2014.02.012
- Ioannidis J, Taylor G, Zhao D, et al. Primary sex determination in birds depends on DMRT1 dosage, but gonadal sex does not determine adult secondary sex characteristics. Proc Natl Acad Sci U S A. 2021;118(10): doi: 10.1073/pnas.2020909118
- Zhao D, McBride D, Nandi S, et al. Somatic sex identity is cell autonomous in the chicken. Nature. 2010;464(7286):237–242. doi: 10.1038/nature08852
- Clinton M, Zhao D, Nandi S, et al. Evidence for avian cell autonomous sex identity (CASI) and implications for the sex-determination process? Chromosome Res. 2012;20(1):177–190. doi: 10.1007/s10577-011-9257-9
- Guioli S, Zhao D, Nandi S, et al. Oestrogen in the chick embryo can induce chromosomally male ZZ left gonad epithelial cells to form an ovarian cortex that can support oogenesis. Development. 2020;147(4). doi: 10.1242/dev.181693
- Navarro-Martín L, Viñas J, Ribas L, et al. DNA methylation of the gonadal aromatase (cyp19a) promoter is involved in temperature-dependent sex ratio shifts in the European sea bass. PLoS Genet. 2011;7(12):e1002447. doi: 10.1371/journal.pgen.1002447
- Parrott BB, Kohno S, Cloy-McCoy JA, et al. Differential incubation temperatures result in dimorphic DNA methylation patterning of the SOX9 and aromatase promoters in gonads of alligator (Alligator mississippiensis) embryos. Biol Reprod. 2014;90(1):2. doi: 10.1095/biolreprod.113.111468
- Nishino K, Hattori N, Tanaka S, et al. DNA methylation-mediated control of sry gene expression in mouse gonadal development. J Biol Chem. 2004;279(21):22306–22313. doi: 10.1074/jbc.M309513200
- Melamed E, Arnold AP. The role of LINEs and CpG islands in dosage compensation on the chicken Z chromosome. Chromosome Res. 2009;17(6):727–736. doi: 10.1007/s10577-009-9068-4
- Teranishi M, Shimada Y, Hori T, et al. Transcripts of the MHM region on the chicken Z chromosome accumulate as non-coding RNA in the nucleus of female cells adjacent to the DMRT1 locus. Chromosome Res. 2001;9(2):147–165. doi: 10.1023/a:1009235120741
- Melamed E, Arnold AP. Regional differences in dosage compensation on the chicken Z chromosome. Genome Biol. 2007;8(9):R202. doi: 10.1186/gb-2007-8-9-r202
- Sun D, Maney DL, Layman TS, et al. Regional epigenetic differentiation of the Z chromosome between sexes in a female heterogametic system. Genome Res. 2019;29(10):1673–1684. doi: 10.1101/gr.248641.119
- Cheng Y, Zhang Z, Zhang G, et al. The male-biased expression of miR-2954 is involved in the male pathway of chicken sex differentiation. Cells. 2022;12(1):4. doi: 10.3390/cells12010004
- Feng H, Conneely KN, Wu H. A bayesian hierarchical model to detect differentially methylated loci from single nucleotide resolution sequencing data. Nucleic Acids Res. 2014;42(8):e69. doi: 10.1093/nar/gku154
- Estermann MA, Williams S, Hirst CE, et al. Insights into gonadal sex differentiation provided by single-cell transcriptomics in the chicken embryo. Cell Rep. 2020;31(1):107491. doi: 10.1016/j.celrep.2020.03.055
- Smith CA, Sinclair AH. Sex determination: insights from the chicken. BioEssays. 2004;26(2):120–132. doi: 10.1002/bies.10400
- Roeszler KN, Itman C, Sinclair AH, et al. The long non-coding RNA, MHM, plays a role in chicken embryonic development, including gonadogenesis. Dev Biol. 2012;366(2):317–326. doi: 10.1016/j.ydbio.2012.03.025
- Yang X, Zheng J, Xu G, et al. Exogenous cMHM regulates the expression of DMRT1 and ERα in avian testes. Mol Biol Rep. 2010;37(4):1841–1847. doi: 10.1007/s11033-009-9619-y
- He A, Li W, Wang W, et al. Analysis of DNA methylation differences in gonads of the large yellow croaker. Gene. 2020;749:144754. doi: 10.1016/j.gene.2020.144754
- Wang N, Yang Q, Wang J, et al. Integration of transcriptome and methylome highlights the roles of cell cycle and hippo signaling pathway in flatfish sexual size dimorphism. Front Cell Dev Biol. 2021;9:743722. doi: 10.3389/fcell.2021.743722
- Shioda K, Odajima J, Kobayashi M, et al. Transcriptomic and epigenetic preservation of genetic sex identity in estrogen-feminized male chicken embryonic gonads. Endocrinology. 2021;162(1). doi: 10.1210/endocr/bqaa208
- Moore LD, Le T, Fan G. DNA methylation and its basic function. Neuropsychopharmacology. 2013;38(1):23–38. doi: 10.1038/npp.2012.112
- Bunker CA, Kingston RE. Transcriptional repression by Drosophila and mammalian polycomb group proteins in transfected mammalian cells. Mol Cell Biol. 1994;14(3):1721–1732. doi: 10.1128/mcb.14.3.1721-1732.1994
- Zhang G, Wan Y, Zhang Y, et al. Expression of mitochondria-associated genes (PPARGC1A, NRF-1, BCL-2 and BAX) in follicular development and atresia of goat ovaries. Reproduct Domestic Animals. 2015;50(3):465–473. doi: 10.1111/rda.12514
- Lim W, Song G, White-Cooper H. Identification of novel regulatory genes in development of the avian reproductive tracts. PLoS One. 2014;9(4):e96175. doi: 10.1371/journal.pone.0096175
- Shin YH, Ren Y, Suzuki H, et al. Transcription factors SOHLH1 and SOHLH2 coordinate oocyte differentiation without affecting meiosis I. J Clin Invest. 2017;127(6):2106–2117. doi: 10.1172/jci90281
- Douville G, Sirard MA. Changes in granulosa cells gene expression associated with growth, plateau and atretic phases in medium bovine follicles. J Ovarian Res. 2014;7(1):50. doi: 10.1186/1757-2215-7-50
- Morrell BC, Perego MC, Maylem ERS, et al. Regulation of the transcription factor E2F1 mRNA in ovarian granulosa cells of cattle. J Anim Sci. 2020;98(1). doi: 10.1093/jas/skz376