
ABSTRACT
Altered epigenetic mechanisms have been previously reported in growth restricted offspring whose mothers experienced environmental insults during pregnancy in both human and rodent studies. We previously reported changes in the expression of the DNA methyltransferase Dnmt3a and the imprinted genes Cdkn1c (Cyclin-dependent kinase inhibitor 1C) and Kcnq1 (Potassium voltage-gated channel subfamily Q member 1) in the kidney tissue of growth restricted rats whose mothers had uteroplacental insufficiency induced on day 18 of gestation, at both embryonic day 20 (E20) and postnatal day 1 (PN1). To determine the mechanisms responsible for changes in the expression of these imprinted genes, we investigated DNA methylation of KvDMR1, an imprinting control region (ICR) that includes the promoter of the antisense long non-coding RNA Kcnq1ot1 (Kcnq1 opposite strand/antisense transcript 1). Kcnq1ot1 expression decreased by 51% in growth restricted offspring compared to sham at PN1. Interestingly, there was a negative correlation between Kcnq1ot1 and Kcnq1 in the E20 growth restricted group (Spearman’s ρ = 0.014). No correlation was observed between Kcnq1ot1 and Cdkn1c expression in either group at any time point. Additionally, there was a 11.25% decrease in the methylation level at one CpG site within KvDMR1 ICR. This study, together with others in the literature, supports that long non-coding RNAs may mediate changes seen in tissues of growth restricted offspring.
Introduction
Development is susceptible to environmental insults, such as uteroplacental insufficiency, maternal suboptimal diets, and other environmental exposures to chemicals, infections, drugs, and alcohol [Citation1–7]. Developmental environmental exposure early in life has been shown to be associated with epigenetic changes, including changes in DNA methylation, histone modifications, long non-coding RNA (lncRNA), and micro-RNA (miRNA) expression, in both human and rodent studies, which can have a significant impact on short- and long-term offspring health [Citation1,Citation4–6,Citation8–10]. Additionally, altered epigenetic mechanisms and physiology due to environmental exposure during gametogenesis/gestation have been reported to have multigenerational or transgenerational effects that occur in a sex-specific manner in rodent studies [Citation4–7,Citation9–17]. These animal models have been suggested to be more appropriate for transgenerational studies, as besides the availability of tissues for sampling, inbred strains and strictly controlled experimental environments can help reduce biases found in human studies, such as genetic, ecological, and cultural factors [Citation18].
We have recently shown in our rodent model of uteroplacental insufficiency (UPI) that the expression of Dnmt3a, a de novo DNA methyltransferase, but not Dnmt1, whose primary role is maintaining the DNA methylation landscape, was decreased in the kidney of embryonic day 20 (E20) offspring, which is during the embryonic nephron formation period [Citation12]. Concurrently, expression of imprinted genes that are known to be important in kidney development, Cdkn1c and Kcnq1, was also altered at both E20 (Cdkn1c; sex-specific) and postnatal day 1 (PN1; Cdkn1c and Kcnq1) [Citation12]. Specifically, at E20, Cdkn1c expression was only reduced in growth restricted females. At PN1, regardless of sex, Cdkn1c expression was lower and Kcnq1 expression was higher in growth restricted offspring, in association with reduced absolute and percentage left kidney weight [Citation12]. Interestingly, Kcnq1 and Cdkn1c are both known to be regulated by KvDMR1, an imprinting control region (ICR), which includes the promoter of the imprinted antisense lncRNA Kcnq1ot1 [Citation19,Citation20]. These results raised a question of whether epigenetic mechanisms, such as DNA methylation or lncRNAs, can explain the multigenerational and sex-specific alterations in both gene expression and growth phenotypes in the kidneys of growth restricted offspring.
In the current study, we investigated the relationship between Kcnq1 and Cdkn1c with Kcnq1ot1 and KvDMR1 by examining the expression of Kcnq1ot1 and the DNA methylation status of two CpG islands within the KvDMR1 ICR in the kidneys of F1 growth restricted offspring. The study will contribute to the understanding of the potential mechanisms controlling the gene expression of imprinted genes in the kidney that might be susceptible to adverse in utero environments.
Materials and methods
Kidney tissue collection
The intrauterine growth restricted (IUGR) Wistar Kyoto rat model was generated as previously described (The University of Melbourne AEC 04138, 1011865, and 1112130; La Trobe University AEC 12–42) [Citation12,Citation21,Citation22]. In short, pregnant female rats (F0) underwent bilateral uterine vessel (artery and vein) ligation at day 18 of pregnancy (late gestation; term = 22 days) to induce UPI. The control group underwent sham surgery (no vessel ligation). Left kidney samples were collected at embryonic day 20 (E20) and post-natal day 1 (PN1) from the first-generation rat offspring, with one male and one female examined per litter [Citation12]. Samples were snap frozen in liquid nitrogen and stored at −80°C.
RNA and DNA extraction
RNA was extracted from samples as described previously [Citation12]. For DNA extraction, 30 mg of left kidney tissue was quickly cut on a plastic weight boat on ice. Only PN1 tissues were available for DNA extraction as the whole E20 kidney was used in RNA extraction [Citation12]. Tissue homogenization was carried out in 500 µL of TES (10 mM Tris (pH 8.0), 1 mM EDTA, 0.1 M NaCl; Invitrogen) with the following PowerLyser settings: time ‘T’ = 15 s, cycles ‘C’ = 1, dwell/pause time ‘D’ = 0 s, and speed ‘S’ = 3,500 rpm. DNA was then extracted using the salting out method [Citation23] with modifications. Thirty microlitres of 20 µg/µL Proteinase K (Invitrogen) was added to each tube of homogenized tissue (mixed by inversion), followed by 60 µL of 20% SDS (Invitrogen) (mixed by inversion). The samples were then incubated at 37°C for 24 h. After incubation, 300 µL of 3 M NaCl was added to each tube and mixed vigorously by shaking for at least 10 s. Tubes were placed on ice for 10 min, followed by centrifugation at 13,000 rpm for 15 min, and a maximum of 450 µL of the supernatant was collected. Two microlitres of glycogen (Invitrogen) was added to each tube, followed by 900 µL of 100% molecular biology grade ethanol (Sigma-Aldrich) (mixed by inversion). The DNA was pelleted by centrifugation at 13,000 rpm for 2 min. The DNA pellet was washed with 900 µL 70% ethanol (mixed by inversion) and centrifuged at 13,000 rpm for 1 min. The supernatant was then removed, and the DNA pellet was centrifuged at 13,000 rpm for 1 min. The DNA pellet was dried at room temperature before resuspension in TE buffer (Invitrogen) (50 µL, pH 8.0). Samples were stored at 4°C, and the DNA concentration was quantitated using a NanoDrop spectrophotometer (Thermo Fisher Scientific). DNA integrity was checked using 1% agarose gel electrophoresis.
Genomic DNA (gDNA) contamination check and reverse transcription
RNA samples (20 ng, in duplicate) were checked for contamination of gDNA as previously described [Citation12] using the SsoAdvanced™ Universal SYBR® Green Supermix (Bio-Rad) and primers that targeted an Actb intronic region. Contaminated RNA samples (Cq < 35) were DNase-treated using the TURBO DNA-freeTM kit (Thermo Fisher Scientific) and checked again using the same qPCR method.
qPCR gene expression analysis
Tbp and Ywhaz were determined to be the two most stable reference genes in our previous study [Citation12]. As the lncRNA Kcnq1ot1 sequence is not available on the rat assembly (UCSC Genome Browser Nov. 2020 (mRatBN7/rn7)), Kcnq1ot1 sequence from the mouse genome (UCSC Genome Browser Jun. 2020 (GRCm39/mm39)) was submitted to a UCSC BLAT search against the rat genome. Primers for Kcnq1ot1, Slc22a18, and Cars were then designed using NCBI Primer-BLAST (Table S1). Primer optimization, master mix preparation and qPCRs were performed as previously described [Citation12], with cycling conditions shown in Table S1.
DNA methylation analysis
A total of 34 rat PN1 DNA samples (1000 ng each) were sent to the Australian Genome Research Facility (AGRF) for region-specific quantitative DNA methylation analysis. Primers targeting two CpG islands (chr1:198,492,806–198,493,065 (CpG: 23) and chr1:198,493,269–198,493,580 (CpG: 20) (mRatBN7/rn7)) on the KvDMR1 imprinting control region were designed by AGRF (Table S2). DNA samples were bisulphite modified, followed by analyses using EpiTYPER Agena MassArray and Mass Cleave Chemistry test methods [Citation24].
Data analysis
Data were analysed using a linear mixed-effect model, with adjustments for litter size and relatedness between litter siblings as previously reported [Citation12], using R version 4.1.1 [Citation25,Citation26]. Power of the linear mixed-effect model was determined to be 0.998 and 0.993 for the analysis of gene expression and DNA methylation, respectively, calculated using the ‘pwr.f2.test’ function (‘pwr’ package) in the R environment, with n (sample size) = 38 for our expression studies and n = 33 for the DNA methylation analyses, respectively. Correlation between gene expression levels were determined using Spearman’s non-parametric correlation coefficient (no assumptions regarding data distribution), calculated using PAST 4.03 software [Citation27]. Sham and IUGR data were combined to investigate whether there is a relationship between expression of different pairs of genes, regardless of treatment. The relationships within each group were then examined to explore whether a certain correlation is present in one group and is absent/altered in the other group, potentially indicating disruption due to growth restriction.
Results
Expression of imprinted and non-imprinted genes in the kidney
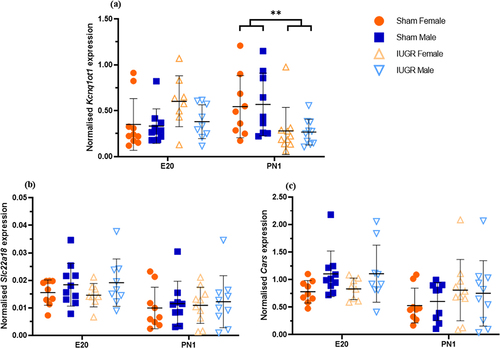
The expression of Kcnq1ot1 was not different between the sham and IUGR offspring at E20 (). However, at PN1, there was a significantly lower expression of Kcnq1ot1 in IUGR offspring than in sham offspring (reduced by approximately 50%, p < 0.01). The expression of another imprinted gene in the same KvDMR1 ubiquitously imprinted cluster (Slc22a18) and a non-imprinted gene (Cars) was also examined to determine whether the changes observed in Kcnq1ot1, Kcnq1 and Cdkn1c extended to other genes in this imprinting cluster. There was no significant difference in the expression of either Slc22a18 () or Cars () between the sham and IUGR offspring at any time point.
Figure 1. Normalised expression of the imprinted genes Kcnq1ot1 (a), Slc22a18 (b), and the non-imprinted gene Cars (c) in kidney tissues of sham and IUGR rat offspring at embryonic day 20 (E20) and postnatal day 1 (PN1). Significance was determined by linear mixed effect models, followed by a Tukey’s post hoc test (**p < 0.01). Data is expressed as mean ± SD; n = 8–10/group.
Correlation between gene expression levels in rat kidney
Pairwise non-parametric correlation analyses were carried out to investigate the potential correlations between the expression levels of genes in sham and IUGR offspring at E20 and PN1, including between pairs of imprinted genes known to be important in kidney development and regulated by the KvDMR1 ICR (Cdkn1c, Kcnq1, and Kcnq1ot1; and Table S3), as well as between imprinted genes and other genes (Dnmt1a, Dnmt3a, Peg3, Snrpn, Slc22a18, and Cars; Fig. S1 and Table S3). The expression of Cdkn1c, Kcnq1, Dnmt1a, Dnmt3a, Peg3, and Snrpn has been previously reported [Citation12].
Figure 2. Spearman’s non-parametric correlation matrices between three imprinted genes known to be important in kidney development and regulated by the KvDMR1 imprinting control region (Kcnq1ot1, Cdkn1c and Kcnq1) in kidney tissues of sham and IUGR rat offspring at embryonic day 20 (E20) and postnatal day 1 (PN1). Sham and IUGR data were combined in (a) for E20 and (d) for PN1. Spearman correlation coefficients (top number) and p-values (bottom number) are displayed on the right triangles. A cross through the box indicates a non-significant p-value. The size of the circle indicates how strong the correlation is (corresponded to the Spearman correlation coefficients).
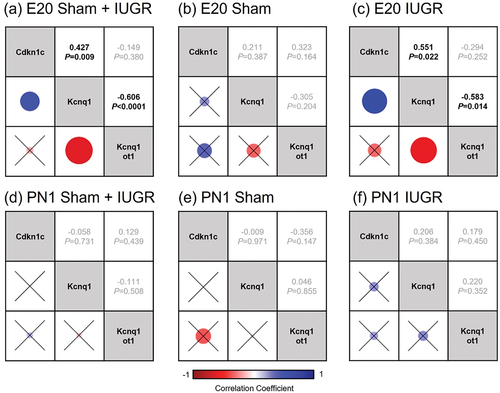
When sham and IUGR data were combined, there was a significant negative correlation between the expression of Dnmt3a and lncRNA Kcnq1ot1 at E20 (Spearman’s ρ = −0.455, p = 0.006, Fig. S1a and Table S3), as well as significant positive correlations between Dnmt3a and Kcnq1 and Dnmt3a and Cdkn1c (Spearman’s ρ = 0.896, p < 0.0001 and Spearman’s ρ = 0.349, p = 0.040, respectively; Fig. S1a and Table S3). Additionally, at E20, there was a negative correlation between Kcnq1ot1 and Kcnq1 and a positive correlation between Kcnq1 and Cdkn1c (Spearman’s ρ = −0.606, p < 0.0001 and Spearman’s ρ = 0.427, p = 0.009, respectively; and Table S3). The relationships between these pairs of genes (except Dnmt3a-Kcnq1) were no longer present at PN1 (Fig. S1b and Table S3).
Interestingly, when sham and IUGR were investigated individually at each time point, the negative correlation between Kcnq1ot1 and Kcnq1 was significant only in the E20 IUGR group (Spearman’s ρ = −0.583, p = 0.014, , S1c-f and Table S3). Additionally, there was a significant positive correlation between Kcnq1 and Cdkn1c in the E20 IUGR group (Spearman’s ρ = 0.551, p = 0.022), but not in the E20 sham group (, S1c, S1e and Table S3). No correlation was observed between Kcnq1ot1 and Cdkn1c expression in any of the groups at any time point. On the other hand, there was an inverse relationship between Dnmt3a and Kcnqot1 in the IUGR group, whereby at E20, there was a negative association (Spearman’s ρ = −0.421) and at PN1, there was a positive association (Spearman’s ρ = 0.370) (Fig. S1e, S1f and Table S3). However, these differences were not statistically significant.
DNA methylation status of the KvDMR1 imprinting control region
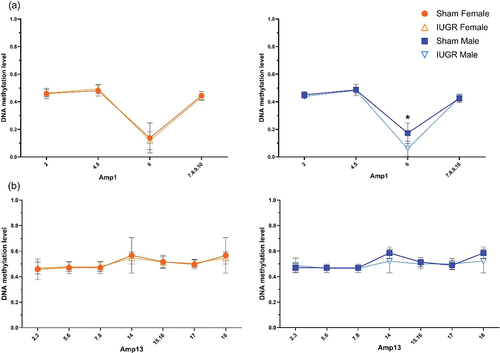
Base-specific cleavage of bisulphite-modified DNA yielded usable signals for four out of 16 (amplicon 1, ) and seven out of 20 (amplicon 13, ) CpG positions within CpG 23 and CpG 20 islands, respectively, in KvDMR1 ICR. There was hypomethylation (p < 0.05) at CpG site 6 of the CpG 23 island in IUGR males only (↓11.25%, methylation level in IUGR males 6% vs. sham males 17.25%, amplicon 1, ). Interestingly, unlike other CpG sites within this region where the DNA methylation level was ~50% (as expected for imprinted genes), there was a lower than 20% methylation level at CpG site 6, even in the sham animals. There was no statistically significant difference in the methylation status between sham and IUGR offspring at any site of the CpG 20 island (amplicon 13, ).
Figure 3. DNA methylation status of the KvDMR1 imprinting control region containing (a) CpG 23 (amplicon 1 (amp1), chr1:198,492,806–198,493,065, UCSC genome Browser Nov. 2020 (mRatbn7/rn7)) and (b) CpG 20 (amplicon 13 (amp13), chr1:198,493,269–198,493,580 (mRatbn7/rn7)) in sham and IUGR rat offspring at postnatal day 1 (PN1), determined using EpiTYPER Agena MassArray and mass cleave chemistry analyses. For CpG fragments that had the same mass peaks as other fragments containing same number of CpGs (Amp13, CpG_5.6 versus CpG_7.8 and CpG_14 versus CpG_18), methylation % was calculated between CpGs. Significance was determined by linear mixed effect models, followed by a Tukey’s post hoc test (*p < 0.05). Data is expressed as mean ± SD; n = 8–9/group.
KvDMR1 ICR was further analysed to identify the location of these CpG sites. As mentioned previously, the Kcnq1ot1 sequence is not available in the mRatBN7/rn7 rat genome. However, there was an uncharacterized lncRNA named LOC120099961 found in the rat mRatBN7.2 genome (NCBI Reference Sequence: NC_051336.1), which is located in a similar position as Kcnq1ot1 in other species genomes. Therefore, this rat sequence, together with other mouse sequences including the KvDMR1 region [Citation28], Kcnq1ot1 transcriptional repressor CTCF binding sites [Citation29], enhancer, promoter [Citation30], and TSS [Citation30,Citation31] were used in a BLAT search against the rat genome. The results for the (approximate) positions are shown in . While amplicon 13 (CpG 20) was located within both Kcnq1ot1 TSS and CTCF binding site 2, amplicon 1 (CpG 23) was not located within any of the sequences mentioned above (). Using TFBIND software (weight matrix in transcription factor database TRANSFAC R.3.4, similarity ≥80%) [Citation32] and TRANSFAC FACTOR TABLE (Release 2017.2), CpG site 6 (amplicon 1) was determined to correspond to different transcription factor binding sites (TFBSs) (). Among these, there were four TF that have been previously reported to play a role in kidney development and disease, as well as to be regulated by DNA methylation, including Chicken Ovalbumin Upstream Promoter Transcription Factor 2 (COUP-TF2) [Citation33–36], GATA-binding Factor 2 (GATA-2) [Citation37,Citation38], Serum Response Factor (SRF) [Citation39–41], and Activating enhancer binding Protein 2 alpha (AP-2α) [Citation42,Citation43]. When data from all examined CpG sites within each CpG island were combined, no significant difference in DNA methylation levels was found between the sham and IUGR kidney samples (Fig. S2).
Figure 4. Approximate positions of the two amplicons (amplicon 1 and 13, targeting CpG island 23 (chr1:198,492,806–198,493,065) and 20 (chr1:198,493,269–198,493) (mRatbn7/rn7), respectively) in the rat KvDMR1 imprinting control region (modified from Doan et al [Citation12].), examined using region-specific quantitative DNA methylation analysis. DNA methylation of KvDMR1 and/or expression of the lncRNA Kcnq1ot1 is known to play a role in controlling the monoallelic expression of imprinted genes in the KvDMR1 imprinting cluster. Primers were designed by the Australian genome Research Facility (AGRF). There was a hypomethylation (↓11.25%, p < 0.05) at CpG site 6 of CpG 23 island in PN1 growth restricted male kidneys. Kcnq1ot1 sequence is not available on the mRatbn7/rn7 rat genome. Hence, sequence from the uncharacterized lncRNA named LOC120099961 found on the rat mRatbn7.2 genome (NCBI reference sequence: NC_051336.1, similar position) was used. Mouse sequences, including KvDMR1 region [Citation28], Kcnq1ot1 transcriptional repressor CTCF binding sites [Citation29], enhancer, promoter [Citation30], and transcription start site [Citation30,Citation31] were used in a BLAT search against the rat genome. ↓: expression decreased; ↑: expression increased; (-): no change in gene expression. Note that the annotations of gene expressions in this figure is based on the circumstance that in a healthy animal, the imprinted genes Kcnq1 and Cdkn1c are expressed on the maternal allele, while Kcnq1ot1 is preferentially expressed on the paternal allele.
![Figure 4. Approximate positions of the two amplicons (amplicon 1 and 13, targeting CpG island 23 (chr1:198,492,806–198,493,065) and 20 (chr1:198,493,269–198,493) (mRatbn7/rn7), respectively) in the rat KvDMR1 imprinting control region (modified from Doan et al [Citation12].), examined using region-specific quantitative DNA methylation analysis. DNA methylation of KvDMR1 and/or expression of the lncRNA Kcnq1ot1 is known to play a role in controlling the monoallelic expression of imprinted genes in the KvDMR1 imprinting cluster. Primers were designed by the Australian genome Research Facility (AGRF). There was a hypomethylation (↓11.25%, p < 0.05) at CpG site 6 of CpG 23 island in PN1 growth restricted male kidneys. Kcnq1ot1 sequence is not available on the mRatbn7/rn7 rat genome. Hence, sequence from the uncharacterized lncRNA named LOC120099961 found on the rat mRatbn7.2 genome (NCBI reference sequence: NC_051336.1, similar position) was used. Mouse sequences, including KvDMR1 region [Citation28], Kcnq1ot1 transcriptional repressor CTCF binding sites [Citation29], enhancer, promoter [Citation30], and transcription start site [Citation30,Citation31] were used in a BLAT search against the rat genome. ↓: expression decreased; ↑: expression increased; (-): no change in gene expression. Note that the annotations of gene expressions in this figure is based on the circumstance that in a healthy animal, the imprinted genes Kcnq1 and Cdkn1c are expressed on the maternal allele, while Kcnq1ot1 is preferentially expressed on the paternal allele.](/cms/asset/5613ad08-9704-49cf-8de2-03c65de465a3/kepi_a_2294516_f0004_oc.jpg)
Table 1. Transcription factor binding sites (TFBSs) correspond to CpG:23 island (amplicon 1, chr1:198,492,806–198,493,065), where there was a hypomethylation at CpG site 6 (coloured in red) in IUGR male kidneys. TFBSs were determined using TFBIND software (weight matrix in transcription factor database TRANSFAC R.3.4) [32] and TRANSFAC FACTOR TABLE (release 2017.2). Left to right: TF name, matrix ID (from TRANSFAC R.3.4), label in TFBIND, similarity compared to input sequence, strand that the transcription factor binds, and sequence of the TFBS.
Discussion
The imprinted gene Kcnq1ot1 has been previously shown to be altered in growth restricted offspring due to environmental exposure during early life [Citation44,Citation45]. Specifically, reduced expression of this lncRNA has been reported in placentae of E16.5 growth restricted male mice whose mothers were exposed to 50 ppm of the heavy metal cadmium throughout pre-conception, mating, and pregnancy [Citation44], as well as in E18.5 growth restricted mice who were conceived through in vitro fertilization (IVF) [Citation45]. In our current study, as expected, there was a significant decrease in Kcnq1ot1 expression in kidneys of F1 growth restricted rat offspring at PN1. From studies in mice, the function of Kcnq1ot1 is suggested to partially control the allele-specific expression of other imprinted genes in the same KvDMR1 imprinting cluster, including those investigated in this current study, in a tissue-specific manner; however, the exact mechanism is still unclear [Citation29,Citation46,Citation47]. For instance, deletion of the whole KvDMR1 ICR (2.8 kb [Citation46] or 3.6 kb [Citation47], which abolished Kcnq1ot1 expression), deletion of Kcnq1ot1 promoter and TSS region (224 bp) [Citation47], producing a shorter transcript by inserting a transcription stop element at 1.5 kb downstream of the lncRNA TSS [Citation47], or truncation of Kcnq1ot1 (2.6 kb downstream of its promoter) [Citation29], on the paternal allele, was reported to be associated with activation of the normally paternally silenced genes in mouse embryonic tissues (E11.5–16.5). Biallelic gene expression was reported for Slc22a18 (placenta [Citation29,Citation47], liver, gut, kidney, lung, heart, brain, and fibroblast [Citation29]), Kcnq1 (placenta [Citation29,Citation47], liver [Citation29,Citation46], gut, kidney, lung, heart, brain, and fibroblast [Citation29]), and Cdkn1c (whole embryo, placenta [Citation29,Citation47], liver [Citation46], heart, brain, and gut [Citation29]). However, monoallelic expression of Cdkn1c has been reported in the liver, kidney, lung, and fibroblasts of mice at E15.5, despite the Kcnq1ot1 truncation, which remains to be explained [Citation29].
In line with the above findings, studies in mouse IUGR models also reported alterations to the imprinted genes that are known to be regulated by KvDMR1, in association with decreased Kcnq1ot1 expression [Citation44,Citation45]. Growth restricted mice conceived through IVF have decreased placental Cdkn1c expression compared to in vivo controls at E18.5, despite a similar expression at E14.5 [Citation45]. In contrast, Cdkn1c overall expression was increased in the placentae of E18.5 growth restricted mice whose mothers were exposed to Cadmium [Citation44]. Meanwhile, there was no alteration in placental Kcnq1 expression in these mice [Citation44]. Additionally, allele-specific expression analysis indicated no difference in Cdkn1c expression between growth restricted and sham animals [Citation44]. In our study of growth restricted rat kidneys, Cdkn1c expression was reduced only in IUGR females at E20, while PN1 IUGR offspring had decreased Cdkn1c and increased Kcnq1 expression compared to sham [Citation12]. Together with the above-mentioned findings, the fact that our results report decreased Kcnq1ot1 only in PN1, but not E20, IUGR rats as well as no correlation between Kcnq1ot1 and Cdkn1c expression in any of the groups, at any timepoint, suggests that changes in lncRNA Kcnq1ot1 expression alone is not sufficient to explain changes in Cdkn1c in IUGR rat kidneys. Allele-specific expression analysis of these imprinted genes would provide a better understanding of their potential relationships.
As Dnmt3a was reported in our previous study to be decreased in IUGR kidneys at E20 [Citation12], we hypothesized that there were alterations in the DNA methylation profile, including that of the KvDMR1 ICR, which is involved in dysregulation of the expression of imprinted genes that are known to be important in foetal kidney development. In babies diagnosed with Russell-Silver syndrome, characterized by intrauterine and postnatal growth restriction, alterations in KvDMR1 DNA methylation, either hypermethylation [Citation48–50] or hypomethylation [Citation51], have been reported in their blood samples. In human IUGR studies, KvDMR1 DNA methylation status was mostly studied using placental tissues, with no significant difference observed between growth restricted tissues and healthy controls [Citation52–55]. In the current study of rat kidneys, hypomethylation was found at a CpG site of CpG 23 island (chr1:198,492,806–198,493,065) within KvDMR1 in PN1 IUGR males. This CpG site was not located within any of the Kcnq1ot1 regulatory regions that we were able to assess. However, this position is a potential target for several TFs known to be important in kidney development and disease, including but not limited to COUP-TF2, GATA-2, SRF, and AP-2α. Future studies should investigate the potential interaction of these TFs with KvDMR1 and the biological function of such event. Furthermore, as these TFs have been previously shown to be impacted by DNA methylation [Citation33,Citation34,Citation38,Citation39,Citation42], alteration to the Dnmt3a expression in our study could also have an effect on their expression and/or function. Another important point to mention here is that DNA methylation level of this specific site was also lower than 50% in sham animals, which is not typical for imprinted genes where the silenced allele is often methylated. Meanwhile, investigation of the CpG 41 island in the placentae of E18.5 growth restricted female mice (conserved sequence of KvDMR1 CpG 23 island in rats) showed no change in DNA methylation of any other CpG sites within this region (chr1:198,493,086–198,493,233) [Citation44]. In addition, our results show that the mean DNA methylation levels within this CpG 23 island as well as within the CpG 20 island (chr1:198,493,269–198,493,580) of the KvDMR1 ICR were also not different between sham and IUGR offspring. Nonetheless, apart from the differences in tissues examined, it should be noted that different regions within and near the KvDMR1 ICR were investigated in the above studies, which could be a potential limitation of the present study. Additionally, the kidney is a complex organ that comprises more than 20 differentiated cell types [Citation56]. Recent single-cell RNA sequencing databases in both adult mice [Citation57,Citation58] and rats [Citation59] suggest that the three imprinted genes (Cdkn1c, Kcnq1, and Kcnq1ot1) investigated in our study have different expression levels in different renal cell types. Specifically, Cdkn1c is highly expressed in stromal cells and podocytes (visceral epithelium), while Kcnq1 is highly expressed in collecting duct intercalated cells and connecting tubule principal-like cells. Kcnq1ot1 (mouse data) is also highly expressed in podocytes. Since we only assessed DNA methylation of one region using region-specific quantitative DNA methylation analysis method, this did not allow for assessing or adjusting for different cell types.
Besides KvDMR1, DNA methylation of the Cdkn1c promoter region is also an important mechanism that needs to be explored, as it is known to be important in maintaining allele-specific gene expression during embryonic development in healthy mice [Citation60]. However, in the mouse Kcnq1ot1 truncation model, where Cdkn1c allele-specific expression was shown to be either altered or unchanged in different embryonic tissues, there was no difference in Cdkn1c promoter DNA methylation levels in all tissues at E15.5, suggesting a different mechanism for maintaining Cdkn1c monoallelic expression [Citation29]. In contrast, in the placentae of E18.5 Cadmium-exposed growth restricted mice, where expression of Kcnq1ot1 decreased and expression of Cdkn1c increased, there was a reduction in DNA methylation in one out of 23 investigated CpG sites in the Cdkn1c promoter region [Citation44]. However, the mean methylation level of the whole CpG island did not change compared with that of the sham offspring [Citation44]. Future studies should investigate epigenetic alterations in the Cdkn1c promoter region.
In summary, at PN1, there was a 50% decrease in the expression of an antisense lncRNA (Kcnq1ot1) in IUGR rats compared to that in sham animals. This is the first study to report changes in Kcnq1ot1 in UPI-induced growth restricted rat kidneys. H19 is another lncRNA and imprinted gene that plays an important role in development. H19 has also been shown to be altered in rodent and human IUGR studies, with significant changes in its expression and DNA methylation in many tissues (e.g., sperm, liver, blood, and placenta [Citation1,Citation61–63]). In this study, there was a negative correlation between Kcnq1ot1 and the gene that it is located within (Kcnq1), only in E20 IUGR kidneys. As Kcnq1 was also altered at PN1 [Citation12], these results suggest that an abnormal event occurred early during foetal nephron formation, which later affected the expression of imprinted genes within the KvDMR1 ICR. In contrast, changes in Kcnq1ot1 were not sufficient to explain the decrease in the expression of another imprinted gene within the same KvDMR1 imprinting cluster, Cdkn1c, at both E20 (IUGR females) and PN1 (IUGR males and females) [Citation12], as no correlation was found between the two genes in any group at any time point. As there was a decrease in Dnmt3a expression in E20 IUGR kidneys [Citation12] and significant correlations between Dnmt3a and Kcnq1/Kcnq1ot1/Cdkn1c at E20, the DNA methylation profile of KvDMR1 was investigated. Hypomethylation was found at a CpG site only in PN1 IUGR males. However, the importance of the alteration of this specific CpG site and its effect on the IUGR kidney is yet to be determined. Future studies should investigate the allele-specific expression of these genes, the reason for DNA methylation changes at one CpG site in KvDMR1, and other epigenetic mechanisms.
Disclaimers
The views expressed in this manuscript are those of the authors.
Source of support
This research was supported by the National Health and Medical Research Council (NHMRC) of Australia (M.E.W.; 1045602), the Heart Foundation (M.E.W.; G 11 M 5785), a La Trobe University Faculty of Health Sciences Research Grant Award (T.R.), and a Robinson Research Institute (RRI) Seed Grant (T.B-M, M.E.W., and J.F.B.), and supported by the School of Agriculture, Food and Wine, University of Adelaide.
Supplemental Material
Download MS Word (947.9 KB)Acknowledgments
The authors would like to thank Sandy Khor and Neil Shirley (University of Adelaide) for their help in Qiagility liquid-handling robot programming and setup.
Disclosure statement
No potential conflict of interest was reported by the authors.
Data availability statement
The data that support the findings of this study are available from the corresponding author ([email protected]) upon request.
Supplementary material
Supplemental data for this article can be accessed online at https://doi.org/10.1080/15592294.2023.2294516
Additional information
Funding
References
- Doan TNA, Akison LK, Bianco-Miotto T. Epigenetic mechanisms responsible for the transgenerational inheritance of intrauterine growth restriction phenotypes. Front Endocrinol (Lausanne). 2022;13:838737. doi: 10.3389/fendo.2022.838737
- Sharma D, Shastri S, Sharma P. Intrauterine growth restriction: antenatal and postnatal aspects. Clin Med Insights Pediatr. 2016;10:67–12. doi: 10.4137/CMPed.S40070
- Dalle Molle R, Bischoff AR, Portella AK, et al. The fetal programming of food preferences: current clinical and experimental evidence. J Dev Orig Health Dis. 2016;7(3):222–230. doi: 10.1017/S2040174415007187
- Skinner MK, Manikkam M, Tracey R, et al. Ancestral dichlorodiphenyltrichloroethane (DDT) exposure promotes epigenetic transgenerational inheritance of obesity. BMC Med. 2013;11:228. doi: 10.1186/1741-7015-11-228
- Skinner MK, Ben Maamar M, Sadler-Riggleman I, et al. Alterations in sperm DNA methylation, non-coding RNA and histone retention associate with DDT-induced epigenetic transgenerational inheritance of disease. Epigenet Chromatin. 2018;11(1):8. doi: 10.1186/s13072-018-0178-0
- Thorson JLM, Beck D, Ben Maamar M, et al. Ancestral plastics exposure induces transgenerational disease-specific sperm epigenome-wide association biomarkers. Environ Epigenet. 2021;7(1):dvaa023. doi: 10.1093/eep/dvaa023
- Weber-Stadlbauer U, Richetto J, Zwamborn RAJ, et al. Transgenerational modification of dopaminergic dysfunctions induced by maternal immune activation. Neuropsychopharmacology. 2021;46(2):404–412. doi: 10.1038/s41386-020-00855-w
- Goyal D, Limesand SW, Goyal R. Epigenetic responses and the developmental origins of health and disease. J Endocrinol. 2019;242(1):T105–T119. doi: 10.1530/joe-19-0009
- Siklenka K, Erkek S, Godmann M, et al. Disruption of histone methylation in developing sperm impairs offspring health transgenerationally. Science. 2015;350(6261):aab2006. doi: 10.1126/science.aab2006
- Lismer A, Siklenka K, Lafleur C, et al. Sperm histone H3 lysine 4 trimethylation is altered in a genetic mouse model of transgenerational epigenetic inheritance. Nucleic Acids Res. 2020;48(20):11380–11393. doi: 10.1093/nar/gkaa712
- Briffa JF, Wlodek ME, Moritz KM. Transgenerational programming of nephron deficits and hypertension. Semin Cell Dev Biol. 2018;S1084-9521(17):30447–0. doi: 10.1016/j.semcdb.2018.05.025
- Doan TNA, Briffa JF, Phillips AL, et al. Epigenetic mechanisms involved in intrauterine growth restriction and aberrant kidney development and function. J Dev Orig Health Dis. 2021;12(6):952–962. doi: 10.1017/S2040174420001257
- Gallo LA, Tran M, Cullen-McEwen LA, et al. Transgenerational programming of fetal nephron deficits and sex-specific adult hypertension in rats. Reprod Fertil Dev. 2014;26(7):1032–1043. doi: 10.1071/RD13133
- Gallo LA, Tran M, Moritz KM, et al. Cardio-renal and metabolic adaptations during pregnancy in female rats born small: implications for maternal health and second generation fetal growth. Journal Of Physiology. 2012;590(3):617–630. doi: 10.1113/jphysiol.2011.219147
- Master JS, Zimanyi MA, Yin KV, et al. Transgenerational left ventricular hypertrophy and hypertension in offspring after uteroplacental insufficiency in male rats. Clin Exp Pharmacol Physiol. 2014;41(11):884–890. doi: 10.1111/1440-1681.12303
- Tran M, Gallo LA, Jefferies AJ, et al. Transgenerational metabolic outcomes associated with uteroplacental insufficiency. J Endocrinol. 2013;217(1):105–118. doi: 10.1530/JOE-12-0560
- Wadley GD, Siebel AL, Cooney GJ, et al. Uteroplacental insufficiency and reducing litter size alters skeletal muscle mitochondrial biogenesis in a sex-specific manner in the adult rat. Am J Physiol Endocrinol Metab. 2008;294(5):E861–E869. doi: 10.1152/ajpendo.00037.2008
- Horsthemke B. A critical view on transgenerational epigenetic inheritance in humans. Nat Commun. 2018;9(1):2973. doi: 10.1038/s41467-018-05445-5
- Cordeiro A, Neto AP, Carvalho F, et al. Relevance of genomic imprinting in intrauterine human growth expression of CDKN1C, H19, IGF2, KCNQ1 and PHLDA2 imprinted genes. J Assist Reprod Genet. 2014;31(10):1361–1368. doi: 10.1007/s10815-014-0278-0
- Saha P, Verma S, Pathak RU, et al. Long noncoding RNAs in mammalian development and diseases. Adv Exp Med Biol. 2017;1008:155–198. doi: 10.1007/978-981-10-5203-3_6
- Wlodek ME, Westcott K, Siebel AL, et al. Growth restriction before or after birth reduces nephron number and increases blood pressure in male rats. Kidney Int. 2008;74(2):187–195. doi: 10.1038/ki.2008.153
- Wlodek ME, Mibus A, Tan A, et al. Normal lactational environment restores nephron endowment and prevents hypertension after placental restriction in the rat. J Am Soc Nephrol. 2007;18(6):1688–1696. doi: 10.1681/asn.2007010015
- Miller SA, Dykes DD, Polesky HF. A simple salting out procedure for extracting DNA from human nucleated cells. Nucleic Acids Res. 1988;16(3):1215. doi: 10.1093/nar/16.3.1215
- Suchiman HE, Slieker RC, Kremer D, et al. Design, measurement and processing of region-specific DNA methylation assays: the mass spectrometry-based method EpiTYPER. Front Genet. 2015;6:287. doi: 10.3389/fgene.2015.00287
- R Core Team. R: A language and environment for statistical computing. Vienna, Austria: R Foundation for Statistical Computing; 2018. Available from: http://www.R-project.org/
- Team R. RStudio: integrated development for R. Boston, MA: RStudio, PBC; 2020. Available from: http://www.rstudio.com/
- Øyvind H, David ATH, Paul DR. PAST: Paleontological statistics software package for education and data analysis. Palaeont Electr. 2001;4(1):1–9.
- Fitzpatrick GV, Pugacheva EM, Shin JY, et al. Allele-specific binding of CTCF to the multipartite imprinting control region KvDMR1. Mol Cell Biol. 2007;27(7):2636–2647. doi: 10.1128/mcb.02036-06
- Shin JY, Fitzpatrick GV, Higgins MJ. Two distinct mechanisms of silencing by the KvDMR1 imprinting control region. EMBO J. 2008;27(1):168–178. doi: 10.1038/sj.emboj.7601960
- Mancini-DiNardo D, Steele SJS, Ingram RS, et al. A differentially methylated region within the gene Kcnq1 functions as an imprinted promoter and silencer. Hum Mol Genet. 2003;12(3):283–294. doi: 10.1093/hmg/ddg024
- Abugessaisa I, Noguchi S, Hasegawa A, et al. refTSS: a reference data set for human and mouse transcription start sites. J Mol Biol. 2019;431(13):2407–2422. doi: 10.1016/j.jmb.2019.04.045
- Tsunoda T, Takagi T. Estimating transcription factor bindability on DNA. Bioinformatics. 1999;15(7–8):622–30. doi: 10.1093/bioinformatics/15.7.622
- Baribault C, Ehrlich KC, Ponnaluri VKC, et al. Developmentally linked human DNA hypermethylation is associated with down-modulation, repression, and upregulation of transcription. Epigenetics. 2018;13(3):275–289. doi: 10.1080/15592294.2018.1445900
- Kao C-Y, Xu M, Wang L, et al. Elevated COUP-TFII expression in dopaminergic neurons accelerates the progression of Parkinson’s disease through mitochondrial dysfunction. PLoS Genet. 2020;16(6):e1008868. doi: 10.1371/journal.pgen.1008868
- Li L, Galichon P, Xiao X, et al. Orphan nuclear receptor COUP-TFII enhances myofibroblast glycolysis leading to kidney fibrosis. EMBO Rep. 2021;22(6):e51169. doi: 10.15252/embr.202051169
- Ishii S, Koibuchi N. COUP-TFII in kidneys, from embryos to sick adults. Diagnostics. 2022;12(5). doi: 10.3390/diagnostics12051181
- Estrela GR, Freitas-Lima LC, Budu A, et al. Chronic kidney disease induced by Cisplatin, folic acid and renal ischemia reperfusion induces anemia and promotes GATA-2 activation in mice. Biomedicines. 2021;9(7):769. doi: 10.3390/biomedicines9070769
- Yang X, Mei C, Nie H, et al. Expression profile and prognostic values of GATA family members in kidney renal clear cell carcinoma. Aging. 2023;15(6):2170–2188. doi: 10.18632/aging.204607
- Liu Z, Zhang J, Gao Y, et al. Large-scale characterization of DNA methylation changes in human gastric carcinomas with and without metastasis. Clin Cancer Res. 2014;20(17):4598–4612. doi: 10.1158/1078-0432.CCR-13-3380
- Zhao L, Li C, Guan C, et al. Serum response factor, a novel early diagnostic biomarker of acute kidney injury. Aging. 2021 Jan 5;13(2):2885–2894. doi: 10.18632/aging.202381
- Drake KA, Chaney C, Patel M, et al. Transcription factors YAP/TAZ and SRF cooperate to specify renal myofibroblasts in the developing mouse kidney. J Am Soc Nephrol. 2022;33(9):1694–1707. doi: 10.1681/asn.2021121559
- Makhov PB, Golovine KV, Kutikov A, et al. Reversal of epigenetic silencing of AP-2alpha results in increased zinc uptake in DU-145 and LNCaP prostate cancer cells. Carcinogenesis. 2011;32(12):1773–1781. doi: 10.1093/carcin/bgr212
- Lamontagne JO, Zhang H, Zeid AM, et al. Transcription factors AP-2α and AP-2β regulate distinct segments of the distal nephron in the mammalian kidney. Nat Commun. 2022;13(1):2226. doi: 10.1038/s41467-022-29644-3
- Simmers MD, Hudson KM, Baptissart M, et al. Epigenetic control of the imprinted growth regulator Cdkn1c in cadmium-induced placental dysfunction. Epigenetics. 2022;18:1–17. doi: 10.1080/15592294.2022.2088173
- Chen S, Sun FZ, Huang X, et al. Assisted reproduction causes placental maldevelopment and dysfunction linked to reduced fetal weight in mice. Sci Rep. 2015;5:10596. doi: 10.1038/srep10596
- Fitzpatrick GV, Soloway PD, Higgins MJ. Regional loss of imprinting and growth deficiency in mice with a targeted deletion of KvDMR1. Nature Genet. 2002;32(3):426–431. doi: 10.1038/ng988
- Mancini-Dinardo D, Steele SJS, Levorse JM, et al. Elongation of the Kcnq1ot1 transcript is required for genomic imprinting of neighboring genes. Genes Dev. 2006;20(10):1268–1282. doi: 10.1101/gad.1416906
- Cytrynbaum C, Chong K, Hannig V, et al. Genomic imbalance in the centromeric 11p15 imprinting center in three families: further evidence of a role for IC2 as a cause of Russell–Silver syndrome. Am J Med Genet A. 2016;170(10):2731–2739. doi: 10.1002/ajmg.a.37819
- Bonaldi A, Mazzeu JF, Costa SS, et al. Microduplication of the ICR2 domain at chromosome 11p15 and familial Silver–Russell syndrome. Am J Med Genet A. 2011;155(10):2479–2483. doi: 10.1002/ajmg.a.34023
- Mio C, Allegri L, Passon N, et al. A paternally inherited 1.4 kb deletion of the 11p15.5 imprinting center 2 is associated with a mild familial Silver–Russell syndrome phenotype. Eur J Hum Genet. 2021;29(3):447–454. doi: 10.1038/s41431-020-00753-1
- Passaretti F, Pignata L, Vitiello G, et al. Different mechanisms cause hypomethylation of both H19 and KCNQ1OT1 imprinted differentially methylated regions in two cases of Silver-Russell syndrome spectrum. Genes. 2022;13(10):1875. doi: 10.3390/genes13101875
- López-Abad M, Iglesias-Platas I, Monk D. Epigenetic characterization of CDKN1C in placenta samples from non-syndromic intrauterine growth restriction. Front Genet. 2016;7:62. doi: 10.3389/fgene.2016.00062
- Caniçais C, Vasconcelos S, Ramalho C, et al. Deregulation of imprinted genes expression and epigenetic regulators in placental tissue from intrauterine growth restriction. J Assist Reprod Genet. 2021;38(4):791–801. doi: 10.1007/s10815-020-02047-3
- Guo L, Choufani S, Ferreira J, et al. Altered gene expression and methylation of the human chromosome 11 imprinted region in small for gestational age (SGA) placentae. Dev Biology. 2008;320(1):79–91. doi: 10.1016/j.ydbio.2008.04.025
- Bourque DK, Avila L, Peñaherrera M, et al. Decreased placental methylation at the H19/IGF2 imprinting control region is associated with normotensive intrauterine growth restriction but not preeclampsia. Placenta. 2010;31(3):197–202. doi: 10.1016/j.placenta.2009.12.003
- Al-Awqati Q, Oliver JA. Stem cells in the kidney. Kidney Int. 2002;61(2):387–395. doi: 10.1046/j.1523-1755.2002.00164.x
- Park J, Shrestha R, Qiu C, et al. Single-cell transcriptomics of the mouse kidney reveals potential cellular targets of kidney disease. Science. 2018;360(6390):758–763. doi: 10.1126/science.aar2131
- Ransick A, Lindström NO, Liu J, et al. Single-cell Profiling Reveals sex, lineage, and regional diversity in the mouse kidney. Dev Cell. 2019;51(3):399–413.e7. doi: 10.1016/j.devcel.2019.10.005
- Ding F, Tian X, Mo J, et al. Determination of the dynamic cellular transcriptional profiles during kidney development from birth to maturity in rats by single-cell RNA sequencing. Cell Death Discov. 2021;7(1):162. doi: 10.1038/s41420-021-00542-9
- Bhogal B, Arnaudo A, Dymkowski A, et al. Methylation at mouse Cdkn1c is acquired during postimplantation development and functions to maintain imprinted expression. Genomics. 2004;84(6):961–970. doi: 10.1016/j.ygeno.2004.08.004
- Guo T, Luo F, Lin Q. You are affected by what your parents eat: diet, epigenetics, transgeneration and intergeneration. Trends Food Sci Technol. 2020;100:248–261. doi: 10.1016/j.tifs.2020.04.021
- Salmeri N, Carbone IF, Cavoretto PI, et al. Epigenetics beyond fetal growth restriction: a comprehensive overview. Mol Diagn Ther. 2022;26(6):607–626. doi: 10.1007/s40291-022-00611-4
- Basak T, Ain R. Long non-coding RNAs in placental development and disease. Non-Cod RNA Investgat. 2019;3. doi: 10.21037/ncri.2019.03.01