
ABSTRACT
N6 methyladenosine (m6A), methylation at the sixth N atom of adenosine, is the most common and abundant modification in mammalian mRNAs and non-coding RNAs. Increasing evidence shows that the alteration of m6A modification level could regulate tumour proliferation, metastasis, self-renewal, and immune infiltration by regulating the related expression of tumour genes. However, the role of m6A modification in colorectal cancer (CRC) drug resistance is unclear. Here, MeRIP-seq and RNA-seq techniques were utilized to obtain mRNA, lncRNA expression, and their methylation profiles in 5-Fluorouracil (5-FU)-resistant colon cancer HCT-15 cells and control cells. In addition, we performed detailed bioinformatics analysis as well as in vitro experiments of lncRNA to explore the function of lncRNA with differential m6A in CRC progression and drug resistance. In this study, we obtained the m6A methylomic landscape of CRC cells and resistance group cells by MeRIP-seq and RNA-seq. We identified 3698 differential m6A peaks, of which 2224 were hypermethylated, and 1474 were hypomethylated. Among the lncRNAs, 60 were hypermethylated, and 38 were hypomethylated. GO and KEGG analysis annotations showed significant enrichment of endocytosis and MAPK signalling pathways. Moreover, knockdown of lncRNA ADIRF-AS1 and AL139035.1 promoted CRC proliferation and invasive metastasis in vitro. lncRNA- mRNA network showed that ADIRF-AS1 and AL139035.1 May play a key role in regulating drug resistance formation. We provide the first m6A methylation profile in 5-FU resistance CRC cells and analyse the functions of differential m6A-modified mRNAs and lncRNAs. Our results indicated that differential m6A RNAs were significantly associated with MAPK signalling and endocytosis after induction of 5-FU resistance. Knockdown of LncRNA ADIRF-AS1 and AL139035.1 promotes CRC progression and might be critical in regulating drug resistance formation.
KEY MESSAGES
We outline the first m6A methylation profile of mRNA and lncRNA in CRC cells involved in 5-FU resistance.
This study sought to identify the critical genes that produced 5-FU resistance by analysing the functions of differentially m6A-modified mRNAs and lncRNAs.
Introduction
Colorectal cancer (CRC) is one of the most common gastrointestinal malignancies worldwide. Epidemiological evidence shows that it is currently the fourth leading cause of cancer death globally, accounting for approximately 10% of all cancers and cancer-related deaths diagnosed each year, resulting in about 900,000 deaths per year [Citation1]. With the significant advancement in the diagnosis and treatment of CRC, the survival rate of patients with CRC has improved. However, there are still patients diagnosed with clinically advanced or metastatic CRC, which is unresectable tumour. In order to downstage the tumour making it possible to achieve complete surgical resection and hence improve the survival rate of CRC patients, preoperative radiotherapy is one of the most effective methods of adjuvant treatment for the vast majority of patients with advanced colorectal cancer at present. 5-Fluorouracil (5-FU) is an antimetabolite, which is an effective and most commonly used first-line chemotherapeutic agent for the treatment of various malignant tumours, including colorectal cancer. The hydrogen in the C5 position of uracil is replaced by fluorine, and 5-FU is first converted into 5-fluoro-2-deoxyuracil nucleotide in vivo, then inhibits thymine nucleotide synthetase, blocking the conversion of uracil deoxyribonucleotide to thymine deoxyribonucleotide, affecting DNA biosynthesis and thus inhibiting the growth of cancer cells [Citation2]. Unfortunately, the response rate to treatment remains low, and patient benefit from 5- fu-based therapy is frequently compromised by chemoresistance. This is mainly due to the cells’ inherent or acquired resistance against anti-tumour drugs, causing cancer cells to be resistant to drug-induced cell death in the long-term chemotherapy process [Citation3]. Similarly, ursolic acid (UA), a pentacyclic triterpenoid that inhibits cell proliferation and induces apoptosis, exhibits anti-tumour effects in CRC. More importantly, UA leads to chemosensitization of CRC cells to 5-Fu and oxaliplatin [Citation4]. The development of such chemoresistance may be related to multidrug resistance and membrane drug transporters, the tumour microenvironment, and epigenetic alterations [Citation5]. In addition, radioresistance from several treatments in radiation therapy may also lead to acquired chemoresistance. Afshar et al. revealed cross-resistance to gefitinib and regorafenib in radiation-established acquired radioresistant colorectal cancer cells [Citation6]. Epigenetic alterations constitute one of the mechanisms for conferring 5-FU resistance [Citation7]. It has been shown that DNA methylation, histone posttranslational modification and regulation of gene expression by long non-coding RNAs are the three types of epigenetic modifications involved in the more well-established types of CRC resistance [Citation8,Citation9]. Therefore, it is essential to further elucidate the mechanism of chemoresistance in CRC cells, which may identify target molecules associated with drug resistance and could be crucial to solving this problem.
N6 methyladenosine (m6A) modification, the addition of a methyl group to the N6 position of adenosine, is the most common internal modification on eukaryotic RNA. A growing number of studies have shown that m6A can regulate gene expression, thereby regulating cellular self-renewal, differentiation, invasion, and apoptotic processes [Citation10]. m6A is primarily regulated by three types of regulators, namely writers, erasers, and readers, and the respective regulatory proteins mediate their biological effects. m6A modification can affect mRNA splicing, degradation, translation, and other processes. It also affects post-transcriptional gene expression by changing the mRNA structure or through the specific recognition of m6A-binding proteins [Citation11]. Kasowitz et al. found that YTHDC1 interacts with the SR splicing factors SRSF3 and SRSF7 to participate in the selection of polyadenylation sites, thereby regulating mRNA 3’ UTR length [Citation12]. Zhang et al. showed that overexpression of IGF2BP1 could stabilize PEG10 mRNA and promote PEG10 protein expression by recognizing specific m6A sites [Citation13].
In addition, m6A modification is not limited to mRNA; it is also found in many long non-coding RNAs (lncRNAs). lncRNA is a non-coding RNA with more than 200 nucleotides, which does not code for a functional protein. Evidence has shown that lncRNA not only plays a vital role in various biological functions such as epigenetic modification, mRNA transcription, splicing, stability, and translation but also regulates cancer drug resistance [Citation14]. In the study of pancreatic cancer resistance to gemcitabine, Xiong et al. found that the lncRNA GSTM3TV2 can upregulate LAT2 and OLR1 through competitively sponging let-7 and promote pancreatic cancer resistance to gemcitabine [Citation15]. Further, Chen et al. demonstrated that METTL3-dependent m6A RNA methylation could promote the development of hepatoma cells and enhance resistance to sorafenib by stabilizing lncRNA NIFK-AS1 levels [Citation16]. However, little research has been done on whether m6A-modified lncRNAs are involved in the formation of chemoresistance in CRC, and its mechanism in CRC resistance is still unclear. Therefore, it is necessary to study the role and mechanism of m6A-modified lncRNA in CRC drug resistance.
Materials and methods
Cell culture
Human colon cancer cells HCT15 and 5-fluorouracil-resistant HCT15 cells (HCT15/5FU) were purchased from Cybercomb Shanghai Biotechnology Co., Ltd. HCT15 was cultured in 1640 medium (RPMI 1640, Solarbio) supplemented with 10% FBS (foetal bovine serum, Excell Bio) at 5% CO2 and 37°C. HCT15/5-FU was placed in 1640 medium containing 16 μg/ml 5-Fluorouracil (MACKLIN).
MeRIP‑seq
Two drug-resistant and two control group samples were used for MeRIP-seq. Total RNA was extracted using TRIzol™ Reagent (Invitrogen 15,596,018). The concentration of total RNA was measured by Qubit RNA HS assay kit (Invitrogen, Q32852) to eliminate samples that did not meet the requirements.100 μg total RNA was fragmented into 100–200 nt RNA fragments using 10X RNA Fragmentation Buffer (100 mM Tris-HCl, 100 mM ZnCl2 in nuclease-free H2O). The reaction was stopped by adding 10X EDTA (0.5 M EDTA). Methylated RNA immunoprecipitation (IP) was performed using the EpiTM m6A immunoprecipitation kit (Epibiotek, R1804). Briefly, the fragmented RNA was incubated with an anti-m6A monoclonal antibody (Abcam, ab208577) for 3 hours at 4°C and then with protein A/G magnetic beads (Invitrogen, 8880210002D/10004D) at 4°C for an additional 2 hours to obtain immunoprecipitated RNA fragments. The m6A-enriched RNA was purified using TRIzol™ Reagent (Invitrogen 15,596,018). The library was prepared using the smart-seq method. After MeRIP‑seq and RNA-seq libraries were generated, the input samples without IP and the m6A IP samples were subjected to 150-bp, paired-end sequencing on an Illumina NovaSeq 6000 sequencer.
Bioinformatic analysis
Cutadapt (v2.5) was used to trim adapters and filter sequences in the raw data obtained from IP and input samples to obtain clean data in the fastq format [Citation17]. The remaining reads were then aligned with the human Ensemble genome GRCh38 (the mouse Ensemble genome GRCm38) using the Hisat2 [Citation18] aligner (v2.1.0) under the parameter: ‘–rna-strandness-rf.’ m6A peaks were identified using exomePeak [Citation19] R package (v2.13.2) under parameters: ‘PEAK_CUTOFF_PVALUE = 0.05, PEAK_CUTOFF_FDR=NA, FRAGMENT_LENGTH = 200.’ Differential m6A peaks were identified using exomePeak [Citation19] R package under parameters: ‘PEAK_CUTOFF_PVALUE = 0.05, PEAK_CUTOFF_FDR=NA, FRAGMENT_LENGTH = 200.’ m6A-RNA-related genomic features were visualized using Guitar R package (v1.16.0). The HOMER software (v4.10.4) selected the identified m6A peaks with P-value <0.05 for de novo motif analysis under parameters: ‘-len 6 -rna.’ Motifs of m6A peaks were analysed using the HOMER (http://homer.ucsd.edu/homer/motif) software [Citation20]. FeatureCounts (v1.6.3) was used to count reads for the mapped genome. Differential gene expression analysis was screened at thresholds of P ≤0.05 and |log2FC| ≥ 1 using the DESeq2 R package [Citation21].
The target genes of lncRNAs are predicted by cis-targets and trans-targets. Generally, the transcribed genes within 100kb near the upstream and downstream of lncRNAs are considered cis-regulated target genes [Citation22]. Trans-regulated target genes are transcriptome genes far from lncRNAs, but correlated with them [Citation23]. Pearson correlation analysis was used to predict trans-target genes; when the |r| ≥ 0.95, P ≤0.01, it was considered a trans-regulated target gene.
GO and KEGG analyses
Differential genes were obtained according to the screening threshold P ≤0.05, |log2FC| ≥ 1. These differential genes were then analysed using Gene Ontology (GO, http://www.geneontology.org/) and Kyoto Encyclopedia of Genes and Genomes (KEGG, http://www.kegg.jp/). All analyses were performed using the clusterProfiler R package (v3.6.0), and the top ten or twenty were screened by P-value or enrichment and displayed graphically.
Validation of elongation- and ligation-based qPCR amplification method
The Elongation- and Ligation-Based qPCR Amplification Method (SELECT) was able to detect site-specific m6A expression levels, as described previously [Citation24]. SELECT-PCR was performed using Epi-SELECTTM m6A site identification kit (Guangzhou Epistasis Biotechnology Co., Ltd.). Briefly, total RNA (2ug) was reverse transcribed into cDNA and then configured into first strand cDNA reaction buffer. The qPCR quantification was performed according to gene-specific primers to control the initial RNA amount of the control and experimental groups. The total RNA was then combined with 2ul dNTP, 2ul 10× Reaction Buffer, and 1.6ul 1umol/L up and down primer to configure a 17ul reaction system and annealed at the following temperatures: 90°C for 1 min, 80°C for 1 min, 70°C for 1 min, 60°C for 1 min, 50°C for 1 min, and 40°C for 6 minutes. Subsequently, 0.3ul SELECTTM DNA polymerase, 0.47ul SELECTTM ligase and 2.23ul ATP were added, incubated at 40°C for 20 minutes and denatured at 80°C for 20 minutes. Then 1ul of the product was taken for RT-qPCR.
Oligonucleotide transfection
The siRNA targeting sequences against ADIRF-AS1 and AL139035.1 were designed and chemically synthesized by Guangzhou Ruibo Biotechnology Co. The siRNA-1, siRNA-2, siRNA-3 and si-NC sequences were transfected into cells using Lipofectamine 3000 (Invitrogen) when confluency reached about 90% after inoculating cells into 6-well plates for hours according to the manufacturer’s instructions. Subsequently, the knockdown efficiency was detected by RT-qPCR.
Reverse transcription-quantitative PCR (RT-qPCR)
RT-qPCR was performed by using the Verso SYBR Green 1-Step RT-qPCR Low ROX Kit (ThermoFisher Scientific) from 1ng m6A IP RNA and input RNA as the template. The RNA expression was determined by the number of amplification cycles (Cq). The relative enrichment of m6A was calculated by normalizing the Cq value of the m6A-IP portion to the corresponding input portion: %Input = 2^(Cq of the target gene in the IP sample − Cq of the target gene in the input sample) [Citation25].
MeRIP-qPCR
Based on the results of MeRIP-seq, we focus on these differentially expressed m6a RNAs. Specific primers were designed for MeRIP-qPCR analysis. Briefly, RNA from Ip samples and Input samples was reverse transcribed to obtain cDNA using the MeRIP RT-qPCR kit (Guangzhou Epistasis Biotechnology Co., Ltd.) according to the manufacturer’s published instructions. qPCR reactions were then performed on RNA from input, m6A-IP, and IgG-IP using the designed primers and the corresponding CT values were calculated.
Cell viability assay
We used the Cell Counting Kit-8 (Suzhou Euclid Bio-technology Co.) to test the proliferative capacity of si-ADIRF-AS1 cells and si-AL139035.1 cells. Cell suspensions were prepared and cultured in 96-well plates with approximately 10,000 cells per well for the proliferative capacity assay. Cells were then incubated at 37°C and 5% CO2. At 24, 48 and 72 hours, 10 μl of CCK-8 solution was added to each well and the optical density value of the supernatant was measured.
Invasion and migration assays
We assayed the migration and invasion ability of cells by transwell chambers (Corning Incorporated, USA). The transwell chamber is placed into a 24-well culture plate, which is called the upper chamber and the culture plate is called the lower chamber. The upper chamber was inoculated with serum-free medium 10,000 cells/well. For invasion assay, it is coated with Matrigel(Solarbio, Beijing) basement membrane substrate. For the lower chamber, complete medium containing 10% foetal bovine serum was put in as a chemoattractant. After 24 hours of incubation, the residual cells on the membrane were removed with a cotton swab, and the cells on the undersurface of the membrane were migrated and invaded.4% paraformaldehyde was fixed, and then 0.1% crystal violet was stained and photographed under a fluorescence microscope.
Statistical analysis
The difference of the experimental data was tested by chi-square test or ANOVA. The data visualization was performed on the GraphPad Prism 9.2.0 software (GraphPad Software, San Diego, California USA, www.graphpad.com). The lncRNA-mRNA regulatory network was constructed using Cytoscape Version 3.9.1 software. P ≤ 0.05 was considered statistically significant.
Results
Sequencing data and general features of m6A methylation in 5-FU resistant cells
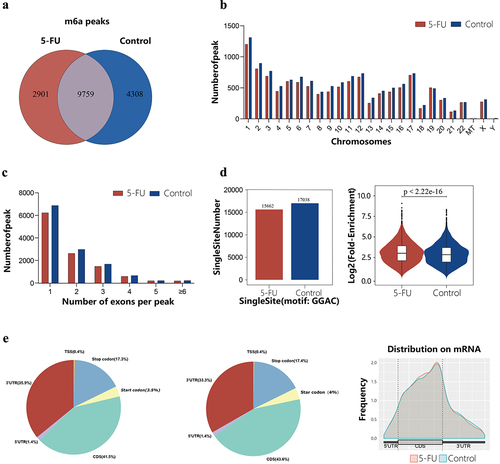
After filtering out low-quality data, we obtained 39,991,733 to 51,762,936 clean reads from the MeRIP-seq data generated from IP and input samples (Supplementary Table S1). The average quality score for all samples was between 33.39 and 36.49 (Supplementary Table S2). Approximately 60% of the clean reads aligned to the human reference genome sequence, of which over 40% were uniquely mapped to the human reference genome (Supplementary Table S3). MeRIP-seq results showed 12,660 m6A peaks in the 5-FU group and 14,067 in the control group. The number of common peaks between the two groups was 9,759. Uniquely modified m6A peaks in the 5-FU and the control groups were 2,901 and 4,308, respectively. The number of common peaks only accounted for 57.5% of all peaks in both groups. The low percentage of common peaks and the reduced number of uniquely modified peaks suggest that there may be differences in m6A modification patterns between the two groups (). Most m6A methylation sites in the two groups were in chromosomes 1, 2, 3, 12, and 17 (). Further analysis, uncovered that most m6A peaks spanned only one exon, accounting for 54.5% and 54% of the m6A peaks in the 5-FU and the control group, respectively. The number of m6A peaks with more than 6 exons was only 1.9% in both groups (). Single-base site analysis was performed on these m6A peaks to find the position of the ‘GGAC’ sequence in the peak region. The exact position and number of m6A modifications in a peak region were reflected by the number of ‘GGAC’ sequences. The 5-FU group had15,662 m6A sites containing the ‘GGAC’ sequence in 7,274 m6A peaks; while 17,038 m6A sites contained the ‘GGAC’ sequence in 8,010 m6A peaks in the control group. The average log-fold enrichment of peaks containing single-base sites was 3.08 in the 5-FU group and 2.91 in the control group ().
Figure 1. General characteristics of RNA m6A methylation. (a) Venn diagram showing the number of shared and unique m6A peaks in the two groups. (b) Chromosomal distribution of m6A peaks in both groups. (c) Number distribution of m6A peaks spanning different exon numbers in the two groups. (d) The number of single-base sites and the average log2 fold enrichment of single-base site peaks in the 5-fu group and the control group. (e) The positional distribution of m6A peaks on functional elements of genes in the two groups.
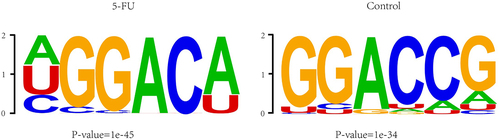
To further understand the distribution of these m6A peaks on transcripts, we divided the transcripts into 3’UTR, TSS, start codon, CDS, stop codon, and 5’UTR regions. We found that the m6A peaks on mRNA were mainly concentrated in the vicinity of the CDS near the 3’UTR region. Further, the peak density map confirmed the same finding (). In addition, we used HOMER software to find a reliable RRACH motif in the m6A peak region, which was consistent with the typical conserved sequence motif of m6A (). Subsequently, we randomly selected three genes to display the m6A methylation pattern, and the peak regions are shown in Supplementary Table S4.
Figure 2. Conserved sequence motifs of m6A peaks between 5fu and control groups.
Differential peak analysis between drug-resistant cells and control cells
To explore the role of m6A methylation in drug resistance, we compared the methylation levels of drug-resistant and typical CRC cells. Compared with the control group, 3,698 differential m6A peaks were identified, of which 60.1% of the m6A peaks showed high and 39.9% showed low methylation levels, as shown in the m6A modification differential volcano plot (). shows the top ten m6A modification peaks that were significantly modified. The distribution of these peaks on the gene structure is depicted in the figure (). We then determined the enrichment level of differentially methylated m6A peaks on each chromosome and found that the highest proportion of hypermethylation was mainly on chromosome 22 (69.9%), chromosome 13 (64.8%), chromosome 17 (64.7%) and Chromosome 3 (64.5%, ). Analysis of the differentially methylated m6A peaks spanning exons showed 1,601 m6A peaks spanning one exon, of which hypermethylation accounted for 57.7%, and as the number of spanning exons increased, the proportion of hypermethylation increased ().
Figure 3. Overview of the differentially methylated m6A peaks landscape in the 5fu and control samples. (a) The differentially m6A modification volcano plot showing distinct m6A peaks and their statistical significance. (b) Pie charts displaying the positional distribution of the differentially methylated m6A peaks on functional elements of genes. (c) Distribution of the differentially methylated m6A peaks on chromosomes. (d) Number distribution of the differentially methylated m6A peaks spanning different exon numbers. (e) The number of single-base sites and m6A peaks in upregulated and downregulated m6A peaks. (f) The average log2 fold enrichment of the differentially methylated m6A peaks. (g) The distribution of p-value of the differentially methylated m6A peaks.
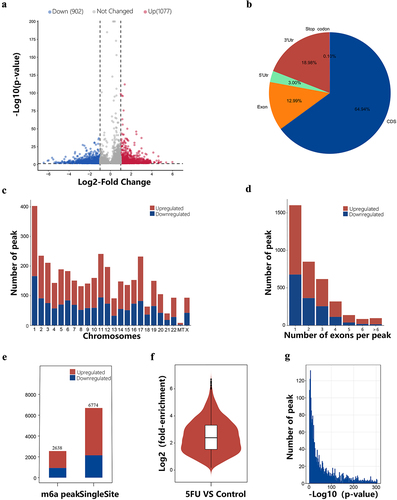
Table 1. The top ten significantly up- regulated or down-regulated m6A modified peaks.
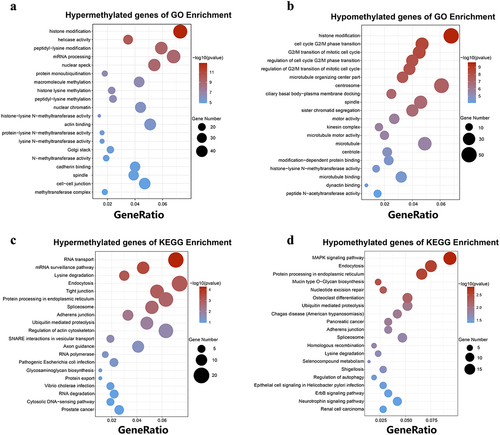
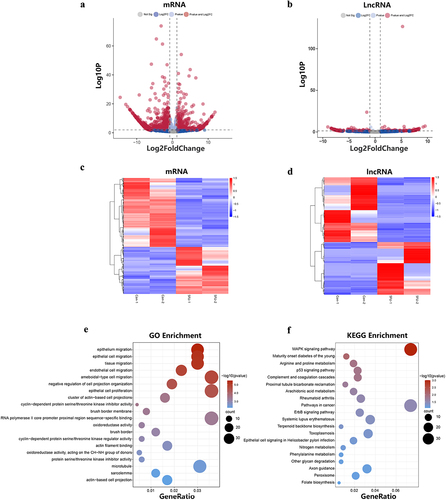
Single-base site analysis was performed in these differential m6A peaks to find the position of the ‘GGAC’ sequence. Among the 3,698 differential m6A peaks, 2,638 m6A peaks were identified with single-base sites, containing 6,774 sites, of which 4,585 were upregulated and 2,189 were downregulated. Among the 2,638 m6A peaks, 1,669 were upregulated and 969 were downregulated. (). The average log-fold enrichment of these peaks was 2.50, and the P-value distribution is shown in the graphics (). To further understand the physiological function of these differentially methylated m6A peaks, we screened peaks with significant differences (the screening threshold was P ≤0.05 and |log2FC| ≥ 1). We then divided these differentially methylated m6A genes into hypermethylated and hypomethylated genes and performed GO and KEGG pathway analyses. The significantly enriched GO terms for hypermethylated m6A genes included histone modification, mRNA processing, peptidyl lysine modification, actin binding, nuclear speckles, actin cytoskeleton, and nuclear chromatin (). Hypomethylated m6A genes were mainly enriched in histone modifications, regulation of mitotic cell cycle phase transition, tubulin binding, cell centroids body, microtubule, and spindle (, Supplementary Table S5). KEGG pathway analysis revealed that the major pathways associated with hypermethylated m6A genes were endocytosis, RNA transport, protein processing in the endoplasmic reticulum, and regulation of the actin cytoskeleton. For hypomethylated m6A genes, the most relevant pathways were MAPK signalling pathway, endocytosis, and protein processing in the endoplasmic reticulum (, Supplementary Table S6).
Figure 4. GO function and KEGG pathway enrichment of hyper-methylated and hypo-methylated mRnas. (a) The top 20 GO terms of genes with upregulated m6A peaks. (b) The top 20 GO terms of genes with downregulated m6A peaks. (c) The top 20 KEGG pathways of genes with upregulated m6A peaks. (d) The top 20 KEGG pathways of genes with downregulated m6A peaks.
The above results show that differentially m6A-modified genes may affect the formation of drug resistance in CRC cells through biological processes, molecular functions, cellular components, and signalling pathways.
Differential expression analysis of mRNA and lncRNA
To explore the differences in gene expression between 5-FU drug-resistant cells and control cells, we analysed the differentially expressed mRNAs and lncRNAs in the drug-resistant and control groups. The differential mRNAs and lncRNAs were plotted in the volcano plots () and heatmaps highlighted the differentially expressed genes between the resistant and control groups (). We screened 1756 differentially expressed mRNAs and 250 differentially expressed lncRNAs using the threshold |log2FC| ≥ 1 and P ≤0.05. Among the 1,756 differentially expressed mRNAs, 711 were upregulated and 1,045 were downregulated compared with the control group. On the other hand, among the 250 differentially expressed lncRNAs, 112 were upregulated and 138 were downregulated. In addition, GO and KEGG pathway analyses were performed for these differentially expressed mRNAs. Our analysis showed that significantly enriched GO terms included tissue migration, epithelial cell migration, and epithelial cell proliferation (). Significantly enriched pathways were MAPK signalling pathway, cancer pathway, ErbB signalling pathway, and p53 signalling pathway ().
Figure 5. The differential expression of lncRnas and mRnas and functional enrichment analysis of mRnas. (a) The differentially expressed lncRnas in the 5FU group and control group. (b) The differentially expression of mRnas in the 5FU group and control group. (c) Hierarchical cluster analysis of differentially expressed mRnas genes. (d) Hierarchical cluster analysis of differentially expressed lncRnas genes. (e) GO enrichment analysis of differentially expressed mRnas. (f) KEGG pathways enrichment analysis of differentially expressed mRnas.
Integrated analysis of MeRIP-seq and RNA-seq data
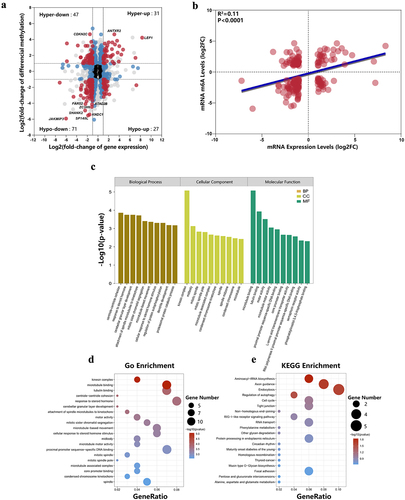
To further investigate the effect of m6A-modified RNA on 5-FU-induced CRC cells, we performed a combined analysis of MeRIP-seq and RNA-seq data. We found a significant change in the m6A levels and expression levels of 176 mRNAs (|log2FC| ≥ 1 and P ≤0.05, Supplementary Table S7). Among these, 31 mRNAs showed upregulation, and 71 showed downregulation of both levels. Furthermore, 47 mRNAs had downregulated expression levels and upregulated m6A levels, while 27 genes had upregulated expression and downregulated m6A levels. The relationship between mRNA expression and m6A methylation is shown in a four-quadrant plot, and the top ten genes with the most significant m6A methylation differences were annotated (). To understand the relationship between m6A methylation levels and expression levels of these mRNAs, we performed Pearson correlation analysis. We found that the expression levels of these mRNAs positively correlated with their methylation levels (R2 = 0.11, P < 0.0001, ). Lastly, GO/KEGG analysis was performed on mRNAs with significant differences in m6A methylation and transcription levels. Our analysis revealed significantly enriched GO terms such as microtubule binding, kinesin complexes, response to steroid hormones, and proximal promoter sequence-specific DNA binding (). In the KEGG analysis, significantly enriched pathways included aminoacyl-tRNA biosynthesis, axon guidance, endocytosis, and autophagy regulation (, Supplementary Table S8). We found that significantly different LEF1 genes were enriched in multiple cancer-related pathways, including thyroid cancer, endometrial cancer, wnt signalling pathway, basal cell carcinoma, acute myeloid leukaemia, CRC, cancer pathways, and prostate cancer.
Figure 6. Integrated analysis of m6A methylation and mRNA expression. (a) Four quadrant diagram showing differentially methylated and differentially expressed RNAs. (b) The RNA expression level was positively correlated with the methylation level (R2 = 0.11, p < 0.0001). (c) The top 10 statistically significant GO enrichment analysis terms. (d) GO enrichment analysis of mRnas with both differential methylation and expression. (e) KEGG pathways enrichment analysis of mRnas with both differential methylation and expression.
lncRNA analysis of differential m6A methylation
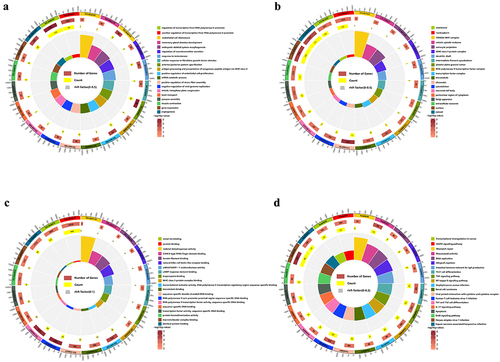
The relationship between lncRNA methylation and RNA expression is still debatable and worth investigating. Among all genes with m6A peaks, we screened 97 lncRNAs with significantly different m6A methylation with a screening threshold of P ≤ 0.05 and |log2FC| ≥ 1. We calculated the Pearson correlation coefficient by matching the expression profiles of lncRNA and mRNA (|Pearson correlation coefficient| ≥ 0.95 and P ≤ 0.01) to predict the correlation between lncRNA and mRNA, and identify trans-target genes. We also explored codable RNAs within 100 kb upstream and downstream of these lncRNAs as cis-predictor genes. We found 892 mRNAs associated with at least one of the 97 lncRNAs (Supplementary Table S9).
Subsequently, GO/KEGG analysis was performed on these mRNAs. We found that 173 GO items were significantly enriched in biological processes (), 56 in cellular components () and 52 in molecular functions (). The target genes were mainly enriched in GO terms related to transcriptional regulation and metabolism of RNA, such as RNA polymerase II promoter transcriptional regulation, RNA polymerase II transcription factor activity, and positive regulation of sequence-specific DNA binding to endothelial cells proliferation, angiogenesis, and response to testosterone. The KEGG pathway analysis revealed 24 significantly enriched pathways (), especially in rheumatoid arthritis, herpes simplex virus type 1 infection, the interaction of viral proteins with cytokines and cytokine receptors, NF-kB signalling pathway, TNF signalling pathway, and MAPK signalling pathway (Supplementary Table S10).
Figure 7. Enrichment analysis of target genes with differentially m6A methylated lncRnas. (a) GO biological processes enrichment analysis. (b) GO cellular component enrichment analysis. (c) GO molecular function enrichment analysis. (d) KEGG enrichment analysis.
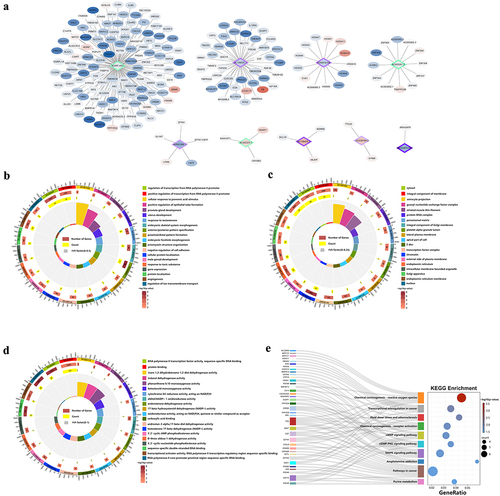
To further explore the effect of m6A-modified lncRNA on the 5-FU-resistant cells, we combined MeRIP-seq and RNA-seq data to screen out 9 lncRNAs with significant differences in m6A modification levels and transcription levels. Their target genes were predicted using the screening threshold of P ≤0.05 and |log2FC| ≥ 1and the lncRNA-mRNA network was constructed (). To understand the function of target genes, we performed GO/KEGG analysis. GO analysis revealed that 65 GO terms were significantly enriched in biological processes (), 16 GO terms were significantly enriched in cellular components (), and 24 GO terms were significantly enriched in molecular functions (), especially in RNA polymerase II promoter transcriptional regulation, angiogenesis, and response to testosterone. In the KEGG pathway analysis, we found 14 significantly enriched pathways (), of which chemical oncogenic-reactive oxygen species, transcriptional dysregulation in cancer, and MAPK signalling pathways were the most relevant ones (Supplementary Table S11).
Figure 8. Integrated analysis of lncRnas in the RNA-seq and MeRIP-seq data. (a) The network of lncRNA-mRNA regulation, the circle represents mRNA and the diamond represents lncRnas with both differential methylation and expression, red means high expression and blue means low expression, purple means high methylation and green means low methylation. (b) GO biological processes enrichment analysis. (c) GO cellular component enrichment analysis. (d) GO molecular function enrichment analysis. (e) KEGG enrichment analysis.
Validation of differentially m6a methylated lncRnas and mRnas
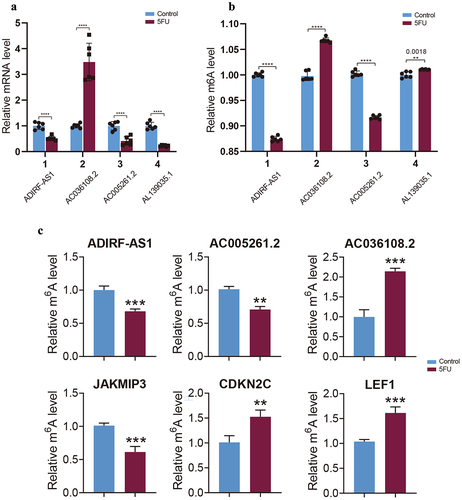
To validate the reliability and reproducibility of the sequencing data, we selected several m6a-modified differential lncrna and mRNAs for RT-qPCR, SELECT-PCR and Merip-qPCR analysis. We used RT-qPCR to detect their expression changes and SELECT-PCR and Merip-qPCR to detect the expression changes of m6a modification sites. The primer information required to perform experiments with these lncRNAs and mRNAs is available in Supplementary files (Supplementary Table S12 and S13). The results showed that the expression levels of ADIRF-AS1, AC005261.2 and AL139035.1 in RT-qPCR were lower than those of the control group, while the expression level of AC036108.2 was higher than that of the control group (). In SELECT-PCR, after the induction of drug resistance, the abundance of m6a modification of ADIRF-AS1 and AC005261.2 was lower than that of the control group, whereas the abundance of m6a modification of AC036108.2 and AL139035.1 was higher than that of the control group (). The results of Merip-qPCR were also consistent. The m6a expression levels of lncRNAs ADIRF-AS1 and AC005261.2 were decreased in the drug-resistant group, whereas those of AC036108.2 were increased. mRNAs CDKN2C and LEF1m6a expression levels were increased, whereas the m6a modification level of JAKMIP3 was decreased (). RT-qPCR, SELECT-PCR and Merip-qPCR validation results were consistent with our sequencing results, indicating the reliability of our sequencing data.
Figure 9. Validation of MeRIP-seq and RNA-seq. (a) RT-qPCR validation of four lncRnas. (b) SELECT-PCR validation of four lncRnas. (c) MeRIP-qPCR validation of three m6A-modified lncRnas and mRnas.
Knockdown of lncRNA ADIRF-AS1 and AL139035.1 promotes CRC proliferation and invasion
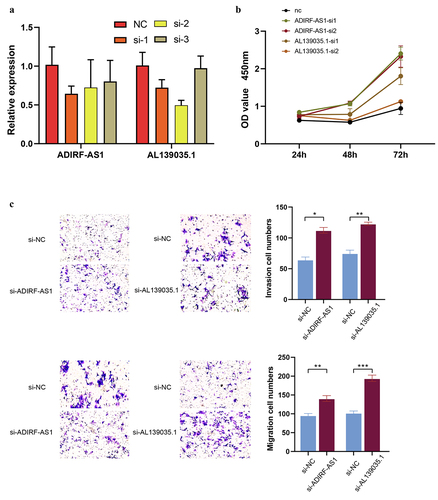
To explore the role of differential m6a-modified lncRNAs in CRC progression, we constructed HCT15 cell lines silencing lncRNA ADIRF-AS1 and AL139035.1 using siRNA. Subsequently, RT-qPCR was performed to verify the knockdown efficiency (). The results showed that both si1 and 2 constructs of ADIRF-AS1 and AL139035.1 effectively reduced their expression in the HCT15 cell line, so we selected these cells for the next experiments. Subsequently, we performed in vitro proliferation experiments with si-ADIRF-AS1 and si-AL139035.1. CCK8 experiments showed that knockdown of ADIRF-AS1 and AL139035.1 significantly enhanced cell growth compared to control cells (). Further results from Transwell experiments demonstrated that the cell growth of HCT15 cells was significantly enhanced when inhibiting the expression of ADIRF-AS1 and AL139035.1 expression, the invasive and migratory abilities of cells were enhanced relative to controls (). These results suggest that decreased expression of lncRNA ADIRF-AS1 and AL139035.1 May promote CRC metastasis and progression.
Figure 10. Knockdown of lncRNA ADIRF-AS1 and AL139035.1 promoted CRC proliferation and invasive metastasis in vitro. (a) Validation of siRNA knockdown inefficiency. (b) Knockdown of ADIRF-AS1 and AL139035.1 promotes CRC proliferation in vitro (c) knockdown of ADIRF-AS1 and AL139035.1 promotes CRC invasion and migration.
Discussion
The emergence of tumour drug resistance has limited the effectiveness of treatment for most tumours, including CRC. Therefore, drug resistance remains one of the major obstacles leading to low survival rates in patients with CRC. As the most common RNA modification in higher eukaryotes, m6A modification is an emerging hot area of epigenetic research [Citation26]. Recent studies have shown that m6A modification plays a crucial role in the occurrence and development of CRC [Citation27]; however, the association between m6A modification and drug resistance in CRC is still unclear. In this study, we obtained a panoramic overview of m6A modification in drug-resistant and control cells using MeRIP-seq and RNA-seq. We analysed the function of mRNAs and lncRNAs with m6A modification, which could provide a reference for understanding m6A modification in tumour drug resistance and contribute to the development of new therapeutic strategies.
Our data showed that the total m6A peaks and the uniquely modified peaks were reduced in the drug-resistant group compared to the control group, with the number of shared peaks accounting for 57.5% of all peaks in both groups. The pattern of m6A modification in cells was altered after the development of drug resistance with a reduction in the level of m6A modification in total RNA, suggesting that m6A methylation might be involved in the formation of 5-FU resistance in HCT15 cells. Differences in the level of m6A modifications have been reported in many diseases. Zhou et al. demonstrated an increase in the percentage of m6A-modified mRNA in aortic coarctation tissue samples relative to healthy aortic samples [Citation28]. Li et al. found that 4,537 new peaks appeared, and 1,236 peaks disappeared in the human bladder cancer tissues compared to normal tissues, indicating a significantly different overall m6A modification pattern between the two groups [Citation29]. Consistent with previous studies, our findings showed that the m6A peak were mainly enriched in the CDS proximal 3’UTR region [Citation30]. m6A is widely conserved in eukaryotes and often appears in RRACH-concordant sequences [Citation31]. The conserved characteristic peak of the zebrafish m6A methylation group is preferentially distributed near the termination codon with the RRACH motif [Citation32]. Motif analysis of the peaks within the highest scoring mRNAs revealed the presence of the consistent GGAC sequence in the three replicates from the neuromyelitis optica spectrum disorders and healthy groups [Citation33]. In round spermatocytes (RO), 10271 m6A peaks associated with 10,109 genes were identified from wild-type mice, and 9,559 m6A peaks associated with 10,138 genes were identified from m6A eraser Alkbh5 knockout mice, with peaks concentrated in the coding region of the GGAC motif and the stop codon [Citation34]. Here, the m6A modification was enriched in GGACA and GGACC in the drug-resistant and control groups, respectively, similar to the reported results.
To explore the function of m6A-modified RNAs in drug-resistant cells, functional enrichment analysis was performed on differentially m6A-methylated genes. KEGG pathway analysis revealed that both hypermethylated and hypomethylated genes were significantly enriched in endocytosis. Endocytosis has been shown to be associated with drug resistance. N-myc downstream regulator gene 1 (NDRG1) is a key regulator that interacts with many classical tumour signalling pathways. NDRG1 enhances the sensitivity of CRC cell lines to cetuximab by inhibiting the expression and distribution of EGFR. At the same time, the knockdown of NDRG1 significantly reduces the sensitivity of cetuximab in vivo by upregulating Cav1 to promote endocytosis and degradation of EGFR [Citation35]. In addition, cellular endocytosis was significantly enriched in our combined analysis of MeRIP-seq and RNA-seq data. These results suggest that m6A modification may modulate the resistance of HCT15 to 5-FU by regulating endocytosis.
Based on the combined analysis of MeRIP-seq and RNA-seq data, we identified 176 RNAs that differed in both m6A methylation and transcriptional levels. KEGG pathway analysis revealed that these significantly different RNAs were mainly enriched in aminoacyl-tRNA biosynthesis, axon guidance, endocytosis, and autophagy regulation.
Axon guidance is receiving increasing attention in recent years. Some typical axon guidance molecules include semaphorins, ephrins, and netrins [Citation36]. In the axon guidance pathway of KEGG, we identified the typical axon guidance molecule EPHB4 and the signalling receptors NRP1 and PLXNA2. Silencing of semaphorin 4D (SEMA4D) improves chemosensitivity to 5-FU in patients with CRC through multiple pathways, including apoptosis, EMT, and Wnt/β-catenin [Citation37] EphB4 knockdown restores sensitivity to imatinib in chronic myeloid leukaemia in vitro and in vivo [Citation38]. miR‑214 can target netrin‑1 in bladder cancer cell lines to reduce chemoresistance [Citation39]. In addition, receptors that bind to semaphorins are also involved in semaphorin signal transduction and can affect the nature of cellular responses to semaphorins. NRP1 and PLXNA2 are in focus here. In pancreatic cancer, NRP1 overexpression provides a survival advantage to pancreatic cancer cells exposed to gemcitabine or 5-FU [Citation40]. Till now, no reports have shown the role of PLXNA2 in drug resistance. However, in our sequencing results, the expression of SEMA4D, EPHB4, NRP1, and PLXNA2 was higher in the drug-resistant group than in the control group. Moreover, the methylation levels of SEMA4D and EPHB4 were significantly downregulated, while the methylation levels of NRP1 and PLXNA2 were significantly upregulated in the drug-resistant group. These results suggest that SEMA4D, EPHB4, NRP1, and PLXNA2 might be involved in the 5-FU resistance in CRC by m6A modification. Further investigation is needed to confirm our preliminary results and understand the mechanism of axon guidance molecules regulating drug resistance in CRC.
Aminoacyl-tRNA biosynthesis is associated with many cancers, and the increased translational demand of genes in tumour cells leads to a high of aminoacyl-tRNA synthetase (ARS) in tumour cells [Citation41]. In addition to its typical role in protein synthesis, it is also involved in RNA splicing, transcriptional regulation, translation and cell homoeostasis, and other aspects of chemotherapy resistance [Citation42]. In metabolomic and transcriptomic analyses of drug-sensitive A549 cells and cisplatin-resistant A549/DDP cells, some of these metabolic pathways were significantly associated with cisplatin resistance, including amyl-tRNA biosynthesis [Citation43]. The results of our data also report that the differentially expressed m6A genes were enriched in aminoacyl-tRNA biosynthesis. Although this pathway is relatively rare in drug resistance studies, it deserves more attention.
Increasing evidence suggests that autophagy plays a vital role in tumour progression and drug resistance. New therapeutic approaches to modulate autophagy represent a new direction for cancer therapies that may help prevent tumour progression and overcome drug resistance [Citation44]. Lin et al. f ound that the ATF4-mediated microRNA-145/HDAC4/p53 axis could affect CRC cell resistance to 5-FU by regulating autophagy [Citation45]. Chaperone-mediated autophagy (CAM) is a highly selective form of autophagy, and researchers found that it could inhibit the growth and metastasis of CRC cells and increased sensitivity to 5-FU [Citation46]. We hypothesize that autophagy-related genes might be regulated and influence their expression through m6A and play a role in drug resistance in CRC.
Notably, in the combined analysis, we identified significantly differentially expressed LEF1 genes enriched in multiple cancer-related pathways, including CRC. Lymphoid enhancer factor (LEF1) is a member of the TCF/LEF transcription family and is mainly involved in the Wnt/β-catenin signalling pathway. Recently, it was reported that abnormal expression of LEF1 was significantly associated with drug resistance in cancer cells. Inhibition of the 50 kd isoform of LEF1 increases the sensitivity of CRC cell lines SW480 and HCT116 to oxaliplatin and 5-FU [Citation47]. Clonidine is an anthelmintic drug that has been used in various disease models. Clonidine blocks the transcription of DCLK1-B by interrupting the binding of LEF1 to the DCLK1-B (dicortin-like kinase 1) promoter. LEF1 is the target molecule of clonidine, which maintains cancer cell stemness, and LEF1, in turn, targets DCLK1-B and affects CRC cell stemness, making it sensitive to chemotherapy [Citation48]. This study showed that LEF1 expression and m6A methylation level were significantly upregulated. Therefore, we conclude that the expression of LEF1 might be regulated by its m6A modification and that high expression of LEF1 in drug-resistant tissues might be involved in 5-FU resistance in CRC. However, the specific molecular mechanism remains unclear, and requires further exploration.
The role of m6A-modified lncRNAs and their target genes in drug-resistant CRC has not been reported yet. In this study, we performed functional enrichment analysis on the target genes of differentially m6A-modified lncRNAs and the target genes of lncRNAs in the combined analysis. We found that transcriptional regulatory modifications of RNA were always significantly enriched, and the MAPK signalling pathway in the KEGG pathway was always present. Based on the above findings, we speculated that these lncRNAs were up or downregulated due to the alteration of their m6A modification levels, which then alter the levels of their target genes to regulate the transcription of related mRNAs through the MAPK signalling pathway and, thus, involved in the resistance of CRC cells to 5-FU. Previous reports have suggested that the MAPK signalling pathway is associated with 5-FU resistance in CRC. Zhang et al. found that TIMP-2 can regulate 5-FU resistance in CRC through the ERK/MAPK signalling pathway [Citation49]. In addition, Liu et al. found that m6A modification-mediated DUXAP8 could act as a molecular sponge to regulate MAPK1 expression by competitively binding to miR-584-5p, which in turn activates the MAPK/ERK pathway to regulate the chemoresistance of hepatocellular carcinoma to sorafenib [Citation50].
We selected representative target genes with differential expression from the MAPK signalling pathway (FOS, DUSP1, MEF2C) and reviewed their roles in drug resistance. The target gene FOS is a constituent transcription factor activator protein-1 (AP-1), which is involved in cell proliferation, migration, survival, and chemoresistance [Citation51]. Overexpression of FOS induces epithelial-mesenchymal transition (EMT) in CRC cells and promotes its malignant progression. FOS is also involved in cellular multidrug resistance, and Zhu et al. identified FOS as a potential target for regulating the sensitivity of ovarian cancer cells to paclitaxel [Citation52,Citation53]. Dual Specific Phosphatase (DUSP) is a key player in cell growth, survival, and death and is associated with chemoresistance in many cancers [Citation54–56]. During tyrosine kinase inhibitor (TKI) therapy, Fos and Dusp1 levels could determine the threshold of TKI efficacy, whose high expression level can confer intrinsic resistance to TKI therapy in leukaemia [Citation57]. MEF2C is a member of the myocyte enhancer factor 2 (MEF2) family; inhibiting its expression in hepatocellular carcinoma cells could enhance spheroid formation and make the cells resistant to 5-FU-induced cell death [Citation58]. Our sequencing results showed that FOS and DUSP1 expression was downregulated, while MEF2C expression was upregulated after 5-FU treatment, which may be related to tissue specificity and functional differences. Furthermore, in the lncRNA-mRNA network, we found that FOS was associated with the lncRNA ADIRF-AS1 and DUSP1 was the target gene of the lncRNA AL139035.1. Moreover, the m6a-modified lncRNAs ADIRF-AS1 and AL139035.1 May be one of the key regulatory molecules involved in the promotion of CRC progression and the formation of resistance to 5-FU by regulating the expression of genes associated with the MAPK signalling pathway. Based on the above speculations, we performed in vitro experiments with the lncRNAs ADIRF-AS1 and AL139035.1. This concept was further validated by knocking down their expression and finding that the lncRNAs ADIRF-AS1 and AL139035.1 were able to promote the proliferation and migratory invasive ability of CRC.
Conclusions
In summary, we presented the first m6A methylation profile of CRC cells involved in 5-FU resistance and analysed the function of differentially m6A-modified mRNAs and lncRNAs. Our results demonstrated that after induction of 5-FU resistance, differential m6A RNAs were significantly associated with the MAPK signalling pathway and endocytosis. Moreover, knockdown of lncRNA ADIRF-AS1 and AL139035.1 promoted CRC proliferation and invasive metastasis in vitro. lncRNA- mRNA network showed that ADIRF-AS1 and AL139035.1 May play a key role in regulating drug resistance formation. In conclusion, our findings have important implications for further understanding the formation of lncRNA in CRC progression and 5-FU drug resistance response, as well as providing a new direction for exploring therapeutic targets for 5-FU chemoresistance in CRC.
Author contributions
JL, ZZ, HL, and SM participated in the conception and design of this study; JL, XS, HL, and XN performed the bioinformatics analyses; JL, XS, HL, HY, and XN interpreted the data analyses and integrated them numerically; JL, HY, KH, and HL performed the manipulations involved in the cellular function experiments; and JL wrote the paper based on the suggestions of HL, KH, and SM. All authors contributed to the article and approved the submitted version.
Supplementary Table 5.xlsx
Download MS Excel (957.3 KB)Supplementary Table 10.xlsx
Download MS Excel (61.8 KB)Supplementary Table 7.xlsx
Download MS Excel (56.1 KB)Supplementary Table 9.xlsx
Download MS Excel (103.7 KB)Supplementary Table 11.xlsx
Download MS Excel (27.3 KB)Supplementary Table 3.docx
Download MS Word (18.5 KB)Supplementary Table 2.xlsx
Download MS Excel (21.5 KB)Supplementary Table 1.docx
Download MS Word (17.3 KB)Supplementary Table 8.xlsx
Download MS Excel (270.5 KB)Supplementary Table 6.xlsx
Download MS Excel (38.5 KB)Supplementary Table 13.xlsx
Download MS Excel (14.3 KB)Supplementary Table 12.docx
Download MS Word (15.9 KB)Supplementary Table 4.docx
Download MS Word (166.7 KB)Acknowledgments
The authors thank all the doctors of the Department of Gastrointestinal Surgery of the Second Affiliated Hospital of Nanchang University and Department of Gastrointestinal Surgery of Pingxiang People’s Hospital.
Disclosure statement
No potential conflict of interest was reported by the author(s).
Data availability statement
The authors confirm that the data supporting the findings of this study are available within the article. The sequencing data can be accessed in the NCBI SRA (Sequence Read Achieve) database at https://www.ncbi.nlm.nih.gov/sra/PRJNA923388.
Supplementary material
Supplemental data for this article can be accessed online at https://doi.org/10.1080/15592294.2023.2298058.
Additional information
Funding
References
- Dekker E, Tanis PJ, Vleugels JLA, et al. Colorectal cancer. Lancet. 2019;10207(394):1467–22. doi: 10.1016/S0140-6736(19)32319-0
- Vodenkova S, Buchler T, Cervena K, et al. 5-fluorouracil and other fluoropyrimidines in colorectal cancer: Past, present and future. Pharmacol Ther. 2020;206:107447. doi: 10.1016/j.pharmthera.2019.107447
- Liu R, Chen Y, Liu G, et al. PI3K/AKT pathway as a key link modulates the multidrug resistance of cancers. Cell Death Dis. 2020;9(11):797. doi: 10.1038/s41419-020-02998-6
- Shen Y, Tong M, Liang Q, et al. Epigenomics alternations and dynamic transcriptional changes in responses to 5-fluorouracil stimulation reveal mechanisms of acquired drug resistance of colorectal cancer cells. Pharmacogenomics J. 2018;1(18):23–28. doi: 10.1038/tpj.2016.91
- Hasan Abdali M, Afshar S, Sedighi Pashaki A, et al. Investigating the effect of radiosensitizer for ursolic acid and kamolonol acetate on HCT-116 cell line. Bioorg Med Chem. 2020;1(28):115152. doi: 10.1016/j.bmc.2019.115152
- Crea F, Nobili S, Paolicchi E, et al. Epigenetics and chemoresistance in colorectal cancer: an opportunity for treatment tailoring and novel therapeutic strategies. Drug resistance updates: reviews and commentaries in antimicrobial and anticancer chemotherapy. Drug Resist Updat. 2011;6(6):280–296. doi: 10.1016/j.drup.2011.08.001
- Blondy S, David V, Verdier M, et al. 5-fluorouracil resistance mechanisms in colorectal cancer: from classical pathways to promising processes. Cancer Sci. 2020;9(111):3142–3154. doi: 10.1111/cas.14532
- Afshar S, Sedighi Pashaki A, Najafi R, et al. Cross-resistance of acquired radioresistant colorectal cancer cell line to gefitinib and regorafenib. Iran J Med Sci. 2020;1(45):50–58.
- Azwar S, Seow HF, Abdullah M, et al. Recent updates on mechanisms of resistance to 5-fluorouracil and reversal strategies in colon cancer treatment. Biology. 2021;10(9):854. doi: 10.3390/biology10090854
- He L, Li H, Wu A, et al. Functions of N6-methyladenosine and its role in cancer. Mol Cancer. 2019;1(18):176. doi: 10.1186/s12943-019-1109-9
- Huang H, Weng H, Chen J. m6A modification in coding and non-coding RNAs: roles and therapeutic implications in cancer. Cancer Cell. 2020;3(37):270–288. doi: 10.1016/j.ccell.2020.02.004
- Kasowitz SD, Ma J, Anderson SJ, et al. Nuclear m6A reader YTHDC1 regulates alternative polyadenylation and splicing during mouse oocyte development. PLoS Genet. 2018;5(14):e1007412. doi: 10.1371/journal.pgen.1007412
- Zhang L, Wan Y, Zhang Z, et al. IGF2BP1 overexpression stabilizes PEG10 mRNA in an m6A-dependent manner and promotes endometrial cancer progression. Theranostics. 2021;3(11):1100–1114. doi: 10.7150/thno.49345
- Chen C, Guo Y, Guo Y, et al. m6A modification in non-coding RNA: the role in cancer drug resistance. Front Oncol. 2021;11:746789. doi: 10.3389/fonc.2021.746789
- Xiong G, Liu C, Yang G, et al. Long noncoding RNA GSTM3TV2 upregulates LAT2 and OLR1 by competitively sponging let-7 to promote gemcitabine resistance in pancreatic cancer. J Hematol Oncol. 2019;1(12):97. doi: 10.1186/s13045-019-0777-7
- Chen Y-T, Xiang D, Zhao X-Y, et al. Upregulation of lncRNA NIFK-AS1 in hepatocellular carcinoma by m6A methylation promotes disease progression and sorafenib resistance. Hum Cell. 2021;6(34):1800–1811. doi: 10.1007/s13577-021-00587-z
- Chen S, Zhou Y, Chen Y, et al. Fastp: an ultra-fast all-in-one FASTQ preprocessor. Bioinformatics. 2018;17(34):i884–i890. doi: 10.1093/bioinformatics/bty560
- Kim D, Langmead B, Salzberg SL. HISAT: a fast spliced aligner with low memory requirements. Nat Methods. 2015;4(12):357–360. doi: 10.1038/nmeth.3317
- Meng J, Lu Z, Liu H, et al. A protocol for RNA methylation differential analysis with MeRIP-Seq data and exomePeak R/Bioconductor package. Methods. 2014;3(69):274–281. doi: 10.1016/j.ymeth.2014.06.008
- Heinz S, Benner C, Spann N, et al. Simple combinations of lineage-determining transcription factors prime cis-regulatory elements required for macrophage and B cell identities. Mol Cell. 2010;4(38):576–589. doi: 10.1016/j.molcel.2010.05.004
- Robinson MD, McCarthy DJ, Smyth GK. edgeR: a Bioconductor package for differential expression analysis of digital gene expression data. Bioinformatics. 2010;1(26):139–140. doi: 10.1093/bioinformatics/btp616
- Derrien T, Guigó R, Johnson R. The long non-coding RNAs: a new (P)layer in the “dark matter”. Front Genet. 2011;2:107. doi: 10.3389/fgene.2011.00107
- Kopp F, Mendell JT. Functional classification and experimental dissection of long noncoding RNAs. Cell. 2018;3(172):393–407. doi: 10.1016/j.cell.2018.01.011
- Xiao Y, Wang Y, Tang Q, et al. An elongation- and ligation-based qPCR Amplification method for the radiolabeling-free detection of locus-specific N6 -methyladenosine modification. Angew Chem Int Ed Engl. 2018;49(57):15995–16000. doi: 10.1002/anie.201807942
- Livak KJ, Schmittgen TD. Analysis of relative gene expression data using real-time quantitative PCR and the 2(-Delta Delta C(T)) Method. Methods. 2001;4(25):402–408. doi: 10.1006/meth.2001.1262
- Zhu W, Wang J-Z, Xu Z, et al. Detection of N6‑methyladenosine modification residues (review). Int J Mol Med. 2019;6(43):2267–2278. doi: 10.3892/ijmm.2019.4169
- Li J, Liang L, Yang Y, et al. N6-methyladenosine as a biological and clinical determinant in colorectal cancer: progression and future direction. Theranostics. 2021;6(11):2581–2593. doi: 10.7150/thno.52366
- Zhou X, Chen Z, Zhou J, et al. Transcriptome and N6-methyladenosine RNA methylome analyses in aortic dissection and normal human aorta. Front Cardiovasc Med. 2021;8:627380. doi: 10.3389/fcvm.2021.627380
- Li A, Gan Y, Cao C, et al. Transcriptome-wide map of N6-methyladenosine methylome profiling in human bladder cancer. Front Oncol. 2021;11:717622. doi: 10.3389/fonc.2021.717622
- Zhang Z, Wang Q, Zhang M, et al. Comprehensive analysis of the transcriptome-wide m6A methylome in colorectal cancer by MeRIP sequencing. Epigenetics. 2021;4(16):425–435. doi: 10.1080/15592294.2020.1805684
- Wang K, Peng J, Yi C. The m6A consensus motif provides a paradigm of epitranscriptomic studies. Biochemistry. 2021;46(60):3410–3412. doi: 10.1021/acs.biochem.1c00254
- Zhang C, Chen Y, Sun B, et al. m6A modulates haematopoietic stem and progenitor cell specification. Nature. 2017;7671(549):273–276. doi: 10.1038/nature23883
- Yang H, Wu Y-F, Ding J, et al. Comprehensive analysis of N6-methyladenosine (m6A) methylation in neuromyelitis optica spectrum disorders. Front Genet. 2021;12:735454. doi: 10.3389/fgene.2021.735454
- Hong S, Shen X, Cheng J, et al. Comprehensive analysis of the transcriptome-wide m6A methylation in mouse pachytene spermatocytes and round spermatids. Front Genet. 2022;13:832677. doi: 10.3389/fgene.2022.832677
- Yang G, Huang L, Jia H, et al. NDRG1 enhances the sensitivity of cetuximab by modulating EGFR trafficking in colorectal cancer. Oncogene. 2021;41(40):5993–6006. doi: 10.1038/s41388-021-01962-8
- Bashaw GJ, Klein R. Signaling from axon guidance receptors. Cold Spring Harb Perspect Biol. 2010;5(2):a001941. doi: 10.1101/cshperspect.a001941
- Rashidi G, Rezaeepoor M, Mohammadi C, et al. Inhibition of semaphorin 4D enhances chemosensitivity by increasing 5-fluorouracile-induced apoptosis in colorectal cancer cells. Mol Biol Rep. 2020;9(47):7017–7027. doi: 10.1007/s11033-020-05761-4
- Li L, Xu N, Zhang J-F, et al. EphB4/ephrinB2 contributes to imatinib resistance in chronic myeloid leukemia involved in cytoskeletal proteins. Int J Med Sci. 2016;5(13):365–373. doi: 10.7150/ijms.14989
- Liu J, Bi J, Li Z, et al. miR‑214 reduces cisplatin resistance by targeting netrin‑1 in bladder cancer cells. Int J Mol Med. 2018;3(41):1765–1773. doi: 10.3892/ijmm.2018.3374
- Wey JS, Gray MJ, Fan F, et al. Overexpression of neuropilin-1 promotes constitutive MAPK signalling and chemoresistance in pancreatic cancer cells. Br J Cancer. 2005;2(93):233–241. doi: 10.1038/sj.bjc.6602663
- Kong J, Fang P, Madoux F, et al. High-throughput screening for protein synthesis inhibitors targeting aminoacyl-tRNA synthetases. SLAS Discov. 2018;2(23):174–182. doi: 10.1177/2472555217734128
- Francklyn CS, Mullen P. Progress and challenges in aminoacyl-tRNA synthetase-based therapeutics. J Biol Chem. 2019;14(294):5365–5385. doi: 10.1074/jbc.REV118.002956
- Shi Y, Wang Y, Huang W, et al. Integration of metabolomics and transcriptomics to reveal metabolic characteristics and key targets associated with cisplatin resistance in nonsmall cell lung cancer. J Proteome Res. 2019;9(18):3259–3267. doi: 10.1021/acs.jproteome.9b00209
- Usman RM, Razzaq F, Akbar A, et al. Role and mechanism of autophagy-regulating factors in tumorigenesis and drug resistance. Asia Pac J Clin Oncol. 2021;3(17):193–208. doi: 10.1111/ajco.13449
- Zhao L, Chen H, Zhang Q, et al. ATF4-mediated microRNA-145/HDAC4/p53 axis affects resistance of colorectal cancer cells to 5-fluorouracil by regulating autophagy. Cancer Chemother Pharmacol. 2022;5(89):595–607. doi: 10.1007/s00280-021-04393-0
- Xuan Y, Zhao S, Xiao X, et al. Inhibition of chaperone‑mediated autophagy reduces tumor growth and metastasis and promotes drug sensitivity in colorectal cancer. Mol Med Rep. 2021;5(23). doi: 10.3892/mmr.2021.11999
- Fakhr E, Zare F, Azadmanesh K, et al. LEF1 silencing sensitizes colorectal cancer cells to oxaliplatin, 5-FU, and irinotecan. Biomed Pharmacother. 2021;143:112091. doi: 10.1016/j.biopha.2021.112091
- Park S-Y, Kim J-Y, Choi J-H, et al. Inhibition of LEF1-mediated DCLK1 by niclosamide attenuates colorectal cancer stemness. Clin Cancer Res. 2019;4(25):1415–1429. doi: 10.1158/1078-0432.CCR-18-1232
- Zhang G, Luo X, Wang Z, et al. TIMP-2 regulates 5-fu resistance via the ERK/MAPK signaling pathway in colorectal cancer. Aging. 2022;1(14):297–315. doi: 10.18632/aging.203793
- Liu Z, Lu J, Fang H, et al. m6A modification-mediated DUXAP8 regulation of malignant phenotype and chemotherapy resistance of hepatocellular carcinoma through miR-584-5p/MAPK1/ERK pathway axis. Front Cell Dev Biol. 2021;9:783385. doi: 10.3389/fcell.2021.783385
- Bhosale PB, Kim HH, Abusaliya A, et al. Structural and functional properties of activator protein-1 in cancer and inflammation. Evid Based Complement Alternat Med. 2022;2022:9797929. doi: 10.1155/2022/9797929
- Zhao Y, Luo A, Li S, et al. Inhibitor of differentiation/DNA binding 1 (ID1) inhibits etoposide-induced apoptosis in a c-Jun/c-fos-dependent manner. J Biol Chem. 2016;13(291):6831–6842. doi: 10.1074/jbc.M115.704361
- Zhu Q, Chen J, Pan P, et al. UBE2N Regulates Paclitaxel Sensitivity of Ovarian Cancer via Fos/P53 Axis. Onco Targets Ther. 2020;13:12751–12761. doi: 10.2147/OTT.S271164
- Kang Y-S, Seok H-J, Jeong E-J, et al. DUSP1 induces paclitaxel resistance through the regulation of p-glycoprotein expression in human ovarian cancer cells. Biochem Biophys Res Commun. 2016;1(478):403–409. doi: 10.1016/j.bbrc.2016.07.035
- Teng F, Xu Z, Chen J, et al. DUSP1 induces apatinib resistance by activating the MAPK pathway in gastric cancer. Oncol Rep. 2018;3(40):1203–1222. doi: 10.3892/or.2018.6520
- Zandi Z, Kashani B, Alishahi Z, et al. Dual-specificity phosphatases: therapeutic targets in cancer therapy resistance. J Cancer Res Clin Oncol. 2022;1(148):57–70. doi: 10.1007/s00432-021-03874-2
- Kesarwani M, Kincaid Z, Gomaa A, et al. Targeting c-FOS and DUSP1 abrogates intrinsic resistance to tyrosine-kinase inhibitor therapy in BCR-ABL-induced leukemia. Nat Med. 2017;4(23):472–482. doi: 10.1038/nm.4310
- Kang H, Kim C, Ji E, et al. The MicroRNA-551a/MEF2C axis regulates the survival and sphere formation of cancer cells in response to 5-fluorouracil. Mol Cells. 2019;2(42):175–182.