
 ?Mathematical formulae have been encoded as MathML and are displayed in this HTML version using MathJax in order to improve their display. Uncheck the box to turn MathJax off. This feature requires Javascript. Click on a formula to zoom.
ABSTRACT
Histone deacetylases (HDACs) and sirtuins (SIRTs) are important epigenetic regulators of cancer pathways. There is a limited understanding of how transcriptional regulation of their genes is affected by chemotherapeutic agents, and how such transcriptional changes affect tumour sensitivity to drug treatment. We investigated the concerted transcriptional response of HDAC and SIRT genes to 15 approved antitumor agents in the NCI-60 cancer cell line panel. Antitumor agents with diverse mechanisms of action induced upregulation or downregulation of multiple HDAC and SIRT genes. HDAC5 was upregulated by dasatinib and erlotinib in the majority of the cell lines. Tumour cell line sensitivity to kinase inhibitors was associated with upregulation of HDAC5, HDAC1, and several SIRT genes. We confirmed changes in HDAC and SIRT expression in independent datasets. We also experimentally validated the upregulation of HDAC5 mRNA and protein expression by dasatinib in the highly sensitive IGROV1 cell line. HDAC5 was not upregulated in the UACC-257 cell line resistant to dasatinib. The effects of cancer drug treatment on expression of HDAC and SIRT genes may influence chemosensitivity and may need to be considered during chemotherapy.
Introduction
The products of the histone deacetylase (HDAC) and sirtuin (SIRT) gene families deacetylate functional lysine groups in histones and non-histone proteins [Citation1,Citation2]. Deacetylation of protein acetyl lysine substrates by the ‘classical’ HDAC proteins (class I, II, and IV HDACs) and by the SIRT proteins (SIRTs, or class III HDACs) is an integral part of epigenetic regulation of numerous important cellular and developmental processes [Citation1–6]. HDACs and SIRTs participate in epigenetic regulation of diverse biological processes including, e.g., chromatin regulation, transcription, cell cycle progression, metabolic processes, inflammation and immune response, cell survival, and other important cellular and organismal pathways [Citation1–3,Citation5–14]. In addition to deacetylation of histones and non-histone proteins, some HDACs are also involved in other molecular mechanisms of epigenetic regulation. For example, HDAC1 directly affects DNA methylation by interacting with DNA methyltransferase 1 (DNMT1) and via participation in a molecular complex which controls DNMT1 abundance [Citation15–17]. SIRTs, in addition to their roles in acetyl lysine deacetylation, also function as mono-ADP-ribosyltransferases and have other catalytic activities [Citation1,Citation9].
Biological activity of many HDACs and SIRTs is altered in cancer. These changes play an important role in epigenetic deregulation within and outside tumour cells via the induction of transcriptional changes and direct modification of multiple tumour suppressor genes, oncogenes, and genes involved in diverse cellular processes, and through modulation of the inflammatory and immune pathways in the tumour microenvironment [Citation1–4,Citation6,Citation8,Citation13,Citation17,Citation18]. HDACs and SIRTs are important targets for cancer therapy through inhibition of their enzymatic activity by the HDAC and sirtuin inhibitors, which leads to a broad modulation of downstream biological pathways regulated by these proteins [Citation1–3,Citation18–21].
In addition to the changes that occur in the catalytic activity of HDACs and SIRTs in cancer cells, mRNA and protein expression of many HDACs and a number of SIRTs is also dysregulated in tumours [Citation2,Citation3,Citation9,Citation10,Citation13,Citation18,Citation22–25]. Both upregulation and downregulation of HDAC and SIRT levels in tumours have been reported, suggesting a context-dependent effect of such changes [Citation2,Citation3,Citation8,Citation10,Citation13,Citation22–28]. HDAC proteins are frequently overexpressed in many tumour categories [Citation2,Citation3,Citation22–25]. However, direct oncogenic effects of their upregulation have been debated, and in specific tumour types some HDACs lose their expression or function, which may also promote tumorigenesis [Citation3,Citation8,Citation25–28]. For example, both overexpression and downregulation or loss of HDAC2 and HDAC5 have been reported in tumours, and both types of changes were associated with negative outcomes [Citation8,Citation26–28]. While the direct molecular impact of expression changes of HDACs in cancer remains an open question, mRNA and protein overexpression of nearly all HDACs in specific tumour categories has been associated with inferior clinical outcomes and with promotion of cancer cell proliferation and aggressiveness [Citation18,Citation22–25].
Some studies suggested a direct benefit of downregulating or depleting individual HDACs and SIRTs for improving outcomes of chemotherapy. For example, HDAC5 depletion in MCF-7 and HeLa cells using HDAC5 siRNA improved tumour sensitivity to the DNA damaging agents doxorubicin and cisplatin [Citation8]. Similarly, overexpression of HDAC1 was observed in multidrug resistant neuroblastoma cell lines and increased resistance of melanoma cells to sodium butyrate, whereas HDAC1 siRNA knockdown sensitized neuroblastoma cells to etoposide [Citation2,Citation29,Citation30]. SIRT2 knockdown in the melanoma cell lines MDA-MB-435S and WM853 sensitized them to dasatinib [Citation31]. Depletion of SIRT1 in the AML cell line K-562 increased sensitivity to HSP90 inhibitors [Citation14]. In contrast, increased mRNA and protein expression of SIRT3 and SIRT4 has been found to be beneficial for patient outcomes in hepatocellular carcinoma (HCC), and higher levels of SIRT3 mRNA and protein expression in HCC cell lines increased sensitivity to cisplatin, doxorubicin, epirubicin, sorafenib, and regorafenib [Citation32]. Even though the effects of SIRT3 may be specific to the types of tumours, upregulation of both SIRT3 and SIRT4 is currently being pursued as a potential strategy to improve cancer treatment outcomes [Citation32].
Separate from direct enzymatic targeting of HDACs and SIRTs in cancer therapy, cancer drugs may also affect their mRNA or protein levels. Chemotherapy treatment of malignant cells with antitumor agents induces a broad range of transcriptional changes in a variety of genes [Citation21,Citation33–37]. Despite evidence for widespread transcriptome changes in tumours after drug treatment, detailed and systematic knowledge of the direction and amplitude of transcriptional changes of individual HDAC and SIRT genes in response to various agents remains limited. Our understanding of downstream effects of transcriptional upregulation or downregulation of HDAC and SIRT genes in response to cancer drug treatment is also limited. Since both histone deacetylating families represent important targets in cancer therapy, perturbations of their expression may have unforeseen effects on drug sensitivity or resistance. It is important to evaluate both the influence of chemotherapy on HDAC and SIRT expression and the potential effect of possible changes in their expression on drug response. To address this important question, we analysed data from the well-characterized NCI-60 cancer cell line panel to identify concerted transcriptional changes in HDAC and SIRT genes after treatment with 15 approved antitumor agents. We also examined the association of post-treatment changes and of baseline levels of HDAC and SIRT genes with tumour cell line response to treatment with each agent.
Materials and methods
The overall workflow of the study and the sources of data are provided in Figure S1. The initial discovery analysis utilized the publicly available NCI-TPW (the NCI Transcriptional Pharmacodynamics Workbench) dataset generated by the US National Cancer Institute (NCI). This computational analysis identified HDAC and SIRT genes with concerted expression changes and also identified those genes whose expression changes or baseline expression were associated with drug response. mRNA and protein expression changes were validated experimentally using RT-PCR and Western blots by our group and also computationally using publicly available data from NCBI GEO (National Center for Biotechnology Information Gene Expression Omnibus) and biomedical publications. We used publicly available data from NCI-TPW and NCBI GEO to perform additional computational analyses of miRNAs involved in the regulation of HDAC5, which emerged as the top lead in the discovery part of the analysis.
Drug response data
Expression data and drug response measures were obtained from NCI-TPW, which contains drug response and transcriptional data for the NCI-60 cancer cell line panel treated with 15 FDA-approved antitumor agents (https://tpwb.nci.nih.gov) [Citation33]. Cell line drug sensitivity was analysed using log10(GI50) values, where GI50 is a drug concentration (μM) producing 50% growth inhibition [Citation38]. The NCI-TPW GI50 values were generated for each antitumor drug after a 48 hr exposure to the agent according to the NCI-60 drug screening protocols [Citation33]. The response measures were available for low (clinically achievable) and high (in-vitro active) concentrations of each agent. The NCI-TPW dataset included the broad-spectrum HDAC inhibitor vorinostat (suberoylanilide hydroxamic acid, or SAHA) [Citation2] at 1 and 5 µM/L for the low and high concentrations, respectively. Additional antitumor agents included the epigenetic DNMT1 inhibitor azacytidine (1 and 5 µM), the kinase inhibitors dasatinib (0.1 and 2 µM), erlotinib (1 and 10 µM), sunitinib (0.2 and 2 µM), lapatinib (1 and 10 µM) and sorafenib (5 and 10 µM), the proteasome inhibitor bortezomib (0.01 and 0.1 µM), the mTOR inhibitor sirolimus (0.01 and 0.1 µM), the Hsp90 inhibitor geldanamycin (0.1 and 1 µM), the DNA damaging agents doxorubicin (0.1 and 1 µM), gemcitabine (0.2 and 2 µM), cisplatin (3 and 15 µM), and topotecan (0.01 and 1 µM), and the microtubule stabilizing agent paclitaxel (0.01 and 0.1 µM) [Citation33].
HDAC and SIRT gene expression measures
We analysed gene expression levels in untreated cell lines and expression changes after treatment for all HDAC and SIRT genes which had the data in the NCI-TPW dataset. They included 9 HDAC genes (HDAC1, HDAC2, HDAC3, HDAC4, HDAC5, HDAC6, HDAC7, HDAC9, and HDAC11) and all 7 SIRT genes (SIRT1, SIRT2, SIRT3, SIRT4, SIRT5, SIRT6, and SIRT7). HDAC8 and HDAC10 were not analysed, as their expression was not profiled in the NCI-TPW dataset. Both expression data in cell lines treated with vehicle only (to which we refer as baseline expression) and expression measures after treatment were analysed. Quality control, RNA normalization, data processing, and validity of expression measures for the NCI-TPW dataset were described previously [Citation33–35]. In brief, expression data were obtained from time course Affymetrix HG-U133A microarray experiments [Citation33]. The gene expression measures at 2, 6, and 24 hr after treatment of the 60 cell lines with low and high concentrations of each agent were compared to time-matched baseline control measures, collected from cells treated with vehicle only [Citation33]. The measurements for the microarray probe sets in the NCI-TPW dataset were processed using background subtraction and RMA array normalization [Citation39]. The log2 expression values from different probe sets within a single gene from a single microarray were combined and averaged. We refer to these expression changes as log2FC, i.e., log2 of the post-treatment fold change of expression of each gene in each cell line. The log2FC values provide the difference between the log2 of the averaged gene expression value in a cell line treated with an agent and the log2 of the averaged expression value of that gene in the same cell line that was treated only with vehicle and collected at time-matched intervals at 2, 6, or 24 hr after treatment. Post-treatment expression changes of selected genes were previously validated in a replicate study using a Fluidigm BioMark™ qRT-PCR System [Citation33].
Analysis of baseline gene expression and concerted transcriptional changes of HDAC and SIRT genes after drug treatment
To examine the direction of expression changes of the HDAC and SIRT genes after treatment with each of the 15 agents, we used our previously described definition of concerted transcriptional changes based on the threshold of ≤ 15 cell lines with discordant direction of transcriptional change at any given time point and concentration [Citation34,Citation35]. We considered a gene to have concerted upregulation or concerted downregulation for those microarray experiments (specific to an antitumor agent, concentration, and post-treatment time), in which the expression of the vast majority of the cell lines changed in the same direction, with no more than 15 cell lines showing an expression change in the opposite direction. Our earlier study of five agents in the NCI-TPW dataset [Citation34] showed that this threshold provided an appropriate measure of concerted transcriptional changes and was concordant with independent resources, and that the probability of ≤ 15 cell lines to be expressed in the opposite direction at random is low, between 6.96 × 10⁻⁵ and 1.54 × 10⁻³ 34. For those genes and conditions which satisfied the criteria for concerted expression changes, we refer to the direction of the changes (upregulation or downregulation) in the majority of the cell lines after treatment as consensus changes.
Baseline expression for each HDAC and SIRT gene in a given cell line was computed as a median of log2-transformed expression values in the matched untreated control cell lines for all 15 agents at 6 hr after the start of the experiment. We had previously selected the 6 hr time point as providing the most biologically relevant representation of baseline gene expression in the NCI-TPW data. NCI-TPW baseline gene expression measures at 6 hr were consistent with similar measures at 2 and 24 hr [Citation33–35].
Analysis of correlation of cancer drug response with baseline HDAC and SIRT gene expression and expression changes after treatment
For each low and high concentration of each agent and for each time point (2, 6, and 24 hr), we examined Spearman and Pearson correlation of drug response (log(GI50)) of the NCI-60 cell lines with the amplitude of gene expression changes (log2FC). We also examined Spearman and Pearson correlation of log(GI50) of each agent with baseline gene expression in the untreated NCI-60 control cell lines. Significance of the correlations was evaluated using the Benjamini-Hochberg adjustment for false discovery rate (FDR) [Citation40]. The FDR adjustment was performed separately for Spearman and Pearson correlation p-values. For each type of correlation (Spearman or Pearson), the FDR adjustment was applied to a single set of p-values from all time points and both concentrations, while also including the p-values from baseline correlation analysis. Here and below, we refer to the p-values prior to FDR adjustment as p0, and FDR adjusted p-values as pFDR. Correlation analyses were performed using R v. 3.5.3 and 4.2.1 and Microsoft Excel. Graphical output for NCI-TPW data was generated using the graphical interfaces of NCI-TPW [Citation33] and TPWShiny (available for download at https://brb.nci.nih.gov/TPWshiny/) [Citation41].
Validation of expression changes in HDAC and SIRT genes and protein products after drug treatment using publicly available independent datasets
In order to confirm the direction of concerted changes in HDAC and SIRT genes in response to dasatinib and vorinostat observed in the NCI-TPW data, we examined independent mRNA and protein expression datasets. We analysed publicly available datasets from the NCBI GEO [https://www.ncbi.nlm.nih.gov/geo/] or described in biomedical publications [Citation7,Citation42,Citation43]. We extracted pre-treatment and post-treatment gene and isoform mRNA expression data for HDACs and SIRTs from the NCBI GEO datasets GSE51083 [Citation44] and GSE69395 [Citation45] for cell lines treated with dasatinib, and mRNA expression data from GSE84205 [Citation46] and GSE43010 [Citation47] for cell lines treated with vorinostat. These datasets provided Affymetrix and Illumina gene expression microarray data prior to drug treatment and after treatment at various time points. Depending on whether transcript isoform data or gene level data were available in the annotation of each dataset, the direction of transcriptional changes of each HDAC and SIRT gene in each cell line was summarized using the log2 of transcriptional changes for transcript isoforms and/or entire genes, and averaged among the probe sets. For those datasets where technical replicates were available, the log2-transformed expression changes were averaged among the technical replicates.
The NCBI GEO dataset GSE51083 included Illumina HT-1 microarray expression data (multiple transcripts per gene) for the chronic myelogenous leukaemia (CML) K-562 cell line, profiled at baseline and at 4, 8, and 24 hr after treatment with 100 nM of dasatinib [Citation44]. K-562 is a part of the NCI-60 panel, and the 100 nM dasatinib concentration used in GSE51083 was also used as the low concentration of dasatinib in NCI-TPW. For each gene, we used the 24 hr time point, which was profiled in both datasets, to examine the direction of expression changes after dasatinib treatment as compared to the baseline in GSE51083. Since the K-562 cell line had available expression measurements only at 2 hr but not at 6 or 24 hr after treatment with dasatinib in the NCI-TPW data, the direction of transcriptional changes of HDAC and SIRT genes in that cell line in the GSE51083 data was compared to the direction of consensus changes in the NCI-TPW dataset, as follows. After averaging the log2FC values among the multiple probes for each transcript and among the three replicate measurements in GSE51083, for those genes that satisfied the condition |log2FC| > 0.1, the direction of transcriptional change (positive or negative log2FC) was compared to the direction of consensus changes of log2FC in the NCI-TPW dataset for those genes which satisfied the criterion of concerted expression changes at 24 hr after treatment ().
Table 1. Concerted expression changes of HDAC and SIRT genes after drug treatment in the NCI-TPW dataset.
GSE69395 [Citation45] provided Affymetrix Human Genome U133 Plus 2.0 expression microarray data for the non-small cell lung cancer (NSCLC) cell lines A549, H661, H1666 and Cal12T, profiled at baseline and at 72 hr after treatment with 150 nM of dasatinib. The NCI-TPW condition closest to that data point was at 24 hr after treatment with the low concentration of dasatinib. Among the four cell lines in GSE69395, A549 is also a part of the NCI-60 cancer cell line panel.
GSE43010 [Citation47] provided the data on changes in expression in transformed and non-transformed fibroblasts in response to vorinostat. It provided cell line data for BJ (normal fibroblasts) and BJ LTSTERas (transformed fibroblasts using the genes for the SV40 large T and small t antigens, hTERT and H-RAS). Neither cell line is a part of the NCI-60 panel. The data were provided at baseline and at 24 hr after treatment with 25 μM of vorinostat.
GSE84205 [Citation46] included Affymetrix Human 1.0 STS expression microarray data for the 90-8TL malignant peripheral nerve sheath tumour (MPNST) cell line (not included the NCI-60 panel), profiled at baseline and at 24 hr after treatment with 2 μM of vorinostat. This is an intermediate concentration between the low and the high concentrations of vorinostat in the NCI-TPW dataset.
The direction of transcriptional changes of the SIRT genes was also validated using a published report by Kyrylenko et al. [Citation7], who investigated the effects of multiple HDAC inhibitors on SIRT transcriptional changes in mouse neuroblastoma Neuro-2a cells, post-mitotic rat primary hippocampal and cerebellar granule neurons, and human SH-SY-5Y and Sk-N-As neuroblastoma cell lines at 12 and 24 hr after treatment. These authors used 1 µM of vorinostat in their experiments, which at 24 hr was comparable to the 24 hr time point of the low concentration of vorinostat in NCI-TPW. Other HDAC inhibitors used in their study included trichostatin A, n-butyrate, apicidin, and M344 [Citation7].
The direction of HDAC and SIRT protein expression changes after treatment with vorinostat was examined using publicly available proteomic data. Such data were available for HL-60 acute myeloid leukaemia (AML) cells (also included in the NCI-60 panel) treated with 205 μM vorinostat vs DMSO, at 8 hr after treatment, from the study of Zhu et al. [Citation42]. An additional dataset, PXD006005 from the PRIDE (Proteomics IDEntification Database) repository of the ProteomeXchange Consortium (https://www.ebi.ac.uk/pride/archive/projects/PXD006005), included the 72 hr time point for 10 μM vorinostat vs DMSO-treated fibroblasts carrying the NPC1I1061T mutation representative of Niemann-Pick Type C1 disease, and was generated by Subramanian et al. [Citation43].
Information about clinical trials which tested the dasatinib-vorinostat combination was obtained from the U.S. Library of Medicine ClinicalTrials.gov online database (https://clinicaltrials.gov) and biomedical publications.
Cell lines
MDA-MB-231 (ATCC HTB-26) (RRID:CVCL_0062), IGROV-1 (RRID:CVCL_1304) and UACC-257 (RRID:CVCL_1779) were obtained from the NCI Developmental Therapeutics Program Tumor Repository. Each lot of cells was authenticated through a variety of molecular characterizations and identity was confirmed from frozen stock of each cell line using Identifiler DNA profiling [Citation33,Citation48]. Each cell line was tested for Mycoplasma using the MycoAlert Mycoplasma Detection Kit (Lonza).
Quality control information from the public datasets which were analysed in this study (Figure S1) was provided in the original reports, including the list of the NCI-60 cell lines profiled in the NCI-TPW dataset and detailed information about their authentication and Mycoplasma testing [Citation33].
Experimental validation of HDAC5 transcript and protein changes in the IGROV1, MDA-MB-231, and UACC-257 cell lines
We experimentally verified HDAC5 mRNA and protein expression changes in the IGROV1, UACC-257, and MDA-MB-231 cell lines after treatment with the high concentration (2 μM) of dasatinib. Total cell lysates were prepared from the cells which were untreated, vehicle control (DMSO) treated or treated with 2 μM of dasatinib. Transcriptional levels of HDAC5 mRNA were measured at 24 hr after treatment using qRT-PCR using BioMark™ assay probes Hs00608351_m1 (the probe providing the best coverage, spanning exons 14 and 15) and Hs00608366_m1 (the most cited assay probe, spanning exons 3 and 4) (ThermoFisher Scientific/Life Technologies) and normalized to GAPDH expression which was stable across treatments. Protein levels were measured at 24 and 32 hr after dasatinib treatment. HDAC5 expression was measured using Western blot analysis, with 40 μg of lysate per lane run on a 3–8% Tris-Acetate gel for 65 minutes at 125 volts. Blots were probed with rabbit monoclonal antibody D1J7V (Cell Signaling TaqMan®) at 1:500. HDAC5 quantification was done using Licor Image Studio software and was first normalized to the levels of GAPDH loading controls and then divided by the levels from normalized untreated cells. Background was subtracted out based on an equal area (to bands) in the empty lane between the MWM and Untreated, next to GAPDH (the lane was loaded with loading buffer with lysis buffer). Duplicate biological replicate experiments were conducted on separate dates in order to confirm the consistency of mRNA and protein expression changes of HDAC5.
Mutational status of the NCI-60 cell lines
Single nucleotide variant status of the NCI-60 cell lines for the BRAF gene was obtained from the NCI-60 whole exome sequencing project [Citation49]. This information was downloaded from the CellMiner data download site (https://discover.nci.nih.gov/cellminer/loadDownload.do) [Citation50].
Analysis of regulatory microRNA expression changes after vorinostat treatment using data from the GEO dataset GSE69959
Multiple miRNAs have been implicated in the regulation of HDAC5 levels in malignant and non-malignant cells [Citation51–58]. We investigated the changes in expression of such miRNAs after drug treatment. We examined the data in a publicly available GEO dataset, GSE69959 [Citation59]. The miRNA expression data in that dataset had been generated with the help of the μParaflo microfluidic chip technology using a version of miRBase (Release 10.1). We examined these data to investigate expression changes of miR-125a-5p, miR-589-5p, miR-9, miR-124, and miR-217 in three AML cell lines, KASUMI1, U937, and K562, at 6 hr after treatment with 5 μM of vorinostat as compared to the pretreatment levels. The 6 hr time point and concentration are comparable to that time point and high concentration of vorinostat in NCI-TPW. Among the three cell lines, K-562 is a part of the NCI-60 panel. The data for an miR-2861, also implicated in HDAC5 regulation [Citation51], were not available from that dataset. For each miRNA and each cell line, the log2-transformed normalized changes in expression of the treated vs untreated cell lines available from GEO were averaged among the 5 probes and 3 technical replicates. We verified miRNA annotation using the information from the RNAcentral database v.19 (https://rnacentral.org) [Citation60] at the European Bioinformatics Institute and from the miRBase online database release 22.1 (https://www.mirbase.org) [Citation61].
Transcriptome-wide enrichment analysis of miRNA targeted genes
To examine the potential influence of miRNA regulation on drug response, gene set enrichment analyses of miRNA targets were performed using our in-house developed R package GSEA [Citation62,Citation63] (available for download at https://brb.nci.nih.gov/BRB-ArrayTools/ArrayToolsRPackages.html) and R v. 3.5.1. Our aim was to identify the miRNAs that were significantly enriched with targeted genes whose expression changes after treatment (relative to the untreated) in the NCI-TPW dataset were associated with response (log(GI50)) to dasatinib and vorinostat. We analysed NCI-TPW data for each of the following treatment conditions: dasatinib (high concentration at 24 hr after treatment) and vorinostat (high concentration, separately at 6 and 24 hr). Experimentally verified miRNA target lists were obtained from miRTarBase v. 7 [Citation64,Citation65], which contained data on 2599 human miRNAs. Association analyses between post-treatment gene expression changes and log(GI50) were performed using Spearman rank correlation. LS (log score) and KS (Kolmogorov-Smirnov) permutation tests were conducted to calculate a p-value measuring the gene set enrichment.
Expression analysis of YAP1
Based on an earlier study that suggested a mediating effect of a master transcriptional regulator, YAP1 (YAP), on synergy between dasatinib and HDAC inhibitors [Citation66], we investigated associations of its expression in the NCI-TPW dataset with cell line sensitivity to dasatinib and with transcriptional changes of HDAC and SIRT genes after dasatinib treatment. To assess the effect of dasatinib on YAP1 expression, we evaluated concerted changes of YAP1 using the same criteria as those for HDAC and SIRT genes. We used Spearman correlation to evaluate the association of log(GI50) of dasatinib with transcriptional changes of YAP1 at 2, 6, and 24 hr after treatment with both concentrations of dasatinib. We also evaluated Spearman correlations of log(GI50) of dasatinib with median baseline expression of YAP1 in untreated cell lines, computed across 15 agents at 6 hr. Finally, we evaluated a potential mediating role of YAP1 on changes in HDAC and SIRT expression induced by dasatinib. We analysed Spearman correlation of log2FC of HDAC and SIRT genes at 6 and 24 hr after treatment with the high concentration of dasatinib with baseline expression of YAP1 and with log2FC of YAP1 at those time points.
Expression analysis of dasatinib kinase target genes
Since dasatinib is a broad multi-kinase inhibitor [Citation67], we used the NCI-TPW dataset to investigate potential influences of its kinase targets on HDAC and SIRT expression. To achieve this goal, we examined the effects of dasatinib treatment on mRNA expression of 22 genes (ABL1, ABL2, ZAK, BCR, BTK, CSF1R, CSK, EPHA2, EPHA5, EPHB4, FGR, FRK, FYN, KIT, LCK, LYN, PDGFRA, PDGFRB, MAP4K5, MAPK14, SRC, and YES1) encoding dasatinib targets with kinase activity. Information about dasatinib targets was obtained from the DrugBank Online portal (https://go.drugbank.com) [Citation68] and biomedical publications [Citation31,Citation67,Citation69–73]. We also analysed Spearman correlations of baseline expression of dasatinib kinase target genes and of their post-treatment expression changes (log2FC) with log(GI50) of dasatinib and with log2FC of HDAC and SIRT genes at 6 and 24 hr after treatment with the high concentration of dasatinib. The p-values from Spearman correlation analyses of dasatinib kinase target genes were adjusted for multiple testing using the FDR adjustment, which was applied to a combined set of p-values from the analyses of different time points and from baseline correlation analysis.
Results
Drug treatment induced multiple concerted changes in HDAC and SIRT gene expression
provides the list of all conditions under which each HDAC and each SIRT gene satisfied the criteria of concerted transcriptional changes after drug treatment in the NCI-TPW dataset. As noted previously [Citation33,Citation34], higher drug concentrations and later time points (6 hr and especially 24 hr after treatment) more often resulted in concerted transcriptional changes. Each of the 15 antitumor agents induced concerted changes in multiple genes. Notably, HDAC4 and HDAC9 not only showed concerted changes in response to multiple agents, but they also had high amplitudes of transcriptional response to several agents (|log2FC| ≥ 2.5 or 4 in some cell lines; ; Figure S2). HDAC4 was downregulated in all cases of concerted changes, whereas the expression of HDAC9 was either decreased or increased in a concerted manner for different agents, time points, and concentrations ().
The non-selective HDAC inhibitor vorinostat and the DNMT1 inhibitor azacytidine induced concerted transcriptional effects in multiple HDAC and SIRT genes, consistent with broad epigenetic effects of both agents [Citation25,Citation36,Citation74–77]. Treatment with vorinostat led to pronounced changes in expression of multiple HDAC and SIRT genes (). HDAC6, HDAC7, HDAC9, SIRT1, and SIRT5 were downregulated in a concerted manner after treatment with vorinostat under multiple conditions. Interestingly, expression of HDAC1, HDAC3, HDAC5, SIRT2, SIRT3, SIRT4, and SIRT7 was upregulated in a concerted manner after treatment with vorinostat (; Figure S3). As the products of HDAC1 and HDAC3 are enzymatic targets of vorinostat [Citation2], the effect of vorinostat on the increase in their mRNA levels was in the opposite direction from its inhibition of the enzymatic activity of both HDACs.
Treatment with non-epigenetic agents with various mechanisms of action also induced concerted expression changes in multiple HDAC and SIRT genes (; ; Figure S4). For example, at 24 hr after treatment with the high or low concentration of the multi-kinase inhibitor dasatinib, HDAC4, HDAC5, HDAC11, SIRT2, SIRT3, SIRT4, and SIRT5 were upregulated in a concerted manner, while HDAC2, HDAC7, and HDAC9 were downregulated. HDAC2 and HDAC9 were also downregulated at 6 hr after treatment with the high concentration of dasatinib.
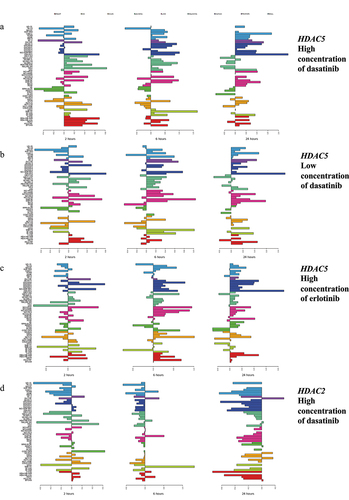
Figure 1. Examples of changes in expression of HDAC genes in response to treatment with erlotinib and dasatinib. Shown are transcriptional changes (log2FC) at 2 (left panel), 6 (middle panel), and 24 hr (right panel) after treatment. Horizontal right bars indicate elevated gene expression, whereas left bars show decreased expression relative to the untreated cell lines. As summarized in , concerted upregulation at 24 hr (shown on the right most panels) was observed for HDAC5 after treatment with (a) the high (2,000 nM) and (b) the low (100 nM) concentrations of dasatinib and (c) the high (10,000 nM) concentration of erlotinib. (d) expression changes of HDAC2 after treatment with the high concentration of dasatinib showed concerted downregulation at 6 hr (middle panel) and 24 hr (right panel). Colors represent cancer categories. The scale on the bottom represents log2 difference between expression values of treated and untreated cell lines. The scale for each microarray experiment is specific to that experiment.
Correlation of increased mRNA expression of HDAC5, HDAC1, and SIRT genes after drug treatment with higher sensitivity to kinase inhibitors
provides the list of significant associations satisfying pFDR <0.05 between changes in expression (log2FC) of HDAC and SIRT genes and cell line sensitivity (log(GI50)) to the antitumor agents profiled in NCI-TPW. An expanded list of associations satisfying the less stringent threshold, pFDR <0.1, is provided in Supplementary Table S1. Unexpectedly, we observed strong significant associations of HDAC5 upregulation at 24 hr with increased sensitivity to the ABL/SRC family multi-kinase inhibitor dasatinib and the EGFR inhibitor erlotinib (negative correlation between log2FC and log(GI50), with −0.7806 ≤ Spearman correlation coefficient ≤ −0.4003, 3.74 × 10⁻¹¹ ≤ p0 ≤0.0017, 6.28 × 10⁻⁸ ≤ pFDR ≤0.0877; Figure S5, , and Supplementary Table S1). The strongest associations were between sensitivity to dasatinib and the amplitude of transcriptional upregulation of HDAC5 at 24 hr after treatment (
= −0.7806 and −0.6871, pFDR = 6.28 × 10⁻⁸ and 2.17 × 10⁻⁵ for the high and low concentrations, respectively; ). HDAC5 upregulation also showed a trend for an association with increased sensitivity to the EGFR/HER2 inhibitor lapatinib, however it did not reach significance after FDR adjustment for multiple testing (
= −0.3648 and −0.2920, p0 = 0.0067 and 0.0305, pFDR ≥0.1564 for the high and low concentrations, respectively; data not shown). HDAC5 was upregulated in a concerted manner at 24 hr after treatment with the high and low concentrations of dasatinib and lapatinib and with the high concentration of erlotinib (; ).
Table 2. Spearman correlations between log(GI50) and log2FC of HDAC and SIRT genes satisfying pFDR <0.05.
HDAC1 expression did not satisfy the criterion for concerted changes after dasatinib treatment (; Figure S4A). However, similar to HDAC5, log2FC of HDAC1 was negatively correlated with log(GI50) of dasatinib, indicating that cell lines with increased HDAC1 expression after treatment were more sensitive, and cell lines with decreased HDAC1 expression were more resistant to dasatinib (at 6 hr after treatment with the high or the low concentration, and at 24 hr at the low concentration; −0.4650 ≤ ≤ −0.4551, 0.0419 ≤ pFDR ≤0.0518; , Supplementary Table S1). In contrast to HDAC5, changes in HDAC1 expression were not associated with sensitivity to either erlotinib or lapatinib (data not shown). The association of upregulation of HDAC5 with sensitivity to multiple kinases and of HDAC1 with dasatinib sensitivity is unexpected, based on frequently reported clinical benefits of inhibition of their products in cancer treatment.
Upregulation of several SIRT genes was also significantly associated with sensitivity to dasatinib, with a negative correlation between log2FC and log(GI50). An increase in SIRT1 expression at 6 hr after treatment with both the high and the low concentrations of dasatinib and upregulation of SIRT2, SIRT3, SIRT4, and SIRT5 at 24 hr after treatment with the high concentration were associated with dasatinib sensitivity (−0.5158 ≤ ≤ −0.4234, 9.05 × 10⁻⁵ ≤ pFDR ≤0.0909; ; Supplementary Table S1). Among them, only SIRT3 satisfied the criterion for concerted upregulation after treatment with the high concentration of dasatinib at 24 hr (Figure S4C). SIRT2, SIRT3, SIRT4, and SIRT5 had concerted upregulation by the low concentration of dasatinib at 24 hr (; Figure S4). In addition to the associations of SIRT genes with sensitivity to dasatinib, SIRT5 had concerted upregulation at 24 hr after treatment with the high concentration of erlotinib, which also associated with erlotinib sensitivity (
= −0.4429; pFDR = 0.0438; and ; Figure S4D). Associations of upregulation of SIRT3 and SIRT4 with dasatinib sensitivity were consistent with previously reported protective roles of both genes in the treatment of hepatocellular carcinoma and with the positive effect of SIRT3 upregulation on HCC sensitivity to a variety of antitumor agents, including the kinase inhibitors sorafenib and regorafenib [Citation32]. By contrast, associations of stronger upregulation of SIRT1, SIRT2, and SIRT5 with sensitivity to dasatinib were unexpected, since previous studies had reported benefits of their downregulation or depletion in improving cancer outcomes [Citation13,Citation14,Citation78,Citation79]. Notably, an improvement in dasatinib sensitivity had been reported in melanoma cell lines with SIRT2 knockdown [Citation31].
In contrast to the associations of post-treatment upregulation of HDAC1, HDAC5, SIRT1, SIRT2, SIRT3, SIRT4, and SIRT5 with dasatinib sensitivity, HDAC2 was downregulated by dasatinib in a concerted manner at 6 hr (high concentration) and 24 hr (both concentrations; ), and the amplitude of HDAC2 downregulation at 24 hr after treatment with the high concentration was significantly associated with sensitivity to dasatinib (positive correlation between log2FC and log(GI50) with = 0.5774 and pFDR = 0.0034; , Supplementary Table S1).
While the majority of the HDAC and SIRT expression changes were associated with log(GI50) of the kinase inhibitors dasatinib and erlotinib, we also observed significant associations between changes in mRNA expression and cell line response to other antitumor agents with different mechanisms of action (; Supplementary Table S1). Some associations were similar to the patterns observed for HDAC5 and HDAC1 with kinase inhibitors, suggesting a surprising association of post-treatment transcriptional upregulation with higher sensitivity to specific agents. Other trends suggested benefits of downregulation of specific genes for improved drug sensitivity. While, as described above, increased mRNA expression of HDAC1 after treatment was associated with sensitivity to dasatinib, HDAC1 associations with response to DNA damaging agents were in the opposite direction. The correlations between log2FC of HDAC1 at 24 hr and log(GI50) of cisplatin, gemcitabine, and topotecan were significantly positive (0.4595 ≤ ≤0.5429, pFDR ≤0.0438; ), indicating that cell lines with a greater increase in expression after treatment were more resistant to these DNA damaging agents, while the cell lines where HDAC1 expression was more strongly downregulated were more sensitive to them. This direction of the correlation with DNA damaging agents is consistent with previously reported benefit of diminished HDAC1 expression in neuroblastoma cell lines, which increased their sensitivity to etoposide [Citation29]. Similarly, log2FC of HDAC4 was positively associated with log(GI50) of cisplatin at 6 hr (both concentrations) and 24 hr (high concentration) and with response to geldanamycin at 24 hr after treatment with the low concentration (0.4095 ≤
≤0.6251, 0.0002 ≤ pFDR ≤0.0877; ; Supplementary Table S1). HDAC4 was downregulated by both cisplatin and geldanamycin in a concerted manner (), and cell lines with its stronger downregulation were more sensitive to these agents. At 24 hr, log2FC of HDAC2 was positively correlated with log(GI50) of doxorubicin (low concentration,
= 0.4272, pFDR = 0.0597), and both HDAC2 and HDAC9 had positive correlations with log(GI50) of paclitaxel (low concentration,
= 0.4272 and 0.4290, pFDR = 0.0558 and 0.0122, respectively; ; Supplementary Table S1), suggesting that cell lines where such genes were downregulated after treatment were more sensitive to these agents, and cell lines with upregulated genes were more resistant. In contrast, HDAC9 was downregulated by azacytidine at 6 and 24 hr in a concerted manner and showed a significant negative correlation between log2FC and log(GI50) at 24 hr (high concentration,
= −0.6136, pFDR = 0.0069; and ). This indicated that the cell lines in which HDAC9 was more strongly downregulated by azacytidine had a tendency to be more resistant to that agent. The amplitude of expression changes of SIRT2, SIRT3, and SIRT7 showed a similarly negative association with log(GI50) of cisplatin and geldanamycin at 24 hr (high concentrations, −0.5730 ≤
≤ −0.4191, 0.0019 ≤ pFDR ≤0.0810; and Supplementary Table S1).
Associations of baseline expression levels with drug response
Associations between baseline expression and drug response satisfying pFDR <0.1 are provided in Supplementary Table S2. Elevated baseline expression of HDAC1 was associated with higher sensitivity to sunitinib and satisfied pFDR <0.05 ( = −0.4463, pFDR = 0.0468), whereas increased baseline expression of HDAC7 was associated with sensitivity to dasatinib (
= −0.4117, pFDR = 0.0769). This direction of correlations of increased expression of HDAC1 and HDAC7 in untreated cell lines with sensitivity to kinase inhibitors was similar to the direction of associations observed after drug treatment for upregulation of HDAC5 with dasatinib and erlotinib sensitivity and of HDAC1 with dasatinib sensitivity ( and Supplementary Table S1). In contrast, associations of baseline expression of HDAC7 with response to paclitaxel and of SIRT6 with response to erlotinib were positive (
= −0.4188 and −0.4111, pFDR = 0.0583 and 0.0662, respectively).
Validation of HDAC and SIRT mRNA and protein expression changes after treatment with dasatinib and vorinostat in public datasets
To confirm mRNA and protein expression changes of HDACs and SIRTs genes in response to dasatinib and vorinostat, we examined publicly available datasets from NCBI GEO and biomedical literature. Even though only a subset of the cell lines in independent datasets were also a part of the NCI-60 panel, and although some drug concentrations or post-treatment time points in separate datasets were not identical to those in NCI-TPW, both mRNA and protein expression changes after treatment were predominantly in agreement with directions of concerted transcriptional changes in NCI-TPW data.
Supplementary Table S3A and Supplementary Table S3B show transcriptional changes in HDAC and SIRT genes and isoforms in response to dasatinib in two public datasets, as compared to the concerted changes in NCI-TPW. These tables show the directions of transcriptional changes in the K-562 CML cell line in response to dasatinib at 24 hr after treatment in the NCBI GEO dataset GSE51083 [Citation44] (Supplementary Table S3A) and in four NSCLC cell lines in GSE69395 [Citation45] at 72 hr after treatment with 150 nM of dasatinib (Supplementary Table S3B). These directions were compared to the direction of concerted changes in the NCI-TPW consensus. Both tables show that when considering the changes after treatment above the minimal threshold of |log2FC| > 0.1, transcription of a number of HDAC and SIRT genes in individual cell lines from independent datasets was upregulated or downregulated in the same direction with concerted changes of the NCI-TPW consensus. In Supplementary Table S3A, the direction of transcriptional changes was the same in GSE51083 and NCI-TPW for each HDAC and SIRT gene satisfying both criteria (|log2FC| > 0.1 in GSE51083 and concerted changes in NCI-TPW). However, there was a considerable variation among cell lines in the magnitude and direction of expression changes for individual genes. Of note, in the GSE69395 dataset HDAC5 was most strongly upregulated (log2FC = 0.2789) in the Cal12T cell line. This cell line is not a part of the NCI-60 panel but has been reported to be sensitive to dasatinib [Citation45,Citation71]. However, GSE69395 provided data at 72 hr after treatment, as opposed to the latest time point in NCI-TPW being 24 hr, resulting in a partial agreement with the direction of changes in NCI-TPW. Due to time dependency of transcription and mRNA degradation, these datasets may have underlying biological differences between mRNA levels at different time points after treatment.
Transcriptional changes in response to vorinostat are summarized in Supplementary Table S4. Supplementary Table S4A compares log2FC of transcriptional changes in HDACs and SIRTs in response to vorinostat in GSE43010 [Citation47] to concerted changes in NCI-TPW at 24 hr in both datasets. The data in GSE43010 had been generated after treatment with 25 μM of vorinostat, which is substantially higher than the high concentration (5 μM) of vorinostat in NCI-TPW. GSE43010 included measures for the normal fibroblast cell line, BJ, and the transformed fibroblast cell line, BJ LTSTERas, neither of which were a part of the NCI-60 panel. The changes in expression of many HDAC and SIRT genes in GSE43010 were consistent with those observed in the NCI-60 cancer cell lines in NCI-TPW. Of note, while vorinostat induced the same directions of transcriptional changes in both transformed and non-transformed fibroblasts for the majority of HDAC and SIRT genes, the amplitude of their transcriptional upregulation or downregulation was higher in the transformed fibroblast cell lines BJ LTSTERas.
Supplementary Table S4B compares the changes in the MPNST cell line 90-8TL from GSE84205 [Citation46], at 24 hr after treatment with 2 μM of vorinostat, to the direction of changes in the NCI-TPW consensus at 24 hr after treatment with the high or low concentrations of vorinostat. Even though fibroblast or MPNST cell lines were not a part of the NCI-60 panel, there was an agreement between the directions of expression changes of many HDACs and some SIRTs in response to vorinostat in GSE84205 and in NCI-TPW. HDAC1, HDAC3, HDAC5, and SIRT2 were consistently upregulated, and HDAC7, HDAC9, and SIRT1 were consistently downregulated by vorinostat in all three datasets (GSE43010, GSE84205, and NCI-TPW consensus).
Concerted transcriptional changes of SIRT genes in NCI-TPW were also in agreement with the results of Kyrylenko et al. [Citation7], who examined the effects of HDAC inhibitors on mouse and human neuroblastoma cell lines and on non-malignant post-mitotic rat primary hippocampal and cerebellar granule neurons. Concerted transcriptional upregulation of SIRT2 and SIRT4 and concerted downregulation of SIRT1 and SIRT5 by vorinostat in NCI-TPW were in agreement with the direction of their changes induced by trichostatin A and n-butyrate, reported by Kyrylenko et al. [Citation7]. These authors further confirmed upregulation of SIRT2 at 12 and 24 hr in mouse neuroblastoma cells Neuro-2a in response to the HDAC inhibitors vorinostat, apicidin, and M344.
The direction of previously reported changes for HDAC and SIRT protein levels in malignant and non-malignant cells after treatment with vorinostat was in most cases in agreement with the direction of concerted transcriptional changes in NCI-TPW. Zhu et al. [Citation42] used SILAC protein quantification labelling, basic HPLC fractionation, and LC-MS/MS analysis to provide global proteome measurements for the AML cell line HL-60, at 8 hr after treatment with 205 μM vorinostat, as compared to DMSO. While HL-60 is also a part of the NCI-60 panel profiled in NCI-TPW, however the two studies did not use identical conditions, as the 8 hr time point was not included in the NCI-TPW measures, and the 205 μM concentration of vorinostat vastly exceeded the high concentration of vorinostat of 5 μM in NCI-TPW. Three HDAC and SIRT proteins had available relative abundance ratios (M/L) of vorinostat-treated to DMSO-treated cells generated by Zhu et al. [Citation42]. These were HDAC1, HDAC2, and SIRT5 (M/L ratio = 1.1608, 1.5431, and 1.0042, and posterior error probability PEP = 1.3402 × 10−112, 7.0097 × 10−136, and 4.3668 × 10⁻¹⁰ for each of the three proteins, respectively). Whereas HDAC2 did not satisfy the criterion for concerted expression changes in NCI-TPW, and the protein abundance of SIRT5 was essentially unchanged between treated and untreated cells in the study of Zhu et al. [Citation42], upregulation of HDAC1 protein levels by vorinostat was in agreement with its concerted transcriptional upregulation in NCI-TPW at 6 and 24 hr using the high and low concentrations of vorinostat. Upregulation of HDAC1, an enzymatic target of vorinostat inhibition, at both mRNA and protein levels is notable.
An additional set of measures of changes in protein abundance in non-malignant cells was generated by a global MS/MS proteomic study of Subramanian et al. [Citation43]. Their measures were obtained at the 72 hr time point for 10 μM vorinostat vs DMSO treated fibroblasts with the NPC1I1061T mutation representing a model for a progressive neurodegenerative disorder, Niemann-Pick Type C1 disease. Among other proteins that study generated relative proteomic abundance data (represented as z-scores) for HDAC1, HDAC2, HDAC3, HDAC4, HDAC7, and SIRT2, comparing vorinostat-treated vs DMSO-treated cells. Each of these proteins had measures for 1 or 2 out of three replicate experiments. HDAC2 and HDAC4 did not satisfy the criteria for concerted expression changes in NCI-TPW after treatment with vorinostat and were not compared to the proteomic data. Changes in protein abundance of HDAC1 were not in agreement with NCI-TPW, as it was slightly downregulated in the proteomic study of NPC1 fibroblasts (z-scores of −0.30 and −0.02 in two replicate experiments), as opposed to the concerted upregulation of HDAC1 mRNA levels in NCI-TPW. In contrast, the changes in abundance of HDAC3, HDAC7 and SIRT2 after vorinostat treatment were in agreement with transcriptional changes in NCI-TPW (z-score = 0.68 for HDAC3, showing its protein upregulation despite being an enzymatic target for vorinostat, −1.50 for HDAC7 indicating its downregulation, and 0.29 and 0.12 in two replicate experiments for SIRT2, showing its upregulation). Despite differences between the time points and vorinostat concentrations in the two studies, transcriptional and proteomic changes in expression of HDAC3, HDAC7, and SIRT2 were consistent and appear to be induced in both malignant and non-malignant cells. As discussed above, upregulation of SIRT2 protein levels by vorinostat was also consistent with the increase of SIRT2 mRNA expression in three separate independent studies [Citation7,Citation46,Citation47].
Experimental validation of HDAC5 expression changes after dasatinib treatment
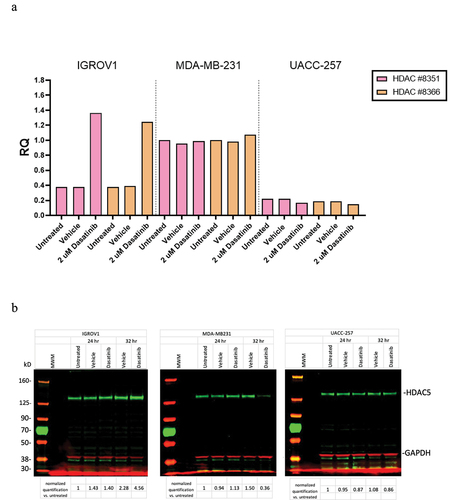
To experimentally validate mRNA and protein expression changes of HDAC5 after treatment with vorinostat, we selected three cell lines with different levels of sensitivity to dasatinib and different amplitudes and directions of transcriptional changes at 24 hr after treatment with the high concentration of dasatinib in NCI-TPW. All three cell lines had some baseline expression of HDAC5 in untreated cell lines. IGROV1 is an ovarian carcinoma cell line which was highly sensitive to dasatinib (log(GI50) = −8 in NCI-TPW, representing the highest possible sensitivity based on the screening range), and it showed a strong upregulation of HDAC5 by dasatinib (log2FC = 2.437 in NCI-TPW, baseline expression in untreated cells = 4.551 measured at 6 hr and 4.335 at 24 hr). MDA-MB-231 is a triple negative breast cancer cell line which was also sensitive to dasatinib (log(GI50) = −7.728 in NCI-TPW). Sensitivity of MDA-MB-231 to dasatinib was also previously established by earlier studies [Citation80–83]. It had low to moderate HDAC5 upregulation after treatment (log2FC = 0.648 in NCI-TPW, with baseline expression = 4.419 at 6 hr and 4.872 at 24 hr). The MDA-MB-231 cell line has been widely used as a model in studies of the role of HDAC5 in cancer and of its effect on tumour responses to a variety of antitumor agents [Citation22,Citation23,Citation54,Citation84–88]. As a negative control, we used UACC-257, a melanoma cell line which was resistant to dasatinib (log(GI50) = −4.952) and was low to moderately downregulated by the high concentration of dasatinib at 24 hr (log2FC = −0.696, baseline expression = 4.701 at 6 hr and 4.978 at 24 hr).
Our duplicate experiments measuring mRNA and protein levels of HDAC5 in these three cell lines were in general agreement with the observed direction and magnitude of transcriptional changes in the NCI-TPW dataset. They consistently confirmed upregulation of HDAC5 mRNA levels at 24 hr and protein expression at 24–32 hr after treatment with 2000 nM of dasatinib in the IGROV1 cell line. The fold changes (RQ) in mRNA levels and protein levels of HDAC5 normalized to GAPDH from one of the experiments are shown in . In that experiment, at 24 hr mRNA levels of HDAC5 in the IGROV1 cell line after treatment with dasatinib were considerably increased (), and at 32 hr the level of HDAC5 protein in that cell line was also considerably increased (). In contrast to IGROV1, in the MDA-MB-231 cell line the mRNA levels of HDAC5 remained relatively stable after dasatinib treatment, and the protein levels were slightly upregulated at 24 hr but not at 32 hr after treatment, whereas both mRNA and protein levels of HDAC5 in UACC-257 were slightly downregulated. Although we did not observe a consistent low to moderate upregulation of MDA-MB-231 on the mRNA levels which occurred in the NCI-TPW experiments, all other mRNA and protein changes in our experimental analysis were consistent with the direction and the strength of response in HDAC5 regulation in sensitive and resistant cell lines noted in the NCI-TPW data.
Figure 2. Experimental validation of transcriptional and protein levels of HDAC5 in the IGROV1, MDA-MB-231, and UACC-257 cell lines after treatment with 2000 nM of dasatinib. (a) Transcriptional changes in mRNA levels using RT-PCR. Results of two independent probes to HDAC5 are normalized to GAPDH. (b) Changes in protein levels using Western blots. Protein results are first normalized to GAPDH and then values divided by normalized untreated cells. Full blots are shown.
Vorinostat-induced changes in expression of miRNAs with potential regulatory effects on HDAC5
In a variety of normal and cancer cells, HDAC5 levels are regulated by multiple miRNAs including miR-125a-5p, miR-589-5p, miR-2861, miR-9, miR-124, and miR-217 [Citation51–58]. We used the publicly available dataset GSE69959 [Citation59] to investigate expression changes of those miRNAs in the AML cell lines KASUMI1, U937, and K562, at 6 hr after treatment with 5 μM of vorinostat as compared to the pretreatment levels. The 6 hr time point and concentration correspond to the high concentration of vorinostat in NCI-TPW, and among the three cell lines K-562 is a part of the NCI-60 panel.
The changes in expression of the five miRNAs with available data in GSE69959, averaged among the probes and technical replicates, are summarized in Figure S6. miR-125a-5p, miR-589-5p, and miR-217 were upregulated by vorinostat in all three cell lines. In contrast, miR-9 and miR-124 had a mixed response to vorinostat. They were upregulated only in a subset of the cell lines and were downregulated or had no expression change in other cell lines. No measurements were available for miR-2861.
miRNA regulons enriched with targeted genes associated with drug response
Transcriptome-wide enrichment analysis using NCI-TPW data showed that the genes regulated by miR-125a-5p, miR-589-5p, and miR-217 were significantly or nearly significantly associated with response to the high concentration of dasatinib at 24 hr whether using the LS or the KS statistics (0.0005 ≤ p ≤ 0.0567; Supplementary Table S5). The genes targeted by miR-2861 were nearly significantly associated with dasatinib response in the analysis that used the KS statistic (p = 0.0529), however they did not show a significant association when using the LS statistic (p = 0.1458). The gene sets targeted by miR-124-5p, miR-124-3p, miR-9-5p and miR-9-3p were not significantly associated with response to the high concentration of dasatinib at 24 hr (p ≥ 0.13 in all analyses).
No association with cell line response to the high concentration vorinostat at 6 or 24 hr was observed for the target genes of any of the six miRNAs. The lack of association with vorinostat response and the association with dasatinib response may be consistent with the potential roles of miR-125a-5p, miR-589-5p, and miR-217 in HDAC5 regulation. Our gene set enrichment analysis of miRNA targeted genes identified those miRNAs, for which their target genes were associated with response to each agent. Upregulation of HDAC5 after treatment was significantly associated with cell line sensitivity to dasatinib ( and ; ), consistent with the association of the target genes for these three miRNAs. Even though HDAC5 was upregulated by vorinostat in a concerted manner, as were 125a-5p, miR-589-5p, and miR-217, the increase in HDAC5 expression was not associated with response to vorinostat, consistent with the lack of association of the target genes for these miRNAs (; Supplementary Table S1; Figure S3).
YAP1 expression and transcriptional response to dasatinib
Yang et al. suggested a potential role of the master regulator YAP1 in sensitivity of tumour cells to dasatinib and in synergy between HDAC inhibitors and dasatinib [Citation66]. They found high mRNA and protein expression of YAP1 to be associated with increased dasatinib sensitivity and with increased resistance to HDAC inhibitors including vorinostat. Consistent with their findings, baseline expression of YAP1 in the NCI-TPW dataset had a very weak trend for association with sensitivity to dasatinib and with resistance to vorinostat (Spearman = −0.1927 and 0.1530, respectively; not statistically significant with p0 ≥0.1305). YAP1 showed concerted downregulation at 6 and 24 hr by the high concentration of dasatinib, and by both concentrations of vorinostat (Figure S7). A lesser degree of YAP1 downregulation by dasatinib was weakly associated with dasatinib sensitivity at 6 hr or 24 hr (
= −0.2627, −0.2326, and −0.1302 at 6 hr/low, 24 hr/low, and 24 hr/high concentrations, p0 = 0.0527, 0.1005, and 0.3728, respectively; not significant with pFDR ≥0.3518). While these trends supported the previously reported [Citation66] association of YAP1 expression with dasatinib sensitivity, YAP1 expression was not significantly associated with expression changes of any HDAC or SIRT genes at 6 or 24 hr after treatment with the high concentration of dasatinib (pFDR ≥0.1554; Supplementary Table S6). Although they were non-significant after adjustment for multiple testing, changes in YAP1 expression after dasatinib treatment were weakly negatively correlated with log2FC of HDAC2 and weakly positively correlated with log2FC of SIRT1, SIRT3, and SIRT4 (Supplementary Table S6). These correlations were in agreement with the directions of associations of log2FC of HDAC2, SIRT1, SIRT3, and SIRT4 with dasatinib sensitivity (Supplementary Table S1). However, correlations of these genes with downregulation of YAP1 were weak (0.2251 ≤ |
| ≤ 0.3059; 0.0326 ≤ p0 ≤0.0952), whereas their correlation with log(GI50) of dasatinib were strong and statistically significant. Neither baseline expression nor log2FC of YAP1 was correlated with log2FC of additional genes (HDAC5, HDAC1, SIRT2, and SIRT5; Supplementary Table S1) which were associated with dasatinib response (data not shown). These results suggest that if YAP1 is involved in dasatinib response, it may not be the main driver of the strong associations of expression changes of many HDAC and SIRT genes with dasatinib sensitivity. Upregulation of HDAC1, HDAC5, SIRT2, and SIRT5 and its potential effect on dasatinib sensitivity are likely to be influenced by other factors, which remain to be determined.
Expression of dasatinib kinase target genes was associated with transcriptional changes of HDAC and SIRT genes and with dasatinib sensitivity
Dasatinib is an inhibitor of multiple ABL and SRC family kinases and additional tyrosine kinases [Citation45,Citation67,Citation71,Citation72,Citation80,Citation83,Citation89]. Six genes encoding its targets, ABL2, CSK, EPHA2, MAP4K5, YES1, and ZAK, were downregulated in a concerted manner by dasatinib in the NCI-TPW dataset (Supplementary Table S7). All of them were downregulated at 24 hr, and some of them were also downregulated at earlier time points after treatment. None of the remaining 16 dasatinib kinase target genes satisfied the criteria for concerted expression changes under any condition. EPHA2 showed the strongest downregulation. It was downregulated at each time point (2, 6, and 24 hr) by both concentrations of dasatinib and had the largest amplitude of concerted downregulation after treatment with the high concentration (Figure S8; Supplementary Table S7). The second most frequently downregulated target gene was ABL2, with was downregulated at 6 and 24 hr by both concentrations of dasatinib (Supplementary Table S7).
Supplementary Table S8 shows Spearman correlations of expression changes and baseline expression of dasatinib kinase target genes with log(GI50) of dasatinib that satisfy pFDR <0.1. Downregulation of EPHA2, CSK, ZAK, and MAP4K5 was significantly associated with dasatinib sensitivity (0.3542 ≤ ≤0.5833; 2.97 × 10⁻⁶ ≤ p0 ≤0.0086; 0.0004 ≤ pFDR ≤0.0827). Most notably, post-treatment downregulation of EPHA2 was associated with sensitivity with pFDR ≤0.05 at each time point and each concentration. Furthermore, the correlation of downregulation of EPHA2 by the high concentration with dasatinib sensitivity was the strongest and the most significant (0.5434 ≤
≤0.5833; 2.97 × 10⁻⁶ ≤ p0 ≤5.47 × 10⁻⁵; 0.0004 ≤ pFDR ≤0.0021) among all dasatinib target genes and all conditions. Changes in PDGFRA expression at 24 hr, which did not follow a concerted pattern, were negatively associated with sensitivity (−0.3980 ≤
≤ −0.3893; 0.0038 ≤ p0 ≤0.0057; 0.0454 ≤ pFDR ≤0.0627). Sensitivity to dasatinib was also associated with increased baseline expression of PDGFRB, ABL1, YES1, and SRC (−0.3497 ≤
≤ −0.3893; 0.0038 ≤ p0 ≤0.0057; 0.0454 ≤ pFDR ≤0.0627). Multiple associations of additional target genes did not reach statistical significance (data not shown). Our findings were consistent with earlier reports of associations of dasatinib sensitivity with high baseline expression of YES1 and LYN in ovarian and breast cell lines, and of EPHA2 in ovarian, breast and prostate cell lines [Citation70,Citation90]. Elevated baseline expression of all three of these genes in the NCI-TPW dataset showed trends for association with dasatinib sensitivity; however, only association of baseline YES1 expression reached statistical significance (= −0.4245, −0.2856, and −0.2535; p0 = 0.0010, 0.0313, and 0.0571; pFDR = 0.0071, 0.1930, and 0.2615 for YES1, EPHA2, and LYN, respectively).
Expression of several dasatinib targets was significantly associated with transcriptional changes of HDAC and SIRT genes at 6 and 24 hr after treatment with the high concentration (Supplementary Table S9). The two strongest associations were for upregulation of HDAC5 at 24 hr with downregulation of EPHA2 ( = −0.6086; p0 = 3.49 × 10⁻⁶; pFDR = 0.0049) and with elevated baseline expression of YES1 (
= 0.5841; p0 = 1.05 × 10⁻⁵; pFDR = 0.0074). Upregulation of HDAC5, downregulation of EPHA2, and baseline expression of YES1 were all significantly associated with dasatinib sensitivity (; Supplementary Tables S1 and S8), suggesting an interplay among these molecular factors. In addition to its strong association with post-treatment downregulation of EPHA2, upregulation of HDAC5 at 24 hr was also strongly associated with baseline EPHA2 expression (
= 0.5841; p0 = 1.05 × 10⁻⁵; pFDR = 0.0074; Supplementary Table S9). This suggests possible direct effects of EphA2 both on transcriptional response of HDAC5 and on drug sensitivity. In addition, upregulation of HDAC5 at 24 hr was associated with increased baseline expression of ABL1 and with decreased baseline expression of CSK (
= 0.4679 and −0.4617, respectively; pFDR ≤0.0892; Supplementary Table S9).
Several additional correlations of dasatinib targets with other HDAC and SIRT genes associated with dasatinib sensitivity satisfied pFDR ≤0.01 (Supplementary Tables S1 and S9). All such correlations were positive, with ≥0.4526. They included associations of downregulation of CSK and ZAK with downregulation of HDAC2 at 24 hr, a correlation between log2FC of YES1 at 6 hr and upregulation of SIRT1, and correlations of baseline expression of ABL1 and of log2FC of LCK with upregulation of SIRT3 at 24 hr (; Supplementary Tables S7 and S9). Downregulation of CSK and ZAK and baseline expression of ABL1 were also associated with dasatinib sensitivity (Supplementary Table S8). These associations provide further support for potential interplay among the effects of different dasatinib targets, transcriptional response of HDAC and SIRT genes to dasatinib, and dasatinib sensitivity. Multiple weaker associations of various dasatinib targets with changes in HDAC and SIRT expression did not reach statistical significance but showed similar trends consistent with sensitivity to dasatinib (data not shown). For example, baseline expression and/or downregulation of EPHA2 was modestly associated with upregulation of HDAC1, SIRT1, SIRT2, SIRT3, SIRT4, and SIRT5 (0.3936 ≤ |
| ≤ 0.4460, 0.0013 ≤ p0 ≤0.0051, 0.1079 ≤ pFDR ≤0.1863). Expression of PDGFRA, PDGFRB, ABL2, BCR, FRK, MAPK14, CSF1R, and other dasatinib target genes was also weakly correlated with transcriptional changes of HDAC and SIRT genes (data not shown).
Discussion
Our study uncovered an unexpected strong significant association of HDAC5 upregulation with sensitivity to the kinase inhibitors dasatinib and erlotinib and a weaker similar trend for lapatinib sensitivity. These associations are contrary to prior reports which found the benefits of downregulating HDAC5 in tumours and detrimental effects of HDAC5 upregulation on tumour progression. Using co-immunoprecipitation and immunoblotting of HDAC5 and SOX9, treatment with the HDAC4 and HDAC5 inhibitor LMK-235, differential gene expression analysis, HDAC5 knockouts generated using CRISPR/Cas9, and HDAC5 overexpression using plasmid transfection, Xue et al. [Citation86] demonstrated that HDAC5 was essential for deacetylation and nuclear localization of SOX9, which was important for resistance to tamoxifen in breast cancer cell lines. Multiple studies that used depletion, inhibition, or overexpression of HDAC5 have shown that it participates in the maintenance of pericentric heterochromatin and cell cycle control, and in regulation of cell survival, proliferation, migration, invasion, and apoptosis [Citation8,Citation23,Citation91]. The roles of HDAC5 in repression of cyclin D3 (CCND3) levels and cell cycle regulation have been demonstrated using HDAC5 overexpression, depletion, and cytoplasmic sequestration experiments, by cell treatment with the HDAC class I and II inhibitor trichostatin A, and through serial deletions of the CCND3 promoter region [Citation91]. Using coimmunoprecipitation and deacetylation assays, and with the help of knockdown and overexpression experiments of HDAC5, Sharma et al. demonstrated the role of HDAC5 in modulation of transcriptional activity of SATB1, a genome organizer which recruits transcriptional modellers, and in promotion of aggressive features of lung adenocarcinoma in cell lines and orthotopic mouse xenograft models [Citation92]. Elevated mRNA or protein expression of HDAC5 led to an increased proliferation and invasiveness of a lung cancer cell line and was associated with inferior prognoses and clinical outcomes in patients with breast cancer and hepatocellular carcinoma [Citation22,Citation23,Citation93,Citation94]. Depletion, inhibition, or silencing of HDAC5 in breast cancer, cervical carcinoma, and melanoma cell lines, and in hepatocellular carcinoma cell lines under hypoxia delayed cell cycle progression, reduced cell proliferation, migration, invasion and survival, induced apoptosis and autophagy and increased sensitivity to the DNA damaging agents doxorubicin and cisplatin [Citation8,Citation23,Citation94,Citation95]. Similarly, silencing of HDAC5 inhibited tumour growth in melanoma mouse xenograft models [Citation95]. In glioma cell lines, cell proliferation was increased when HDAC5 was overexpressed and decreased with HDAC5 silencing [Citation24]. While these reports seemingly contradict our findings of the association of HDAC5 upregulation with sensitivity to kinase inhibitors, HDAC5 overexpression had dual effects in urothelial carcinoma cell lines, decreasing cell proliferation in multiple cell lines but increasing the epithelial-to-mesenchymal transition in one cell line [Citation88]. The latter effect may be in agreement with the HDAC5 associations observed in our study. It is possible that the differences in the directions of associations may be caused by different underlying interactions of HDAC5 with inhibitors of signalling pathways as opposed to the effect of HDAC5 on response to cytotoxic therapies.
Similar to HDAC5, the increase in HDAC1 expression was significantly associated with sensitivity to dasatinib in our study, even though the transcriptional response of HDAC1 to dasatinib was variable among the NCI-60 cell lines and did not satisfy the criteria for concerted upregulation ( and ; Figure S4). HDAC1 is involved in many important epigenetic interactions with multiple partners. It is an important factor in the regulation of chromatin remodelling, DNA methylation, transcription, and apoptosis [Citation15,Citation16,Citation30,Citation96]. While we observed an association of HDAC1 upregulation with sensitivity to dasatinib, upregulation of HDAC1 after treatment was associated with resistance to the DNA damaging agents topotecan, cisplatin, and gemcitabine. The latter result is consistent with the reports of increased resistance to the DNA damaging agent etoposide and increased multi-drug resistance to DNA damaging agents when HDAC1 levels were elevated, and of the benefits of HDAC1 silencing [Citation2,Citation29]. Our findings add to the body of evidence suggesting a potential benefit of downregulating HDAC1 levels in order to improve the efficacy of DNA damaging therapy.
Upregulation of several SIRT genes was also associated with increased sensitivity to dasatinib. Associations of SIRT3 and SIRT4 were in agreement with earlier reports about their effects on tumour suppression and on improved patient outcomes in hepatocellular carcinoma, and they are consistent with associations of higher SIRT3 expression levels with drug sensitivity in HCC cell lines [Citation32]. By contrast, associations of dasatinib sensitivity with stronger upregulation of SIRT1, SIRT2, and SIRT5 were unexpected, since these genes have tumour promoting effects, and their downregulation positively affects cancer treatment outcomes [Citation13,Citation14,Citation32,Citation78,Citation79]. Higher SIRT1 levels had been associated with resistance to the kinase inhibitor sorafenib and to multiple other antitumor agents including cisplatin, oxaliplatin, 5-fluorouracil, doxorubicin, and pirarubicin in a variety of tumours [Citation32,Citation79,Citation97]. The direction of association of SIRT2 expression changes in NCI-TPW contrasts with earlier reports of increased sensitivity to dasatinib in melanoma cell lines with SIRT2 knockdown [Citation31]. Molecular mechanisms which may explain these opposite effects of SIRT2 on dasatinib sensitivity require further investigation. They may include, e.g., pretreatment differences between non-manipulated cancer cell lines and cell lines with SIRT2 knockdown. SIRT2 silencing prior to treatment broadly impacts biological processes in the cell [Citation32], which may contribute to dasatinib response. Such pretreatment effects would be absent from the NCI-60 cell line panel profiled in the NCI-TPW dataset, which had not been genetically manipulated. While SIRT1, SIRT2, and SIRT5 may have tumour-promoting or tumour-suppressing effects depending on the tumour histology and cellular context [Citation32], the NCI-60 panel included melanoma cell lines, and therefore the differences in SIRT2 associations with dasatinib response may be caused by factors other than tumour specificity.
Among multiple associations of HDAC and SIRT mRNA expression changes with response to dasatinib and erlotinib with pFDR <0.1, only downregulation of HDAC2 was associated with increased sensitivity to dasatinib (; Supplementary Table S1). In contrast, all correlations of log2FC of HDAC1, HDAC5, SIRT1, SIRT2, SIRT3, SIRT4, and SIRT5 with log(GI50) of these agents satisfying pFDR <0.1 were negative, indicating that their higher expression levels after treatment were associated with sensitivity to these agents. It remains to be investigated whether there is a causative effect of upregulation of these HDAC and SIRT genes on sensitivity to kinase inhibitors. In untreated cells, higher levels of HDAC1 and HDAC7 (Supplementary Table S2) were similarly associated with sensitivity to the kinase inhibitors sunitinib and dasatinib, respectively. In both analyses the cell lines with increased mRNA levels of HDACs were more sensitive to kinase inhibitors, however, the gene-agent combinations with significant associations of baseline expression were different from those with significant log2FC associations. Despite these differences, if the associations of sensitivity to kinase inhibitors with HDAC upregulation and with HDAC levels in untreated cells have a common mechanism, then elevation of HDAC and SIRT levels in drug-sensitive cells after treatment is unlikely be a mere biomarker of increased cell death in response to treatment and is more likely to involve other molecular mechanisms.
We observed concerted changes in mRNA expression of HDAC and SIRT genes in response to various antitumor agents in NCI-TPW, including many cases of transcriptional upregulation. Independent datasets showed patterns similar to NCI-TPW for mRNA and protein expression changes of HDACs and SIRTs in response to dasatinib and vorinostat in malignant and non-malignant cell lines. We experimentally confirmed transcriptional and proteomic upregulation of HDAC5 by dasatinib. Our findings show considerable effects of drug treatment on expression of epigenetic factors, even when using non-epigenetic agents. Surprisingly, vorinostat upregulated transcription of HDAC1 and HDAC3, even though the products of both genes are targets of vorinostat inhibition. Vorinostat induces profound transcriptional changes in many genes [Citation34,Citation76,Citation98,Citation99], and potential clinical consequences of its role in upregulation of HDAC1, HDAC3, HDAC5, SIRT2, and other SIRT genes may need to be considered.
Among the associations with vorinostat response, only the amplitude of expression changes of SIRT2 had pFDR ≤0.1 and was associated with sensitivity to that agent (high concentration, 6 hr; = −0.4033, pFDR = 0.0909; Supplementary Table S1). Upregulation of SIRT2 by vorinostat was in agreement with transcriptional data for malignant and non-malignant cells from the GEO datasets GSE43010 [Citation47] and GSE84205 [Citation46] and the study by Kyrylenko et al. [Citation7]. SIRT2 protein levels were also upregulated by vorinostat in fibroblasts with Newman-Pick type C1 disease [Citation43]. Transcriptional upregulation of SIRT2 by the HDAC inhibitor trichostatin A in neuroblastoma cell lines had been linked to hyperacetylation of the DNA-bound histone H4 in the SIRT2 promoter region [Citation7]. Such upregulation is an example of important influence of tumour drug treatment on HDAC and SIRT expression.
Three miRNAs, miR-125a-5p, miR-589-5p, and miR-217, which regulate HDAC5, were upregulated by vorinostat in the three AML cell lines in the GEO dataset GSE69959 (Figure S6). Upregulation of miR-125a-5p by vorinostat in AML cell lines is consistent with its previously reported upregulation by another HDAC inhibitor, AR42, in the ovarian cancer cell line CP70 [Citation100].
Our transcriptome-wide enrichment analysis of NCI-TPW data found significant associations with response to the high concentration of dasatinib at 24 hr for the gene targets of the same three miRNAs, miR-125a-5p, miR-589-5p, and miR-217, which were upregulated by vorinostat in GSE69959 (Figure S6; Supplementary Table S5). The agreement between the findings from both analyses, in which the same miRNAs miR-125a-5p, miR-589-5p, and miR-217 were consistently upregulated by vorinostat and had their target genes associated with dasatinib response, may suggest potential roles of these three miRNAs in regulation of HDAC5 in response to treatment by both agents. Upregulation of miR-125a and miR-125a-5p in cancer cells by HDAC inhibitors and regulation of HDAC5 protein levels by miR-125a-5p was experimentally demonstrated [Citation54,Citation100]. It is surprising that expression of both HDAC5 and miR-125a-5p, miR-589-5p, and miR-217 was upregulated by vorinostat, as HDAC5 and miR-125a-5p were reported to negatively affect each other’s levels [Citation54,Citation101]. Similarly, miR-589-5p negatively affects HDAC5 levels, and upregulation of mir-589-5p in tumour cells by 5-aza-2-deoxycytidine downregulated HDAC5 [Citation52]. Concurrent upregulation of miR-125a-5p, miR-589-5p, and HDAC5 by vorinostat may involve additional molecular factors which remain to be identified.
miR-9 and miR-124 had a mixed response to vorinostat, as they were upregulated by vorinostat only in a subset of the AML cell lines in GSE69959. Their target genes were not associated with response to dasatinib in NCI-TPW. Both miRNAs regulate HDAC5 levels in non-malignant neural cells [Citation53,Citation57], and miR-9 is also involved in HDAC5 regulation in Waldenström macroglobulinemia, a B-cell low-grade lymphoma. It is possible that miR-9 and miR-124 may not directly regulate HDAC5 levels in response to vorinostat and dasatinib.
In addition to miRNA-mediated regulation, HDAC levels and activity are affected by multiple other post-transcriptional and post-translational regulatory mechanisms, including their interactions with other proteins and a variety of protein modifications [Citation1], some of which could affect HDAC5 after treatment with dasatinib and vorinostat. While our study examined changes in mRNA and protein levels of HDACs and SIRTs, future studies may investigate how drug treatment may affect their post-translational modifications, and the potential effects of chemotherapy on their subcellular localization, as individual HDACs and SIRTs have different distributions in cellular compartments, and some of them are dynamically shuttled between the nucleus and the cytosol [Citation42,Citation59,Citation102–104].
Our analysis showed that dasatinib induced transcriptional downregulation of its several kinase target genes (Supplementary Table S7). Our results revealed interdependence among expression of several dasatinib kinase targets, changes in expression of multiple HDAC and SIRT genes induced by dasatinib treatment, and sensitivity to that agent. The strongest associations were between downregulation of EPHA2 by dasatinib, upregulation of HDAC5, and dasatinib sensitivity. EphA2 (Ephrin Type A-Receptor 2), the product of EPHA2, is an important tyrosine kinase receptor target of dasatinib. It is frequently overexpressed in malignant cells and has been suggested to be an important factor in tumour growth, survival, metastatic processes, and angiogenesis [Citation69,Citation105] Our findings add to the body of evidence [Citation70,Citation90] suggesting the influence of EphA2 on tumour response to dasatinib. Our results further indicate that these effects of EphA2 may be mediated by HDAC5, or that HDAC5 expression may be a biomarker of such effects. Our findings underscore the complexity of interactions among the effects of dasatinib on its multiple protein kinase targets and on transcriptional regulation of HDAC and SIRT genes. Interestingly, Karwaciak et al. [Citation31] demonstrated that downregulation of SIRT2 in melanoma cell lines sensitized them to dasatinib, decreased mRNA and protein expression of EphA2, and altered mRNA expression of several other kinase target genes of dasatinib. In the NCI-TPW dataset, dasatinib sensitivity was significantly associated with the increase in SIRT2 expression and with downregulation of EPHA2 after treatment ( and ; Supplementary Tables S1, S7 and S8). At 24 hr after treatment with the high concentration, SIRT2 and EPHA2 expression changes were negatively correlated with each other ( = 0.4051, p0 = 0.0039; pFDR = 0.1610). Of note, elevated baseline expression of EPHA2 and of several other dasatinib kinase target genes, e.g., ABL1, PDGRFB, YES1, and SRC, was associated with dasatinib sensitivity and was positively correlated with upregulation of both HDAC5 and SIRT2 at 24 hr (e.g.,
= 0.5841 and 0.3570, p0 = 1.05 × 10⁻⁵ and 0.0118 for the correlations of baseline YES1 expression with upregulation of HDAC5 and SIRT2, respectively). Such pretreatment associations of dasatinib targets suggest that EphA2, YES1, and other targets may have causative influences on transcriptional regulation of HDAC and SIRT genes in response to treatment and on dasatinib sensitivity. However, the findings of Karwaciak et al. [Citation31] also suggest the presence of a feedback loop, whereby changes in the expression of SIRT2, and possibly of other HDAC or SIRT genes, may modulate the levels and activity of dasatinib kinase targets.
Xue et al. [Citation86] reported transcriptional upregulation of HDAC5 by c-Myc in tamoxifen-resistant breast cancer cells and suggested its role in resistance to tamoxifen. In NCI-TPW, after treatment with both dasatinib and vorinostat, the expression of MYC was decreased in many cell lines, including MCF-7 and T47D studied by Xue et al. [Citation86] (Figure S9). Dasatinib-induced downregulation of MYC at 2, 6, and 24 hr at both high and low concentrations satisfied the criteria for concerted changes [Citation33,Citation35]. Downregulation of MYC suggests that transcriptional upregulation of HDAC5 by both agents and its potential effect on sensitivity to dasatinib may be mediated by factors other than c-Myc.
Studies of NSCLC cell lines and patient samples noted the effect of inactivating BRAF mutations Y472C and G466V on increased sensitivity to dasatinib [Citation45,Citation71]. None of the NCI-60 cell lines have been reported to carry these inactivating mutations [Citation49]. In contrast, several NCI-60 cell lines carry the activating mutation BRAF V600E. Among them are the colorectal cell lines COLO-205 and HT29, and multiple melanoma cell lines [Citation49,Citation106]. Both colorectal cell lines and the melanoma cell line LOX were sensitive to dasatinib (log(GI50) between −7.908 and −7.657 in NCI-TPW), whereas many other melanoma cell lines with BRAF V600E were resistant to dasatinib (log(GI50) close to −5; Figure S5). It is therefore unlikely that activating or inactivating mutations in BRAF may be involved in the mechanism of association of upregulation of HDAC1, HDAC5, and SIRTs with dasatinib sensitivity.
Since upregulation of HDAC1, HDAC5, and multiple SIRTs was associated with sensitivity to dasatinib, and HDAC1, HDAC5, SIRT2, SIRT3, and SIRT4 were upregulated by vorinostat ( and ), it would be reasonable to investigate whether a combination of these agents may have a synergistic antitumor activity. To date, the phase 1 clinical trial NCT00816283 has been completed after testing this combination in patients with accelerated phase or blastic phase CML or ALL, however the trial data have not been posted [Citation107–109]. In vitro studies found synergy between vorinostat and dasatinib in pancreatic and SCLC cell lines and in SCLC cell line-derived xenografts [Citation66,Citation110]. In contrast, the NCI ALMANAC study, a comprehensive study of drug combinations which used the NCI-60 cancer panel [Citation48], found the synergy between dasatinib and vorinostat to be limited to a very small number of cell lines. The NCI-60 panel does not include either SCLC or pancreatic cell lines. Two independent studies found synergistic antitumor effects of dasatinib and vorinostat in two cell lines included in the NCI-60 panel. Among them, the CML cell line K-562 [Citation111] also showed synergy of that combination in the NCI-ALMANAC (ComboScore = 110) [Citation48]. In contrast, the synergy of vorinostat and dasatinib reported for the breast cancer cell line MCF-7 in a separate study [Citation112] was not observed in the NCI-ALMANAC (Combo Score = −93). Combi-nation studies of other HDAC inhibitors observed inhibition of the CML K-562 cell line by a combination of dasatinib with the class I HDAC inhibitor MS-275 (entinostat) [Citation113], and of thyroid cancer cell lines with dasatinib combinations with pan-histone inhibitors belinostat or panobinostat [Citation114].
Molecular interactions between dasatinib and vorinostat or other HDAC inhibitors are complex and involve multiple pathways and targets [Citation66,Citation110–112,Citation115]. Vorinostat enzymatically inhibits several HDACs and induces broad transcriptional changes in multiple genes [Citation25,Citation74–77]. The multi-kinase inhibitor dasatinib induces a variety of antitumor effects through a broad range of biological processes, including apoptosis, autophagy, necroptosis, cell cycle arrest, and immune modulation, and the response to this agent has been associated with multiple biomarkers [Citation45,Citation67,Citation71,Citation80,Citation83,Citation89,Citation116]. Interactions between dasatinib and vorinostat may involve additional mechanisms beyond transcriptional upregulation of HDAC and SIRT genes. Examples of such mechanisms were suggested by Mahendrarajah et al. [Citation113] who attributed the synergy between MS-275 and dasatinib in the K-562 cell line to inactivation of p-ACK1 and p-STAT3, and by Chan et al. [Citation114] who noted that thyroid cancer cell lines sensitive to dasatinib combinations with HDAC inhibitors carried mutations in the components of the MAPK pathway. Yang et al. [Citation66] suggested that YAP1 and other components of Hippo signalling contribute to synergy between HDAC inhibitors and dasatinib sensitivity. We observed weak, non-statistically significant trends for associations of YAP1 expression with the NCI-60 cell line responses to vorinostat and dasatinib, in the same directions as those reported by Yang et al. [Citation66] However, while expression changes of many HDAC and SIRT genes in the NCI-TPW dataset were strongly and significantly associated with dasatinib sensitivity (; Supplementary Table S1), they had only a weak or no association with YAP1 expression (Supplementary Table S6). This suggests that YAP1 may not be the main driver of the biological links between transcriptional changes of HDAC and SIRT genes and dasatinib sensitivity. In addition, the majority of the studies of combinations of HDAC inhibitors and dasatinib in vitro used simultaneous treatment with both inhibitors. In order to investigate whether upregulation of the genes encoding histone deacetylases enhances the potency of dasatinib, future drug combination studies of HDAC inhibitors and dasatinib may benefit from a sequential drug treatment, providing a sufficient time for transcriptional upregulation between treatments by different agents. If conducted in specific tumour categories, such analysis could avoid potential differences among tumour histologies in drug response and in HDAC and SIRT expression.
Our study provides a novel summary of the effects of 15 antitumor agents on transcriptional changes of HDACs and SIRTs. Additionally, our investigation of associations of drug response with baseline expression and expression changes of HDAC and SIRT genes revealed previously unknown associations between upregulation of several HDAC and SIRT genes and sensitivity of cancer cell lines to kinase inhibitors. Further investigation may reveal whether such upregulation has a causal effect or is a biomarker of sensitive cells responding to treatment. If these associations are causative, they may need to be considered during chemotherapy treatment.
Conclusions
Our analysis revealed concerted upregulation and downregulation of multiple HDAC and SIRT genes in response to cell line treatment with approved chemotherapy agents. The amplitude of transcriptional upregulation of HDAC5, HDAC1, and several SIRT genes after drug treatment was associated with sensitivity to kinase inhibitors. The strongest associations were observed with sensitivity to dasatinib. The transcriptional effect of cancer drug treatment on genes encoding histone deacetylases may be worthy of further investigation for potential clinical implications.
Authors’ contributions
JK conceived the study and performed bioinformatic analyses of concerted gene changes, association analyses, and collected and analysed independent mRNA and protein expression datasets to validate the study findings. YZ generated computer-processed NCI-TPW gene expression and drug response datasets and performed bioinformatic analysis of miRNA regulons. KR performed data extraction and initial bioinformatic analysis of correlations between gene expression and drug response. DW, WZ, AB, and REP designed or performed experimental validation of mRNA and proteomic upregulation of HDAC5. LMM and YZ oversaw the computational analysis and provided statistical support. JHD oversaw this study, provided clinical guidance and guided experimental validation, and oversaw the NCI-TPW project. JK, YZ, DW, and REP drafted the manuscript. All authors participated in the interpretation of the study results, edited the manuscript, and read and approved its final version.
Supplemental Material
Download Zip (3.7 MB)Acknowledgments
We thank the editor, Dr. Manel Esteller, and anonymous reviewers for their helpful suggestions. We also thank Dr. Carmela Dell’Aversana (Institute Experimental Endocrinology and Oncology “G.Salvatore”- National Research Council and Dep. of Precision Medicine- Università degli Studi della Campania “L. Vanvitelli”, Italy) for providing helpful details about the NCBI GEO gene expression dataset, GSE69959. We are grateful to Drs. Michael Difilippantonio, Beverly A. Teicher, Nathan P. Coussens, and Mariam Konaté (National Cancer Institute, USA) for helpful discussions of this study.
The views expressed in this article are the personal opinions of the authors and do not necessarily reflect policy of the US National Cancer Institute.
Data availability statement
The datasets analysed in the current study are publicly available from the NCI-TPW portal, [https://tpwb.nci.nih.gov] [Citation33] (NCI-TPW drug response data, gene expression changes, and baseline gene expression data and their graphical presentation) and NCBI GEO, [https://www.ncbi.nlm.nih.gov/geo/] (public datasets used for validation of HDAC and SIRT and miRNA expression changes in response to drug treatment). The dataset of mRNA and protein changes of HDAC5 in the IGROV1, MDA-MB-231, and UACC-257 cell lines in response to dasatinib used during the current study is available from the corresponding author on reasonable request.
Disclosure statement
No potential conflict of interest was reported by the authors.
Supplementary material
Supplemental data for this article can be accessed online at https://doi.org/10.1080/15592294.2024.2309824
Additional information
Funding
References
- Seto E, Yoshida M. Erasers of histone acetylation: the histone deacetylase enzymes. Cold Spring Harb Perspect Biol. 2014;6(4):a018713. doi: 10.1101/cshperspect.a018713
- Witt O, Deubzer HE, Milde T, et al. HDAC family: what are the cancer relevant targets? Cancer Lett. 2009;277(1):8–29. doi: 10.1016/j.canlet.2008.08.016
- Roche J, Bertrand P. Inside HDACs with more selective HDAC inhibitors. Eur J Med Chem. 2016;121:451–483. doi: 10.1016/j.ejmech.2016.05.047
- Milazzo G, Mercatelli D, Di Muzio G, Triboli L, De Rosa P, Perini G, Giorgi FM. Histone deacetylases (HDACs): evolution, specificity, role in transcriptional complexes, and pharmacological actionability. Genes (Basel). 2020;11(5):556. doi: 10.3390/genes11050556
- Manna S, Mishra J, Baral T, et al. Epigenetic signaling and crosstalk in regulation of gene expression and disease progression. Epigenomics. 2023;15(14):723–740. doi: 10.2217/epi-2023-0235
- Parbin S, Kar S, Shilpi A, et al. Histone deacetylases: a saga of perturbed acetylation homeostasis in cancer. J Histochem Cytochem. 2014;62(1):11–33. doi: 10.1369/0022155413506582
- Kyrylenko S, Kyrylenko O, Suuronen T, et al. Differential regulation of the Sir2 histone deacetylase gene family by inhibitors of class I and II histone deacetylases. Cell Mol Life Sci. 2003;60(9):1990–7. doi: 10.1007/s00018-003-3090-z
- Peixoto P, Castronovo V, Matheus N, et al. HDAC5 is required for maintenance of pericentric heterochromatin, and controls cell-cycle progression and survival of human cancer cells. Cell Death Differ. 2012;19(7):1239–1252. doi: 10.1038/cdd.2012.3
- Curry AM, White DS, Donu D, et al. Human sirtuin regulators: the “success” stories. Front Physiol. 2021;12:752117. doi: 10.3389/fphys.2021.752117
- Fortuny L, Sebastian C. Sirtuins as metabolic regulators of immune cells phenotype and function. Genes (Basel). 2021;12(11):1698. doi: 10.3390/genes12111698
- Poralla L, Stroh T, Erben U, et al. Histone deacetylase 5 regulates the inflammatory response of macrophages. J Cell Mol Med. 2015;19(9):2162–71. doi: 10.1111/jcmm.12595
- Kumar J, Kumar S. Sirtuin1 in vascular endothelial function, an overview. Epigenetics. 2022;17(9):953–969. doi: 10.1080/15592294.2021.1975936
- Zheng M, Hu C, Wu M, et al. Emerging role of SIRT2 in non-small cell lung cancer (review). Oncol Lett. 2021;22(4):731. doi: 10.3892/ol.2021.12992
- Fajardo-Orduna GR, Ledesma-Martinez E, Aguiniga-Sanchez I, et al. Role of SIRT1 in chemoresistant leukemia. Int J Mol Sci. 2023;24(19):14470. doi: 10.3390/ijms241914470
- Bronner C. Control of DNMT1 abundance in epigenetic inheritance by acetylation, ubiquitylation, and the histone code. Sci Signal. 2011;4(157):pe3. doi: 10.1126/scisignal.2001764
- Fuks F, Burgers WA, Brehm A, et al. DNA methyltransferase Dnmt1 associates with histone deacetylase activity. Nat Genet. 2000;24(1):88–91. doi: 10.1038/71750
- Patra SK, Patra A, Dahiya R. Histone deacetylase and DNA methyltransferase in human prostate cancer. Biochem Biophys Res Commun. 2001;287(3):705–713. doi: 10.1006/bbrc.2001.5639
- Huang L. Targeting histone deacetylases for the treatment of cancer and inflammatory diseases. J Cell Physiol. 2006;209(3):611–6. doi: 10.1002/jcp.20781
- Vleeshouwer-Neumann T, Phelps M, Bammler TK, et al. Histone deacetylase inhibitors antagonize distinct pathways to suppress tumorigenesis of embryonal rhabdomyosarcoma. PLoS One. 2015;10(12):e0144320. doi: 10.1371/journal.pone.0144320
- Kar S, Niharika, Roy A, et al. Overexpression of SOX2 gene by histone modifications: SOX2 enhances human prostate and breast cancer progression by prevention of apoptosis and enhancing cell proliferation. Oncology (Basel). 2023;101(9):591–608. doi: 10.1159/000531195
- Azad N, Zahnow CA, Rudin CM, et al. The future of epigenetic therapy in solid tumours - lessons from the past. Nat Rev Clin Oncol. 2013;10(5):256–266. doi: 10.1038/nrclinonc.2013.42
- Oltra SS, Cejalvo JM, Tormo E, et al. HDAC5 inhibitors as a potential treatment in breast cancer affecting very young women. Cancers (Basel). 2020;12(2):412. doi: 10.3390/cancers12020412
- Li A, Liu Z, Li M, et al. HDAC5, a potential therapeutic target and prognostic biomarker, promotes proliferation, invasion and migration in human breast cancer. Oncotarget. 2016;7(25):37966–37978. doi: 10.18632/oncotarget.9274
- Liu Q, Zheng JM, Chen JK, et al. Histone deacetylase 5 promotes the proliferation of glioma cells by upregulation of notch 1. Mol Med Rep. 2014;10(4):2045–50. doi: 10.3892/mmr.2014.2395
- Li Y, Seto E. HDACs and HDAC inhibitors in cancer development and therapy. Cold Spring Harb Perspect Med. 2016;6(10):a026831. doi: 10.1101/cshperspect.a026831
- Hanigan CL, van Engeland M, De Bruine AP, et al. An inactivating mutation in HDAC2 leads to dysregulation of apoptosis mediated by APAF1. Gastroenterology. 2008;135(5):1654–1664. doi: 10.1053/j.gastro.2008.07.078
- Kiweler N, Schwarz H, Nguyen A, et al. The epigenetic modifier HDAC2 and the checkpoint kinase ATM determine the responses of microsatellite instable colorectal cancer cells to 5-fluorouracil. Cell Biol Toxicol. 2023;39(5):2401–2419. doi: 10.1007/s10565-022-09731-3
- Zhu P, Martin E, Mengwasser J, et al. Induction of HDAC2 expression upon loss of APC in colorectal tumorigenesis. Cancer Cell. 2004;5(5):455–463. doi: 10.1016/S1535-6108(04)00114-X
- Keshelava N, Davicioni E, Wan Z, et al. Histone deacetylase 1 gene expression and sensitization of multidrug-resistant neuroblastoma cell lines to cytotoxic agents by depsipeptide. J Natl Cancer Inst. 2007;99(14):1107–19. doi: 10.1093/jnci/djm044
- Bandyopadhyay D, Mishra A, Medrano EE. Overexpression of histone deacetylase 1 confers resistance to sodium butyrate-mediated apoptosis in melanoma cells through a p53-mediated pathway. Cancer Res. 2004;64(21):7706–7710. doi: 10.1158/0008-5472.CAN-03-3897
- Karwaciak I, Salkowska A, Karas K, et al. SIRT2 contributes to the resistance of melanoma cells to the multikinase inhibitor dasatinib. Cancers (Basel). 2019;11(5):673. doi: 10.3390/cancers11050673
- Ceballos MP, Quiroga AD, Palma NF. Role of sirtuins in hepatocellular carcinoma progression and multidrug resistance: mechanistical and pharmacological perspectives. Biochem Pharmacol. 2023;212:115573. doi: 10.1016/j.bcp.2023.115573
- Monks A, Zhao Y, Hose C, et al. The NCI transcriptional pharmacodynamics workbench: a tool to examine dynamic expression profiling of therapeutic response in the NCI-60 cell line panel. Cancer Res. 2018;78(24):6807–6817. doi: 10.1158/0008-5472.CAN-18-0989
- Krushkal J, Zhao Y, Hose C, et al. Concerted changes in transcriptional regulation of genes involved in DNA methylation, demethylation, and folate-mediated one-carbon metabolism pathways in the NCI-60 cancer cell line panel in response to cancer drug treatment. Clin Epigenetics. 2016;8(1):73. doi: 10.1186/s13148-016-0240-3
- Krushkal J, Zhao Y, Hose C, et al. Longitudinal transcriptional response of glycosylation-related genes, regulators, and targets in cancer cell lines treated with 11 antitumor agents. Cancer Inform. 2017;16. doi: 10.1177/1176935117747259
- Pleyer L, Greil R. Digging deep into “dirty” drugs – modulation of the methylation machinery. Drug Metab Rev. 2015;47(2):252–279. doi: 10.3109/03602532.2014.995379
- Lamb J, Crawford ED, Peck D, et al. The connectivity map: using gene-expression signatures to connect small molecules, genes, and disease. Science. 2006;313(5795):1929–35. doi: 10.1126/science.1132939
- Holbeck SL, Collins JM, Doroshow JH. Analysis of Food and Drug Administration-approved anticancer agents in the NCI60 panel of human tumor cell lines. Mol Cancer Ther. 2010;9(5):1451–1460. doi: 10.1158/1535-7163.MCT-10-0106
- Irizarry RA, Hobbs B, Collin F, et al. Exploration, normalization, and summaries of high density oligonucleotide array probe level data. Biostatistics. 2003;4(2):249–264. doi: 10.1093/biostatistics/4.2.249
- Benjamini Y, Hochberg Y. Controlling the false discovery rate: a practical and powerful approach to multiple testing. J R Statist Soc. 1995;57(1):289–300. doi: 10.1111/j.2517-6161.1995.tb02031.x
- Zhang P, Palmisano A, Kumar R, et al. TPWshiny: an interactive R/Shiny app to explore cell line transcriptional responses to anti-cancer drugs. Bioinformatics. 2022;38(2):570–572. doi: 10.1093/bioinformatics/btab619
- Zhu X, Liu X, Cheng Z, et al. Quantitative analysis of global proteome and lysine acetylome reveal the differential impacts of VPA and SAHA on HL60 cells. Sci Rep. 2016;6(1):19926. doi: 10.1038/srep19926
- Subramanian K, Rauniyar N, Lavallee-Adam M, et al. Quantitative analysis of the proteome response to the histone deacetylase inhibitor (HDACi) vorinostat in Niemann-Pick type C1 disease. Mol & Cell Proteomics. 2017;16(11):1938–1957. doi: 10.1074/mcp.M116.064949
- Asmussen J, Lasater EA, Tajon C, et al. MEK-dependent negative feedback underlies BCR-ABL-mediated oncogene addiction. Cancer Discov. 2014;4(2):200–215. doi: 10.1158/2159-8290.CD-13-0235
- Peng S, Sen B, Mazumdar T, et al. Dasatinib induces DNA damage and activates DNA repair pathways leading to senescence in non-small cell lung cancer cell lines with kinase-inactivating BRAF mutations. Oncotarget. 2016;7(1):565–79. doi: 10.18632/oncotarget.6376
- Malone CF, Emerson C, Ingraham R, et al. mTOR and HDAC inhibitors converge on the TXNIP/thioredoxin pathway to cause catastrophic oxidative stress and regression of RAS-driven tumors. Cancer Discov. 2017;7(12):1450–1463. doi: 10.1158/2159-8290.CD-17-0177
- Bolden JE, Shi W, Jankowski K, et al. HDAC inhibitors induce tumor-cell-selective pro-apoptotic transcriptional responses. Cell Death Dis. 2013;4(2):e519. doi: 10.1038/cddis.2013.9
- Holbeck SL, Camalier R, Crowell JA, et al. The National Cancer Institute ALMANAC: a comprehensive screening resource for the detection of anticancer drug pairs with enhanced therapeutic activity. Cancer Res. 2017;77(13):3564–3576. doi: 10.1158/0008-5472.CAN-17-0489
- Abaan OD, Polley EC, Davis SR, et al. The exomes of the NCI-60 panel: a genomic resource for cancer biology and systems pharmacology. Cancer Res. 2013;73(14):4372–82. doi: 10.1158/0008-5472.CAN-12-3342
- Reinhold WC, Sunshine M, Liu H, et al. CellMiner: a web-based suite of genomic and pharmacologic tools to explore transcript and drug patterns in the NCI-60 cell line set. Cancer Res. 2012;72(14):3499–511. doi: 10.1158/0008-5472.CAN-12-1370
- Yang J, Gong CJ, Ke QJ, et al. Insights into the function and clinical application of HDAC5 in cancer management. Front Oncol. 2021;11:11. doi: 10.3389/fonc.2021.661620
- Liu CH, Lv DS, Li M, et al. Hypermethylation of miRNA-589 promoter leads to upregulation of HDAC5 which promotes malignancy in non-small cell lung cancer. Int J Oncol. 2017;50(6):2079–2090. doi: 10.3892/ijo.2017.3967
- Gu X, Fu CC, Lin LF, et al. miR-124 and miR-9 mediated downregulation of HDAC5 promotes neurite development through activating MEF2C-GPM6A pathway. J Cell Physiol. 2018;233(1):673–687. doi: 10.1002/jcp.25927
- Hsieh TH, Hsu CY, Tsai CF, et al. HDAC inhibitors target HDAC5, upregulate microRNA-125a-5p, and induce apoptosis in breast cancer cells. Mol Ther. 2015;23(4):656–66. doi: 10.1038/mt.2014.247
- Li H, Xie H, Liu W, et al. A novel microRNA targeting HDAC5 regulates osteoblast differentiation in mice and contributes to primary osteoporosis in humans. J Clin Invest. 2009;119(12):3666–3677. doi: 10.1172/JCI39832
- Roccaro AM, Sacco A, Jia X, et al. microRNA-dependent modulation of histone acetylation in Waldenström macroglobulinemia. Blood. 2010;116(9):1506–14. doi: 10.1182/blood-2010-01-265686
- Dong N, Xu B, Shi H, et al. Baicalein inhibits amadori-glycated albumin-induced MCP-1 expression in retinal ganglion cells via a microRNA-124-dependent mechanism. Invest Ophthalmol Vis Sci. 2015;56(10):5844–5853. doi: 10.1167/iovs.15-17444
- Shi L, Tian Z, Fu Q, et al. miR-217-regulated MEF2D-HDAC5/ND6 signaling pathway participates in the oxidative stress and inflammatory response after cerebral ischemia. Brain Res. 2020;1739:146835. doi: 10.1016/j.brainres.2020.146835
- Dell’Aversana C, Giorgio C, D’Amato L, et al. miR-194-5p/BCLAF1 deregulation in AML tumorigenesis. Leukemia. 2017;31(11):2315–2325. doi: 10.1038/leu.2017.64
- Sweeney BA, Petrov AI, Ribas CE, et al. RNA central 2021: secondary structure integration, improved sequence search and new member databases. Nucleic Acids Res. 2021;49(D1):D212–D220. doi: 10.1093/nar/gkaa921
- Kozomara A, Birgaoanu M, Griffiths-Jones S. miRBase: from microRNA sequences to function. Nucleic Acids Res. 2019;47(D1):D155–D162. doi: 10.1093/nar/gky1141
- Simon R, Lam A, Li MC, et al. Analysis of gene expression data using BRB-ArrayTools. Cancer Inform. 2007;3:11–7. doi: 10.1177/117693510700300022
- Xu X, Zhao Y, Simon R. Gene set expression comparison kit for BRB-ArrayTools. Bioinformatics. 2008;24(1):137–9. doi: 10.1093/bioinformatics/btm541
- Huang HY, Lin YC, Li J, et al. miRtarbase 2020: updates to the experimentally validated microRNA-target interaction database. Nucleic Acids Res. 2020;48(D1):D148–D154. doi: 10.1093/nar/gkz896
- Hsu SD, Lin FM, Wu WY, et al. miRTarBase: a database curates experimentally validated microRNA–target interactions. Nucleic Acids Res. 2011;39(suppl_1):D163–D169. doi: 10.1093/nar/gkq1107
- Yang H, Sun B, Xu K, et al. Pharmaco-transcriptomic correlation analysis reveals novel responsive signatures to HDAC inhibitors and identifies Dasatinib as a synergistic interactor in small-cell lung cancer. EBioMedicine. 2021;69:103457. doi: 10.1016/j.ebiom.2021.103457
- Rix U, Hantschel O, Durnberger G, et al. Chemical proteomic profiles of the BCR-ABL inhibitors imatinib, nilotinib, and dasatinib reveal novel kinase and nonkinase targets. Blood. 2007;110(12):4055–63. doi: 10.1182/blood-2007-07-102061
- Wishart DS, Feunang YD, Guo AC, et al. DrugBank 5.0: a major update to the DrugBank database for 2018. Nucleic Acids Res. 2018;46(D1):D1074–D1082. doi: 10.1093/nar/gkx1037
- Chang Q, Jorgensen C, Pawson T, et al. Effects of dasatinib on EphA2 receptor tyrosine kinase activity and downstream signalling in pancreatic cancer. Br J Cancer. 2008;99(7):1074–82. doi: 10.1038/sj.bjc.6604676
- Konecny GE, Glas R, Dering J, et al. Activity of the multikinase inhibitor dasatinib against ovarian cancer cells. Br J Cancer. 2009;101(10):1699–708. doi: 10.1038/sj.bjc.6605381
- Sen B, Peng S, Tang X, et al. Kinase-impaired BRAF mutations in lung cancer confer sensitivity to dasatinib. Sci Transl Med. 2012;4(136):136ra70. doi: 10.1126/scitranslmed.3003513
- Wong JP, Todd JR, Finetti MA, et al. Dual targeting of PDGFR⍺ and FGFR1 displays synergistic efficacy in malignant rhabdoid tumors. Cell Rep. 2016;17(5):1265–1275. doi: 10.1016/j.celrep.2016.10.005
- Rodriguez-Agustin A, Casanova V, Grau-Exposito J, et al. Immunomodulatory activity of the tyrosine kinase inhibitor dasatinib to elicit NK cytotoxicity against cancer, HIV infection and aging. Pharmaceutics. 2023;15(3):917. doi: 10.3390/pharmaceutics15030917
- Lee J, Huang S. Cancer epigenetics: mechanisms and crosstalk of a HDAC inhibitor, vorinostat. Chemotherapy. 2013;2(111):14934. doi: 10.4172/2167-7700.1000111
- Bhatla T, Wang J, Morrison DJ, et al. Epigenetic reprogramming reverses the relapse-specific gene expression signature and restores chemosensitivity in childhood B-lymphoblastic leukemia. Blood. 2012;119(22):5201–10. doi: 10.1182/blood-2012-01-401687
- LaBonte MJ, Wilson PM, Fazzone W, et al. DNA microarray profiling of genes differentially regulated by the histone deacetylase inhibitors vorinostat and LBH589 in colon cancer cell lines. BMC Med Genomics. 2009;2(1):67. doi: 10.1186/1755-8794-2-67
- Li CT, Hsiao YM, Wu TC, et al. Vorinostat, SAHA, represses telomerase activity via epigenetic regulation of telomerase reverse transcriptase in non-small cell lung cancer cells. J Cell Biochem. 2011;112(10):3044–3053. doi: 10.1002/jcb.23229
- Abril YLN, Fernandez IR, Hong JY, et al. Pharmacological and genetic perturbation establish SIRT5 as a promising target in breast cancer. Oncogene. 2021;40(9):1644–1658. doi: 10.1038/s41388-020-01637-w
- Yousafzai NA, Jin H, Ullah M, et al. Recent advances of SIRT1 and implications in chemotherapeutics resistance in cancer. Am J Cancer Res. 2021;11(11):5233–5248.
- Pichot CS, Hartig SM, Xia L, et al. Dasatinib synergizes with doxorubicin to block growth, migration, and invasion of breast cancer cells. Br J Cancer. 2009;101(1):38–47. doi: 10.1038/sj.bjc.6605101
- Lehmann BD, Bauer JA, Chen X, et al. Identification of human triple-negative breast cancer subtypes and preclinical models for selection of targeted therapies. J Clin Invest. 2011;121(7):2750–67. doi: 10.1172/JCI45014
- Huang F, Reeves K, Han X, et al. Identification of candidate molecular markers predicting sensitivity in solid tumors to dasatinib: rationale for patient selection. Cancer Res. 2007;67(5):2226–38. doi: 10.1158/0008-5472.CAN-06-3633
- Finn RS, Dering J, Ginther C, et al. Dasatinib, an orally active small molecule inhibitor of both the src and abl kinases, selectively inhibits growth of basal-type/“triple-negative’’ breast cancer cell lines growing in vitro. Breast Cancer Res Tr. 2007;105(3):319–326. doi: 10.1007/s10549-006-9463-x
- Cao C, Vasilatos SN, Bhargava R, et al. Functional interaction of histone deacetylase 5 (HDAC5) and lysine-specific demethylase 1 (LSD1) promotes breast cancer progression. Oncogene. 2017;36(1):133–145. doi: 10.1038/onc.2016.186
- Cao C, Wu H, Vasilatos SN, et al. HDAC5-LSD1 axis regulates antineoplastic effect of natural HDAC inhibitor sulforaphane in human breast cancer cells. Int J Cancer. 2018;143(6):1388–1401. doi: 10.1002/ijc.31419
- Xue Y, Lian WW, Zhi JQ, et al. HDAC5-mediated deacetylation and nuclear localisation of SOX9 is critical for tamoxifen resistance in breast cancer. Br J Cancer. 2019;121(12):1039–1049. doi: 10.1038/s41416-019-0625-0
- Zhou Q, Chaerkady R, Shaw PG, et al. Screening for therapeutic targets of vorinostat by SILAC-based proteomic analysis in human breast cancer cells. Proteomics. 2010;10(5):1029–39. doi: 10.1002/pmic.200900602
- Vasudevan AAJ, Hoffmann MJ, Beck MLC, et al. HDAC5 expression in urothelial carcinoma cell lines inhibits long-term proliferation but can promote epithelial-to-mesenchymal transition. Int J Mol Sci. 2019;20(9):2135. doi: 10.3390/ijms20092135
- Barbarin A, Abdallah M, Lefèvre L, et al. Innate T-αβ lymphocytes as new immunological components of anti-tumoral “off-target” effects of the tyrosine kinase inhibitor dasatinib. Sci Rep-UK. 2020;10(1). doi: 10.1038/s41598-020-60195-z
- Wang XD, Reeves K, Luo FR, et al. Identification of candidate predictive and surrogate molecular markers for dasatinib in prostate cancer: rationale for patient selection and efficacy monitoring. Genome Biol. 2007;8(11):R255. doi: 10.1186/gb-2007-8-11-r255
- Roy S, Shor AC, Bagui TK, et al. Histone deacetylase 5 represses the transcription of cyclin D3. J Cell Biochem. 2008;104(6):2143–54. doi: 10.1002/jcb.21771
- Sharma S, Tyagi W, Tamang R, et al. HDAC5 modulates SATB1 transcriptional activity to promote lung adenocarcinoma. Br J Cancer. 2023;129(4):586–600. doi: 10.1038/s41416-023-02341-8
- Zhong L, Sun S, Yao S, et al. Histone deacetylase 5 promotes the proliferation and invasion of lung cancer cells. Oncol Rep. 2018;40(4):2224–2232. doi: 10.3892/or.2018.6591
- Ye M, Fang Z, Gu H, et al. Histone deacetylase 5 promotes the migration and invasion of hepatocellular carcinoma via increasing the transcription of hypoxia-inducible factor-1⍺ under hypoxia condition. Tumor Biol. 2017;39(6):1010428317705034. doi: 10.1177/1010428317705034
- Liu JQ, Gu JY, Feng ZH, et al. Both HDAC5 and HDAC6 are required for the proliferation and metastasis of melanoma cells. J Transl Med. 2016;14(1). doi: 10.1186/s12967-015-0753-0
- Delcuve GP, Khan DH, Davie JR. Roles of histone deacetylases in epigenetic regulation: emerging paradigms from studies with inhibitors. Clin Epigenetics. 2012;4(1):5. doi: 10.1186/1868-7083-4-5
- Zhao B, Wang YC, Zhao X, et al. SIRT1 enhances oxaliplatin resistance in colorectal cancer through microRNA-20b-3p/DEPDC1 axis. Cell Biol Int. 2022;46(12):2107–2117. doi: 10.1002/cbin.11905
- Li WB, Sun Z. Mechanism of action for HDAC inhibitors—insights from omics approaches. Int J Mol Sci. 2019;20(7):1616. doi: 10.3390/ijms20071616
- Claerhout S, Lim JY, Choi W, et al. Gene expression signature analysis identifies vorinostat as a candidate therapy for gastric cancer. PLoS One. 2011;6(9):e24662. doi: 10.1371/journal.pone.0024662
- Balch C, Naegeli K, Nam S, et al. A unique histone deacetylase inhibitor alters microRNA expression and signal transduction in chemoresistant ovarian cancer cells. Cancer Biol Ther. 2012;13(8):681–693. doi: 10.4161/cbt.20086
- Huang WT, Tsai YH, Chen SH, et al. HDAC2 and HDAC5 up-regulations modulate survivin and miR-125a-5p expressions and promote hormone therapy resistance in estrogen receptor positive breast cancer cells. Front Pharmacol. 2017;8:902. doi: 10.3389/fphar.2017.00902
- Yanagisawa S, Baker JR, Vuppusetty C, et al. The dynamic shuttling of SIRT1 between cytoplasm and nuclei in bronchial epithelial cells by single and repeated cigarette smoke exposure. PLoS One. 2018;13(3):e0193921. doi: 10.1371/journal.pone.0193921
- Kong Y, Jung M, Wang K, et al. Histone deacetylase cytoplasmic trapping by a novel fluorescent HDAC inhibitor. Mol Cancer Ther. 2011;10(9):1591–9. doi: 10.1158/1535-7163.MCT-10-0779
- Bergmann L, Lang AD, Bross C, et al. Subcellular localization and mitotic interactome analyses identify SIRT4 as a centrosomally localized and microtubule associated protein. Cells (Basel). 2020;9(9):1950. doi: 10.3390/cells9091950
- Nieto-Sampedro M, Valle-Argos B, Gómez-Nicola D, et al. Inhibitors of glioma growth that reveal the tumour to the immune system. Clin Med Insights-On. 2011;5:265–314. doi: 10.4137/CMO.S7685
- Krushkal J, Negi S, Yee LM, et al. Molecular genomic features associated with in vitro response of the NCI-60 cancer cell line panel to natural products. Mol Oncol. 2021;15(2):381–406. doi: 10.1002/1878-0261.12849
- Muselli F, Peyron JF, Mary D. Druggable biochemical pathways and potential therapeutic alternatives to target leukemic stem cells and eliminate the residual disease in chronic myeloid leukemia. Int J Mol Sci. 2019;20(22):5616. doi: 10.3390/ijms20225616
- Nebbioso A, Carafa V, Benedetti R, et al. Trials with ‘epigenetic’ drugs: an update. Mol Oncol. 2012;6(6):657–82. doi: 10.1016/j.molonc.2012.09.004
- Massimino M, Stella S, Tirro E, et al. Non ABL-directed inhibitors as alternative treatment strategies for chronic myeloid leukemia. Mol Cancer. 2018;17(1):56. doi: 10.1186/s12943-018-0805-1
- Chien W, Sudo M, Ding LW, et al. Functional genome-wide screening identifies targets and pathways sensitizing pancreatic cancer cells to dasatinib. J Cancer. 2018;9(24):4762–4773. doi: 10.7150/jca.25138
- Fiskus W, Pranpat M, Balasis M, et al. Cotreatment with vorinostat (suberoylanilide hydroxamic acid) enhances activity of dasatinib (BMS-354825) against imatinib mesylate-sensitive or imatinib mesylate-resistant chronic myelogenous leukemia cells. Clin Cancer Res. 2006;12(19):5869–5878. doi: 10.1158/1078-0432.CCR-06-0980
- Wu YS, Quan Y, Zhang DX, et al. Synergistic inhibition of breast cancer cell growth by an epigenome-targeting drug and a tyrosine kinase inhibitor. Biol Pharm Bull. 2017;40(10):1747–1753. doi: 10.1248/bpb.b17-00360
- Mahendrarajah N, Paulus R, Kramer OH. Histone deacetylase inhibitors induce proteolysis of activated CDC42-associated kinase-1 in leukemic cells. J Cancer Res Clin Oncol. 2016;142(11):2263–73. doi: 10.1007/s00432-016-2229-x
- Chan D, Zheng Y, Tyner JW, et al. Belinostat and panobinostat (HDACI): in vitro and in vivo studies in thyroid cancer. J Cancer Res Clin Oncol. 2013;139(9):1507–14. doi: 10.1007/s00432-013-1465-6
- Heo SK, Noh EK, Yoon DJ, et al. Dasatinib accelerates valproic acid-induced acute myeloid leukemia cell death by regulation of differentiation capacity. PLoS One. 2014;9(2):e98859. doi: 10.1371/journal.pone.0098859
- Zhang J, Chen Y, He QY. Distinct characteristics of dasatinib-induced pyroptosis in gasdermin E-expressing human lung cancer A549 cells and neuroblastoma SH-SY5Y cells. Oncol Lett. 2020;20(1):145–154. doi: 10.3892/ol.2020.12406