
 ?Mathematical formulae have been encoded as MathML and are displayed in this HTML version using MathJax in order to improve their display. Uncheck the box to turn MathJax off. This feature requires Javascript. Click on a formula to zoom.
ABSTRACT
Gliomas are malignant tumours of the human nervous system with different World Health Organization (WHO) classifications, glioblastoma (GBM) with higher grade and are more malignant than lower-grade glioma (LGG). To dissect how the DNA methylation heterogeneity in gliomas is influenced by the complex cellular composition of the tumour immune microenvironment, we first compared the DNA methylation profiles of purified human immune cells and bulk glioma tissue, stratifying three tumour immune microenvironmental subtypes for GBM and LGG samples from The Cancer Genome Atlas (TCGA). We found that more intermediate methylation sites were enriched in glioma tumour tissues, and used the Proportion of sites with Intermediate Methylation (PIM) to compare intertumoral DNA methylation heterogeneity. A larger PIM score reflected stronger DNA methylation heterogeneity. Enhanced DNA methylation heterogeneity was associated with stronger immune cell infiltration, better survival rates, and slower tumour progression in glioma patients. We then created a Cell-type-associated DNA Methylation Heterogeneity Contribution (CMHC) score to explore the impact of different immune cell types on heterogeneous CpG site (CpGct) in glioma tissues. We identified eight prognosis-related CpGct to construct a risk score: the Cell-type-associated DNA Methylation Heterogeneity Risk (CMHR) score. CMHR was positively correlated with cytotoxic T-lymphocyte infiltration (CTL), and showed better predictive performance for IDH status (AUC = 0.96) and glioma histological phenotype (AUC = 0.81). Furthermore, DNA methylation alterations of eight CpGct might be related to drug treatments of gliomas. In conclusion, we indicated that DNA methylation heterogeneity is associated with a complex tumour immune microenvironment, glioma phenotype, and patient’s prognosis.
Introduction
Glioma is an extremely serious type of brain tumour, and glioblastoma (GBM) is the most aggressive form with higher cellular and molecular heterogeneity [Citation1–5]. Lower-grade gliomas (LGG) have the potential to progress to higher-grade tumours over time [Citation6,Citation7]. GBM has a median overall survival of approximately 15 months [Citation8–10]. LGG has a better prognosis than GBM, but treatment is also challenging [Citation11,Citation12]. The diversity of GBM may be influenced by multiple factors including genetic, epigenetic, and tumour immune microenvironment [Citation13]. Tumour heterogeneity is associated with enhanced genomic proliferation, altered tumour cell growth morphology, and inconsistent gene mutation frequency across cells [Citation14,Citation15]. High intra- and inter-tumour heterogeneity contribute to drug resistance and even treatment failure in some GBM patients [Citation16]. Differences in DNA methylation patterns between cells affect different cancer phenotypes, giving rise to widespread tumour heterogeneity in clinical and diagnosis [Citation17,Citation18].
Several studies have shown that 60–80% of CpG sites in the human genome are methylated [Citation19,Citation20]. Approximately 2% of the 26.9 million CpG sites show intermediate DNA methylation signals [Citation21,Citation22]. Methylation of a single CpG site in a cell type is either fully methylated or unmethylated [Citation23]. Mixing of different cell types in tumour tissues may result in elevated intermediate methylation, reflecting DNA methylation heterogeneity in the complex tumour immune microenvironment [Citation23]. Some quantification methods of DNA methylation heterogeneity, such as the Proportion of Discordant Reads (PDR) and epiallele, capture the methylation status of individual CpG sites in different cells, facilitating the analysis of DNA methylation heterogeneity within samples [Citation17,Citation21,Citation24,Citation25]. Association between DNA methylation heterogeneity and tumour clonal progression has been demonstrated in hepatocellular carcinoma and lower-grade glioblastoma [Citation26,Citation27]. However, deciphering the influences of different immune cell types mixed in tumour immune microenvironment on DNA methylation heterogeneity remains inadequate.
Our study revealed a bimodal distribution of DNA methylation profiles in single purified human immune cells, while we observed that intermediate methylation levels were elevated in the tumour tissue. We utilized the Proportion of sites with Intermediate Methylation (PIM) to quantify DNA methylation heterogeneity, which showed increased levels with immune cell infiltration. Furthermore, our analysis of GBM and LGG samples from The Cancer Genome Atlas (TCGA) indicated that lower PIM scores were associated with better survival outcomes and slower tumour progression in glioma patients. We identified cell-type-associated heterogeneous CpG site (CpGct) for B cell, CD4+ T cell, CD8+ T cell, granulocyte, monocyte, and neutrophil, and constructed a Cell-type-associated DNA Methylation Heterogeneity Contribution (CMHC) score to dissect the effect of different immune cell types on the DNA methylation level of a given CpGct. In GBM, LGG samples from TCGA, and other validation datasets [Citation28,Citation29], we selected the prognosis-related CpGct to construct the risk score, i.e., the Cell-type-associated DNA Methylation Heterogeneity Risk (CMHR) score, which was independent of the age, gender, tumour grade, O-6-methylguanine-DNA methyltransferase (MGMT) promoter status, and isocitrate dehydrogenase (IDH) status in glioma patients. CMHR predicted the IDH status and glioma histological phenotype better than T-lymphocyte cytotoxic score. Furthermore, we found that DNA methylation level alterations of prognosis-related CpGct may be associated with the drugs Temozolomide, Bevacizumab, and radiation therapy in glioma patients.
The results of this study focus on the link between DNA methylation heterogeneity and the intricate tumour immune microenvironment, suggesting that DNA methylation heterogeneity could prove to be a valuable tool for monitoring glioma progression, predicting treatment response, stratifying subtypes, and conducting phenotype studies. These findings have potential implications for the diagnosis and treatment of glioma patients and may lead to more personalized treatment options in the future.
Materials and methods
Data acquisition and preprocessing
We obtained The Cancer Genome Atlas (TCGA) level 3 gene expression data, standard β-value DNA methylation profiles (based on Illumina Infinium HumanMethylation450 BeadChip), and phenotype-survival data of glioblastoma (GBM) and lower-grade glioma (LGG) from the University of California Santa Cruz (UCSC) Xena browser (Genomic Data Commons [GDC] hub, available at https://gdc.xenahubs.net). Mutation annotation format (MAF) files of GBM and LGG were obtained via the TCGA data portal (https://www.cancer.gov/tcga/). Other validation cohorts of glioma patients were downloaded from Gene Expression Omnibus (GEO, accession numbers: GSE103659; GSE60274). We removed the genes that were not expressed in more than 70% of the samples in the gene expression data. The standard β methylation profiles were processed in the same way. The missing values of standard β profiles were supplemented using the ‘knnInputation’ function in the R package DMwR.
We download the processed β-values of purified human immune cells from GEO with identifiers: GSE103541, GSE118144, and GSE166844 (based on Illumina Infinium HumanMethylationEPIC Beadchip). These three EPIC datasets include six immune cell types, i.e., B cells, CD4+ T cells, CD8+ T cells, granulocytes, monocytes, and neutrophils. The six immune cell types are involved in immune-inflammatory response and anti-tumour immunity [Citation30,Citation31]. We used whole genome bisulphite sequencing (WGBS) and reduced representative bisulphite sequencing (RRBS) from GEO to show the distribution of β-value for single cell type in . In addition, we download three methylation arrays (GSE207426, GSE85087, and GSE195684) to explore the association between DNA methylation alterations of prognosis-related CpGct and drug therapies for glioma patients. We supplemented the number of samples and data types for each dataset mentioned above in Table S1.
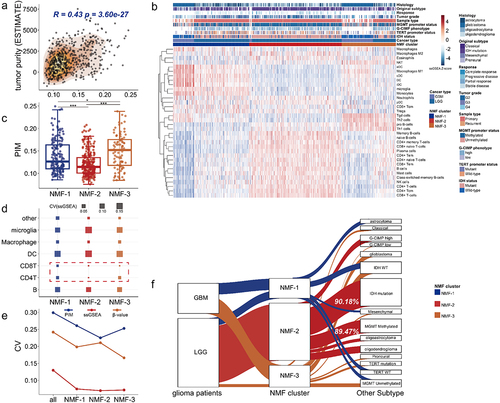
Figure 1. The association between the PIM score and the tumor immune microenvironment. (a). The bubble plot shows different correlations in GBM (upper) and LGG (bottom) samples from TCGA. The immune score, stromal score, and tumor purity were assessed by the ESTIMATE algorithm [Citation32]. (b). The charts show the correlation degree (see methods) between the PIM score corresponding to different intermediate methylation levels and cell marker expressions in various cell types (table S2). A higher correlation degree indicates a stronger association between marker gene expressions and intermediate methylation levels. The range of correlation degrees at different intermediate methylation levels is larger, and the color bar is deeper. (c). The tumor immune microenvironment consists of multiple cell types (left, created with biorender.com, https://biorender.com/). The distributions of DNA methylation profiles varied in single cell type and tumor bulk samples (right, single cell type shows 0% or 100% methylation status, intermediate methylation level was higher in tumor tissue). The lollipop plot shows glioma tumor tissue had the highest intermediate methylation level.
![Figure 1. The association between the PIM score and the tumor immune microenvironment. (a). The bubble plot shows different correlations in GBM (upper) and LGG (bottom) samples from TCGA. The immune score, stromal score, and tumor purity were assessed by the ESTIMATE algorithm [Citation32]. (b). The charts show the correlation degree (see methods) between the PIM score corresponding to different intermediate methylation levels and cell marker expressions in various cell types (table S2). A higher correlation degree indicates a stronger association between marker gene expressions and intermediate methylation levels. The range of correlation degrees at different intermediate methylation levels is larger, and the color bar is deeper. (c). The tumor immune microenvironment consists of multiple cell types (left, created with biorender.com, https://biorender.com/). The distributions of DNA methylation profiles varied in single cell type and tumor bulk samples (right, single cell type shows 0% or 100% methylation status, intermediate methylation level was higher in tumor tissue). The lollipop plot shows glioma tumor tissue had the highest intermediate methylation level.](/cms/asset/cadfaac2-8426-4537-ad2b-631a4aab7d85/kepi_a_2318506_f0001_oc.jpg)
Classification of tumor immune microenvironmental subtypes
Firstly, we calculated the single-sample gene set enrichment score (ssGSEA) in 34 cell types for GBM samples (n = 168) and LGG tumours (n = 529) from TCGA by the R package gsva (gsva function with method = ‘ssgsea’) [Citation33]. Of these, 33 cell types were chosen from Xcell (https://xcell.ucsf.edu/) [Citation34], and we added ‘microglia’ after retrieving the literature [Citation35]. The marker genes of 34 cell types were listed in Table S2. ssGSEA scores for the total number of 697 TCGA samples were shown in Table S3.
Secondly, we used the ssGSEA score matrix of GBM and LGG samples from TCGA, performing Non-negative Matrix Factorization (NMF) clustering using the R package NMF [Citation36]. The parameter k was set ranged from 3 to 8, and we repeated the NMF analysis 50 times. The best k = 3 was selected when the coupling coefficient was maximum. Therefore, we grouped GBM and LGG patients from TCGA into three tumour immune microenvironmental subtypes (NMF subtypes, NMF-1, NMF-2, and NMF-3).
Evaluation of DNA methylation heterogeneity
The Proportion of sites with Intermediate Methylation (PIM) calculates the number of CpG sites with intermediate methylation, which has been used to measure DNA methylation heterogeneity [Citation1,Citation23]. We defined a correlation degree (see follow methods) to select the ranges of intermediate β-values, and the results were shown in . We then used the intermediate methylation levels ranges from 0.2 to 0.6. In addition, the β-value ranges from 0.2 to 0.6 have been used in Wenger et al. study to measure DNA methylation heterogeneity [Citation1]. We thus calculated the proportion of CpG sites with β-values from 0.2 to 0.6 () across genome-wide as follows,
where N represents the total number of genome-wide CpG sites for each patient. A higher PIM score means more intermediate methylation sites were enriched in tumour tissue, and reflects stronger DNA methylation heterogeneity. We used the PIM score to compare intertumoral DNA methylation heterogeneity and dissect the association with the clinical presentation of glioma patients.
Cell-type-associated DNA methylation heterogeneity contribution score
We constructed a Cell-type-associated DNA Methylation Heterogeneity Contribution (CHMC) score to dissect the effect of different immune cell types on the β-values of the cell-type-associated heterogeneous CpG sites (CpGct). The steps were displayed as follows:
Step 1. Construction of DNA methylation reference matrix
We used EPIC datasets of purified human immune cells from GEO (Table S1), and there were six immune cell types including B cell, CD4+ T cell, CD8+ T cell, granulocyte, monocyte, and neutrophil due to their immunity functions in tumours [Citation30,Citation31]. We performed the Wilcoxon signed-rank test (H0: the β-value of in cell-type A is equal to that in cell-type B, where i represents the ith CpG site), and the P-values were corrected by the Benjamini-Hochberg multiple tests (BH). β-values for each CpG site in a cell type were compared pairwise to every other cell type (there are 15 paired cell combinations for 6 immune cell types). CpG sites with adjusted p-values less than 0.05 were retained as cell-type-associated CpG sites (*).
To investigate the association between DNA methylation heterogeneity and the tumour immune microenvironment, we further selected the cell-type-associated heterogeneous CpG sites (CpGct) in glioma tumour tissues. Based on the cell-type-associated CpG sites (*) identified above, we filtered the CpGct by the following steps: (i) CpG sites (*) with mean β-values between 0.2 and 0.6 in tumour tissues; (ii) CpG sites (*) with the coefficients of variation (CV, calculated by the ratio between standard deviation and mean) [Citation23] of β-values in the top 75%; (iii) CpG sites (*) with the proportion of intermediate methylated tumour samples ranked in the top 75%.
We then created the methylation reference matrix (M). The rows of M are K (1, 2, … k) CpGct, and the columns of M are six immune cell types (C = 6, each cell type has a DNA methylation profile ). M could be expressed as (1) or (2), where
denotes the mean β-value of the ith CpGct within jth cell type in EPIC datasets of purified human immune cells (Table S1), which was expressed as (3). Where T means the number of samples of the same cell type in EPIC datasets,
represents the β-value of ith CpGct in the tth cell sample,
Step 2. Estimation of tumor-infiltrative immune cells based on deconvolution
Nextly, we utilized matrix M to deconvolute immune cell infiltration for glioma patients. For the given number of cell types (C), each cell type has a DNA methylation profile (). We used the robust partial correlation (RPC) algorithm to assess the intra-sample heterogeneity by the R package EpiDISH, where
denotes the weight coefficient, and the model is based on the least-squares sense to estimate
[Citation37–39]. The deconvolution can be explained as (5),
represents β-values of K CpGct in the given patient, expressed as (4). By performing the EpiDISH procedure, we derived the enrichment score matrix (
) of n patients explained as (6) or (7), where
means infiltration levels in the jth cell type of the ith patient,
Step 3. Definition of CMHC score by performing multivariate linear regression
The methylation levels of CpG sites in tumour tissues are the average signal of CpG sites among cells [Citation23]. We thus fitted a multivariate linear regression model to estimate the effect of different immune cell types on the β-values of CpGct. The equals were listed as (9),
where means the β-values of the given CpGct in n patients, explained as (8). L represents the latent factors estimated by the R package sva [Citation40]. The coefficients
to
(9) were considered as Cell-type-associated DNA Methylation Heterogeneity Contribution (CMHC) score. Hence, we derived the CMHC scores of K CpCct, expressed as (10) or (11). Where
denotes the CMHC score of ith CpGct corresponding to the jth cell type, reflecting the influencing degree of cell type j on the β-values of ith CpGct. The steps mentioned in this method were shown in .
Survival analysis
To examine the clinical application of CpGct in glioma, we used the matrix W and CMHC to calculate the CMHCcell for each CpGct in individual glioma patients. The CMHCcell score was displayed in (13), (14), and .
where represents the CMHC score of ith CpGct (i from 1 to k), expressed as (12),
denotes infiltration levels of six immune cell types in n glioma patients. We thus derived the CMHCB, CMHCCD4, CMHCCD8, CMHCgran, CMHCmono, and CMHCneu for each patient at the given CpGct, explained as (13) or (14). CMHCcell score was used to measure the DNA methylation degree of a given CpGct in one specific cell type for different patients.
Nextly, we used GBM and LGG samples from TCGA as training datasets, performing the multivariate Cox regression model based on six CMHCcell scores of each CpGct (the formula for each CpGct is: Surv(OS.time, OS)~ CMHCB + CMHCCD4 + CMHCCD8 + CMHCgran + CMHCmono +CMHCneu). The CpGct with P-values <0.05 were considered as candidate prognosis-relevant markers. We subsequently performed multivariate stepwise Cox regression on potential prognosis-related CpGct. We selected a model with the minimum Akaike Information Criterion value (AIC), producing eight CpGct as the prognosis signature. We constructed a risk score to examine the prognostic value of the eight CpGct, i.e., Cell-type-associated DNA Methylation Heterogeneity Risk (CMHR) score, the CMHR was calculated as (15),
where coef () is the regression coefficient of ith prognosis-relevant CpGct. We further divided GBM and LGG patients from TCGA into high-risk and low-risk groups according to the median CMHR score, investigating the relationship between overall survival probability and the CMHR score by Kaplan-Meier (KM) analysis with the log-rank test (P-values <0.05), and tested in additional independent datasets GSE60274 [Citation28] and GSE103659 [Citation29]. Survival analysis was based on the R packages survival and survminer.
Definition of correlation degree
To assess the advantage of the CpGct for inferring the cellular distributions in the tumour immune microenvironment, we defined a correlation degree to quantify the association between marker gene expressions (Table S2) and cellular infiltration. The cellular infiltration was deconvolution by EpiDISH and methylCIBERSORT [Citation41]. DNA methylation reference matrix M (containing CpGct) was used in EpiDISH. The methylation reference matrix of methyl-CIBERSORT (heterogeneity of CpG sites was not considered) was obtained from Chakravarthy et al. study [Citation41]. The correlation degree was expressed as (16),
where q-values are P-values of the Spearman bivariate correlation analysis adjusted by BH, and |Rho| is the absolute value of Spearman’s rank correlation coefficients. The greater the correlation degree, the stronger the association between marker gene expressions and cellular infiltration.
Quantification of inter-patient differences and inter-subtype differences
To examine that patients within the same NMF subtype have similar epigenetic backgrounds and cellular compositions, we calculated the CV value [Citation23], entropy [Citation42], and Gini-index [Citation43] of DNA methylation level, ssGSEA score, and the PIM score for TCGA glioma patients and NMF subtypes to measure differences between patients and between NMF subtypes, respectively. The larger the CV value, the greater the variation [Citation23]. The formulas of entropy (17) and Gini-index (18) are following,
where parameter denotes the probability of occurrence of a given event
. We divided methylation values, ssGSEA scores, and PIM scores into different classes according to their respective quartiles so that we can derive
for each level.
Somatic mutation analysis
We obtained the MAF files of GBM and LGG samples from TCGA. The somatic alterations were detected for the patients in high-risk (n = 261) and low-risk (n = 268) by the R package maftools [Citation44]. The top 25 driver genes with the highest mutation frequency were further analysed by Fisher’s exact test. Genes with P-values <0.001 were regarded as differentially mutated genes.
Identification of featured genes that related to cytotoxic T-lymphocyte infiltration and the survival of glioma patients
T-lymphocyte cytotoxicity was revealed to be associated with the survival of GBM patients [Citation45]. We thus explored the expression differences of cytotoxicity-associated genes between high-risk and low-risk groups (TCGA samples). We collected gene sets related to T-lymphocyte infiltration and anti-tumour immunity from The Molecular Signatures Database (MsigDB), Kyoto Encyclopedia of Genes and Genomes (KEGG), and Gene Ontology (GO). The function of these genes includes (i) antigen presentation such as HLA-A [Citation41]; (ii) as chemokines to participate in T-lymphocyte recruitment such as CXCL9 [Citation46,Citation47]; (iii) as effector molecules performing tumour killing such as granzyme and perforin [Citation46,Citation48].
We then filtered genes associated with the overall survival probability and tumour progression of TCGA patients (log-rank test, P-values <0.05; Cox-wald test, P-values <0.05). We performed the Spearman bivariate correlation analysis (q-values <0.05) to select genes related to the CHMR score and cytotoxic score (the geometric mean of GZMA and PRF1 expressions [Citation41,Citation46]). These genes were considered featured genes related to cytotoxic T-lymphocyte infiltration and the prognosis of glioma patients.
Results
Intertumoral DNA methylation heterogeneity characterizing glioma subtypes related to tumor immune microenvironment
Tumour masses are composed of multiple cell types, including malignant cells, immune cells, and stromal cells, known as the tumour immune microenvironment [Citation49,Citation50]. Several studies have shown that the intermediate methylation levels correlated with mixed cellular compositions in tumour tissues, reflecting DNA methylation heterogeneity in the tumour immune microenvironment [Citation1,Citation23,Citation51]. We used the Proportion of sites with Intermediate Methylation (PIM) (see methods) to estimate DNA methylation heterogeneity. Higher PIM scores indicate more intermediate methylated CpG sites enriched in the sample. At different ranges of intermediate methylation levels, we calculated different PIM scores for glioma patients. The result showed when intermediate methylation levels fell within 0.2 to 0.6, the PIM score correlated more with immune cell infiltration, stromal cell infiltration, tumour purity, mutation count, and aneuploidy percentage (), and showed greater correlation degrees with cell marker genes (, Table S2), suggesting that DNA intermediate methylation (β-values ranges from 0.2 to 0.6) could be more indicative of the transcriptional diversity of cell marker genes. After comparing the methylation profiles of purified human immune cells with the tumour tissue (GBM sample from TCGA), we found the DNA methylation profiles of B cell, monocyte, macrophage, CD4+ T cell, natural killer cell, neutrophil, and two glioma cell lines, including U87 [Citation52] and U251 [Citation53] showed bimodal distributions. By contrast, more intermediate methylation sites were enriched in the tumour tissue ().
In previous studies, glioma subtypes were classified based on bulk gene expressions and DNA methylation levels to examine transcriptional and epigenetic heterogeneity [Citation35,Citation54,Citation55]. Our analysis found that PIM score was positively associated with tumour purity and immune cell infiltration levels (, Fig.S1A), This result indicated that the DNA methylation heterogeneity increased with more complex cell compositions present in the tumour immune microenvironment. We then used Non-negative Matrix Factorization (NMF) algorithm (see methods) to perform clustering analysis based on the ssGSEA scores of TCGA samples (Table S2), the ssGSEA score reflects cellular infiltration levels. The clustering analysis stratified GBM and LGG samples from TCGA as three tumour immune microenvironmental subtypes (NMF subtypes) with different cellular compositions (see methods, ). We found that the proportion of dendritic cells and M1 macrophages was higher in NMF-1, the infiltration levels of memory B cells and naïve B cells were higher in NMF-2, and T cell subsets such as Th1 cells and Th2 cells were enriched in NMF-3 (). The PIM score showed the lowest level in NMF-2 (). Additionally, we also discovered that DNA methylation level, tumour purity, and abundances of immune infiltration were lowest in NMF-2 (Fig.S1B, Fig.S1C). These results suggested DNA methylation heterogeneity is associated with NMF subtypes. Furthermore, we found the CV values of ssGSEA scores in NMF-2 were smallest in CD4 T-lymphocyte and CD8 T-lymphocyte (). This suggested that the weaker DNA methylation heterogeneity of NMF-2 might be attributed to the lower diversity of T cell types present in the tumour tissues. We then compared the differences in glioma patients before clustering and patients within the same NMF subtype, the CV values for PIM scores, mean DNA methylation levels, and ssGSEA score all showed larger values between glioma patients than between NMF subtypes (see methods, , Fig.S1D), revealing more similar epigenetic backgrounds and cellular compositions of glioma patients within the same NMF subtype. We discovered that NMF-2 aggregated the most significant amount of LGG, and there was a clear overlap in the IDH mutant subtype and the MGMT promoter methylation subtype (). Furthermore, NMF-2 showed better survival outcomes and slower disease progression than NMF-1 and NMF-3 (Fig.S1E, Fig.S1F). This finding is consistent with previous studies, suggesting that glioma patients with IDH mutations have better survival rates [Citation56–59]. NMF subtype was a factor independent of the age and gender of glioma patients (Fig.S1G). These results indicated that DNA methylation heterogeneity may affect the survival of glioma patients.
Figure 2. Intertumoral DNA methylation heterogeneity characterizing NMF subtypes. (a). The correlation between DNA methylation heterogeneity and tumor purity (Spearman’s rank correlation coefficient). (b). Using non-negative matrix factorization, GBM and LGG samples from TCGA were classified as three tumor immune microenvironmental subtypes (NMF subtypes). (c). The DNA methylation heterogeneity differed between NMF subtypes (Wilcoxon signed-rank test, P-values*** < 0.001, P-values** < 0.01, P-values* < 0.05). (d). The bubble plot demonstrates the CV values of the cellular enrichment ssGSEA score across NMF subtypes. (e). The line chart shows the CV values in DNA methylation heterogeneity, DNA methylation level, and cellular enrichment score in all glioma patients before clustering and in patients within the same NMF subtypes. (f). 90.18% of NMF-2 samples were enriched in isocitrate dehydrogenase (IDH) mutant status and 89.47% of NMF-2 samples were enriched in O-6-methylguanine-DNA methyltransferase (MGMT) promoter methylation status (hypergeometric test-P < 0.001).
DNA methylation heterogeneity distinguishes glioma tumor progression and drug treatment response
We used GBM and LGG samples from TCGA to explore the association between clinical variables (Table S4) and DNA methylation heterogeneity. To examine the differences in DNA methylation heterogeneity intensity of glioma patients among NMF subtypes, we investigated the distribution of PIM scores, and we found that there were differences in the number of patients with different PIM scores across NMF subtypes (). The largest number of patients with low PIM scores were enriched in NMF-2 (). Based on Cox regression analysis, we found that the PIM score was a factor independent of the age, gender, tumour grade, MGMT promoter status, and IDH status in glioma patients (, Cox-wald test, P-value <0.05), which is consistent with previous studies that DNA methylation heterogeneity was related to the glioma prognosis [Citation17]. The GBM and LGG samples of TCGA have different subtype classifications (Table S4), in contrast to GBM samples, the number of LGG samples overlaps more with other subtypes including IDH subtypes, MGMT subtypes, telomerase reverse transcriptase (TERT) subtypes, and histological subtypes (). We then compared the PIM differences across distinct glioma phenotypes, GBM with higher PIM scores than LGG. There were higher PIM scores in IDH wild-type (WT), MGMT promoter unmethylated, and TERT promoter mutated tumours. In addition, recurrent gliomas had higher PIM scores than primary tumours, and the tumours with higher grades (grade 4) had the highest PIM score than lower grades (). Taken together, these results suggested that DNA methylation heterogeneity is more pronounced in undifferentiated tumours with malignant behaviour and increases with higher tumour grade [Citation60].
Figure 3. DNA methylation heterogeneity is related to clinical variables of GBM and LGG patients from TCGA. (a). The distribution of PIM scores differed among NMF subtypes (Kruskal-Wallis test, P-value*** < 0.001). (b). The line chart shows the number distribution of glioma patients with different PIM scores among NMF subtypes. (c). The forest plot shows the prognostic value of the PIM score based on cox regression analysis. (d). The numbers of GBM and LGG samples from TCGA correspond to IDH status, MGMT promoter status, TERT promoter status, histological subtype, original subtype, G-CIMP phenotype, tumor grade, and sample type. The box plots show the PIM scores in (e) different glioma phenotypes, tumor grades, (f). Patients with different disease progression after Temozolomide treatment, and (g). Different patients treated with different drug therapies (Wilcoxon signed-rank test, P-values*** < 0.001, P-values** < 0.01, P-values* < 0.05). (h), the bar plots display the distribution of PIM scores for patients who received chemotherapy. For the responder (complete response and partial response), the proportions of high-PIM, low-PIM, and medium-PIM are 23.81%, 33.33%, and 42.86%, for non-responders (progressive disease and stable disease), the proportions of high-PIM, low-PIM, and medium-PIM are 39.25%, 31.78%, and 28.97% (Wilcoxon signed-rank test, P-values*** < 0.001).
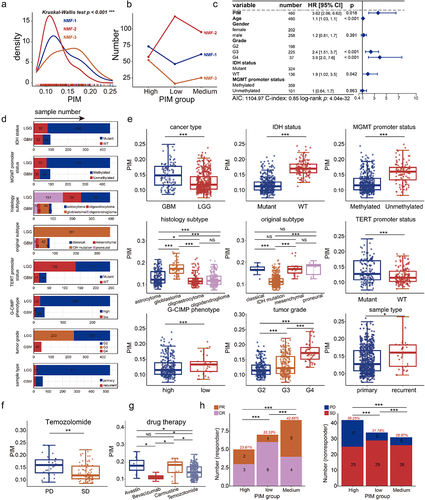
We further examined the association between drug therapies and the PIM score. Temozolomide, a major chemotherapy drug used for glioma treatment [Citation61], in patients who received Temozolomide, we found that the PIM scores were higher in progressive disease (PD) patients than in stable disease (SD) patients (). Additionally, the PIM score was related to drug therapies. PIM scores were higher in patients treated with Temozolomide than those receiving Carmustine. In patients accepting targeted molecular drugs, PIM scores were higher in Avastin than in Bevacizumab (). Moreover, PIM scores were linked to patients’ treatment response to chemotherapy, there were differences in PIM scores among subgroups of high-PIM, low-PIM, and medium-PIM patients, respectively. (Wilcoxon signed-rank test, P-values*** < 0.001). The proportion of high PIM scores in responders is minimum and the percentage of high-PIM patients is maximum in non-responders (). These results suggested that DNA methylation heterogeneity might play a role in distinguishing glioma phenotypes, tumour progressions, and patients’ responses to drug therapy.
Cell-type-associated heterogeneous CpG sites correlate with genes regulating T-lymphocyte proliferation and differentiation
To dissect the cell-type-specific DNA methylation patterns in a complicated tumour immune microenvironment, we identified CpG sites related to B cell, CD4+ T cell, CD8+ T cell, granulocyte, monocyte, and neutrophil. These CpG sites were mainly distributed in the gene body regions (Table S5, , Fig.S2A), after filtering cell-type-associated heterogeneous CpG sites (CpGct), we constructed a Cell-type-associated DNA Methylation Heterogeneity Contribution (CMHC) score to assess the influence of six immune cell types on the DNA methylation levels of CpGct (see methods, ). In addition, we defined a correlation degree (see methods) to evaluate the association between marker gene expressions and cellular infiltrations calculated by the CMHC model (see methods) and methylCIBERSORT [Citation41]. Using the DNA methylation profiles and bulk gene expressions of GBM and LGG samples from TCGA to calculate the correlation degree for different cell types. The correlation degree for B cells, CD4+ T cells, CD8+ T cells, and neutrophils were higher in the CMHC model (). This suggested the heterogeneity of CpG sites could decipher the cellular distribution of tumour immune microenvironment more accurately.
Figure 4. Cell-type-associated heterogeneous CpG sites correlate with genes regulating the proliferation and differentiation of T-lymphocyte. (a). Identification of cell-type-associated heterogeneous CpG site (CpGct) and the construction of CMHC score. (b). The barplot shows the number and genome distribution of cell-type-associated CpG sites (hypermethylation refers to the mean DNA methylation level of the given CpG site in cell-type a is higher than in other cell types, while hypomethylation refers to the mean DNA methylation level of the given CpG site in cell-type a is lower than in other cell types). (c). The box plots show the correlation degrees in different cell types calculated based on CMHC and methylCIBERSORT. DNA methylation reference matrix (M) consists of CpGct, which was used in the deconvolution for the CMHC model. (Wilcoxon signed-rank test, P-values*** < 0.001, P-values** < 0.01, P-values* < 0.05). Enrichment of (d). GO terms and (e). KEGG pathways associated with DEGs. GO terms include biological process (BP), molecular function (MF), and cell component (CC).
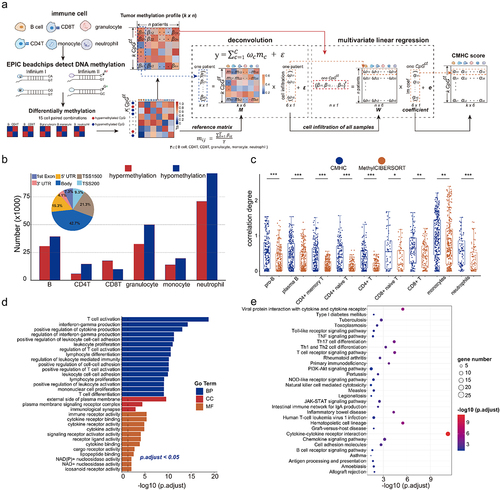
Subsequently, we identified 178 differentially expressed genes (DEGs) related to CpGct between NMF subtypes (Table S6, Fig.S2B). These DEGs are involved in the activation and proliferation of T cells, the regulation of leukocyte-mediated immunity, interferon-gamma production, and cytokine receptor activity (Table S7, ). Our analysis showed the KEGG pathways related to these DEGs including T cell receptor signalling pathway, T cell differentiation, cytokine-cytokine receptor interaction, and haematopoietic cell lineage (Table S7, ), this result was consistent with previous gene studies, which also reported the immune response pathways mediated by T-cell in glioblastoma [Citation62,Citation63]. These findings suggested that CpGct-related genes play roles in the proliferation and differentiation of T-lymphocyte.
Cell-type-associated heterogeneous CpG sites in glioma tissues are related to neurogenesis and nervous system development
We evaluated the prognostic value of the CMHC score by calculating the CMHCcell score (CMHCB, CMHCCD4, CMHCCD8, CMHCgran, CMHCmono, and CMHCneu) of each CpGct in individual patients (see methods, ), The GBM and LGG samples from TCGA were used as training data, and GSE103659 and GSE60274 as validation data. Using the β-values of CpG sites, we performed univariate Cox regression and log-rank test and identified 94 Prognosis-Related CpG sites (PRS) (see methods, , Table S8). Parallelly, we did multivariate Cox regression and log-rank test based on the CMHCcell score and selected 83 Prognosis-Related cell-type-associated heterogeneous CpG sites (PRH) (see methods, , Table S9). The DNA methylation levels of PRS and the CMHCcell scores of PRH were associated with glioma patients’ overall survival (). We then checked the immune cell type distribution of PRH, there were 49 out of PRH (59.04%) were hypomethylated in immune cells, there were 44 out of PRH (53.01%) associated with the B cell, CD4+ T cell, and CD8+ T cell. B cell and CD4+ T cell-type-associated CpGct was distributed in more genomic locations including gene body, untranslated regions, and the first exon region (). We further analysed the genomic distribution of PRH, there were 30 out of PRH (36.14%) enriched in the gene body. However, there were only 24 out of PRS (25.53%) were enriched in cell-type-associated heterogeneous CpG sites (). As described in the method, each immune cell type has a CMHCcell score, reflecting the effect of immune cell types on DNA methylation level for the given CpGct, we further investigated the levels of β-values and the CMHCcell scores for PRH in different genomic regions. We found that mean β-values and CMHCcell score of B cell both showed larger levels in the shore regions with lower CpG density, while the CMHCcell score of granulocyte and monocyte showed lower levels in the CpG island (CGI) with higher CpG density (), suggesting the DNA methylation pattern in specific genomic regions differs across immune cell types.
Figure 5. Cell-type-associated heterogeneous CpG sites were enriched in neural-related biological processes. (a). The construction of CMHCcell score. (b). Prognosis-related CpG sites and CpGct were identified by cox regression and Kaplan-Meier (KM) analysis with the log-rank test (P-values < 0.05). (c). The stack bar plots show different DNA methylation patterns of CpGct. (d). The stack bar plots show the distributions of different genome regions for CpG sites and CpGct. (e). Kaplan-Meier (KM) analysis shows the prognostic value of the CMHCcell score in TCGA, GSE103659, and GSE60274. (f). The line charts display the distributions of β-values and the CMHCcell score for 83 prognosis-related CpGct. (g). The negative correlation between gene expressions and DNA methylation levels of CpGct located in the gene promoter (Spearman’s rank correlation coefficients). GO enrichment of EWAS for (h). 94 CpG sites and (i). 83 CpGct.
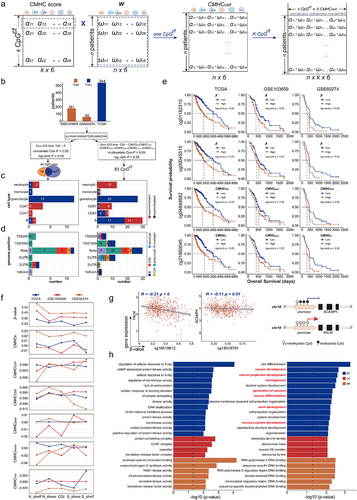
We subsequently identified genes whose expression values were negatively correlated with the methylation levels of PRH located in the promoter region. Our findings showed that the expression of protein-coding gene SCAMP4 was negatively associated with the DNA methylation level of B cell-type-associated hypomethylation CpGct cg15018704, and the expression of protein-coding gene PALM was negatively linked to the DNA methylation level of granulocyte cell-type-associated hypomethylation CpGct cg16019612 (). SCAMP4 was revealed as a prognosis marker for GBM and LGG [Citation64]. We also performed the correlation analysis between DNA methylation of PRS and gene expressions, however, we did not identify genes correlated with PRS methylation. These results suggested that taking into account the heterogeneity of CpG sites might be more useful in identifying prognostic markers for glioma patients.
To further understand the biological function of PRS and PRH, we did the GO enrichment analysis by Epigenome-Wide Association Study (EWAS) [Citation65]. We found that PRS play a role in regulating cellular response, chromatin remodelling, and kinase activity (), while PRH were enriched in neuron development, neurogenesis, and nervous system development (). These results suggest that PRH considers the differences in DNA methylation patterns across cells, facilitating the identification of glioma-related prognostic markers and helping us understand the nervous system function of heterogeneous CpG sites.
CMHR score based on cell-type-associated heterogeneous CpG sites identifying high mutation frequency genes
We performed multivariate step Cox regression and selected a set of eight CpGct to construct the risk score, i.e., Cell-type-associated DNA Methylation Heterogeneity Risk (CMHR) score (see methods, ). We then divided GBM and LGG patients from TCGA into high-risk and low-risk groups based on the median CMHR scores (). In TCGA, GSE103659, and GSE60274, low-risk patients had worse survival outcomes (). CMHR score was independent of the age, gender, tumour grade, MGMT promoter status, and IDH status of glioma patients (). These results indicated that the CMHR score could be a prognostic biomarker for glioma patients.
Figure 6. The prognostic value of CHMC score and CMHR score. (a). The construction of the CMHR score. (b). Kaplan-Meier (KM) analysis showed that low-risk patients had poor survival outcomes (training data: TCGA, and testing data: GSE103659 and GSE60274). (c). For TCGA samples, the forest plot shows the CMHR score is a prognostic factor independent of the age, gender, tumor grade, MGMT promoter status, and IDH status of glioma patients. For GSE103659 and GSE60274, the CHMR score is independent of the age and MGMT promoter status of glioma patients. (d). Oncoplots show the mutation genes differed in high-risk and low-risk patients, there were nine genes overlapped in both groups including IDH1, TP53, ATRX, TTN, RYR2, PIK3CA, MUC16, CIC, and FUBP1. High-risk patients include 221 LGG samples and 40 GBM samples, while low-risk patients contain 266 LGG samples and 2 GBM samples. (e). The expression differences of mutation genes between high- and low-risk patients. For genes mutated more frequently in the high-risk group, there were 4 out of 15 genes (26.67%) with greater expressions in high-risk patients, and there were 5 out of 15 genes (33.33%) expressed higher in low-risk patients. For genes mutated more frequently in the low-risk group, there were 11 out of 16 genes (68.75%) with higher expressions in low-risk patients, and there were 3 out of 16 genes (18.75%) expressed higher in high-risk patients. The protein expression levels of (f) EGFR and (g) PCLO were checked from the human protein atlas (https://www.Proteinatlas.org/humanproteome/pathology).
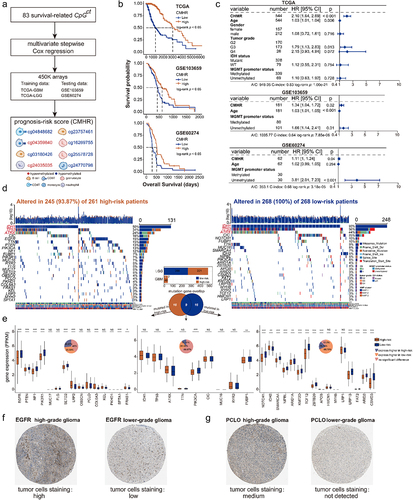
Several studies have shown that the poor survival of glioma patients was related to gene somatic mutations [Citation66–68]. We identified the top 25 genes with high mutation frequencies in high- and low-risk patients. The mutation frequencies of IDH1, TP53, and ATRX all ranked in the top three positions in both high- and low-risk patients (). These genes were found to be associated with the survival of glioma patients [Citation69]. Moreover, previous studies have shown that the mutation of proto-oncogene EGFR could be a clinical marker for GBM [Citation70–72]. We then examined the expression differences of mutated genes between high- and low-risk patients. EGFR mutated more frequently (Fig.S3, Fisher’s test) in high-risk patients (better survival) and showed higher expressions in low-risk patients (poor survival). Additionally, the tumour-suppressor gene PTEN [Citation73] had larger expression values in low-risk patients (). There has been revealed that the PTEN-related pathway involves in the regulation of glioma tumorigenesis [Citation74]. We then explored the immunohistochemical staining characteristics of EGFR from The Human Protein Atlas (HPA, https://www.proteinatlas.org). We found that the protein expression of EGFR was higher in high-grade glioma (the high-risk group contains more high-grade glioma patients) than in low-grade glioma (). In addition, PCLO also showed greater protein expression in high-grade gliomas (). A past study revealed that the glioma phenotypes with PCLO mutation had poor prognosis [Citation75]. These findings suggested a potential association between DNA methylation heterogeneity at the epigenetic level and gene mutations at the genomic level, indicating the implication of DNA methylation heterogeneity on the prognosis of glioma.
Enhanced T-lymphocytosis and infiltration contribute to improved prognosis in high-risk patients
CMHR score was created based on the CpGct of CD4+ T cell and CD8+ T cell, and the cytotoxic T-lymphocyte (CTL) infiltration was related to anti-tumour immunity and GBM prognosis [Citation45,Citation46,Citation76]. GZMA and PRF1, as cytotoxic effector genes, and the cytotoxic score could be estimated by the geometric mean of their expression values [Citation41,Citation46]. We further calculated the cytotoxic score for high- and low-risk patients to delineate the correlation between CTL and the CMHR score. We found that high-risk patients had greater cytotoxic scores, indicating stronger cytotoxic activity of T-lymphocyte (). We then filtered 25 featured genes that affected the overall survival of GBM and LGG samples from TCGA (see methods, Table S10, ). These featured genes are mainly involved in antitumor-immunity and cytotoxicity of T-lymphocyte (), such as effector molecules like GZMA and PRF1 that perform tumour killing [Citation46,Citation48,Citation76], interferon-stimulated chemokines like CXCL9 and CXCL10 that promote T-lymphocyte recruitment [Citation47], and transcription factors like EOMES that regulate CTL effector function [Citation77,Citation78]. We discovered that these featured genes all showed higher expressions in high-risk patients (), suggesting that the better survival of high-risk patients may be due to the stronger cytotoxic function and infiltration level of T-lymphocyte.
Figure 7. CMHR score was related to cytotoxic T-lymphocyte infiltration. (a). The featured genes associated with T-lymphocyte infiltration were collected from the molecular signatures database (MsigDB), Kyoto Encyclopedia of genes and genomes (KEGG), and gene ontology (GO). By performing the log-rank test and Cox-wald test, these featured genes were related to the overall survival of GBM and LGG samples from TCGA. These featured genes were positively correlated with the CMHR score as well as the cytotoxic score (Spearman’s rank correlation coefficients). (b). Featured genes were involved in anti-tumor immunity and tumor killing (MHC: major histocompatibility complex, TCR: T cell receptors). (c). The association between prognosis-related CpGct and featured genes in low-risk (upper) and high-risk (bottom) patients (Spearman’s rank correlation coefficients). (d). The box plots show the expressions of featured genes in high- and low-risk patients (Wilcoxon signed-rank test, P-values*** < 0.001). (e). The associations of the CMHR score with tumor purity, immune cell infiltration, stromal cell infiltration levels, and the percent of aneuploidy (Spearman’s rank correlation coefficients). The box plot shows the cytotoxic score in high- and low-risk patients (Wilcoxon signed-rank test, P-values*** < 0.001). (f). For GBM and LGG samples from TCGA, the receiver operating characteristic curves (ROC) show the CMHR score was more predictive for overall survival, IDH status, MGMT promoter status, and histological phenotypes. The predictive potential was measured by the area under curves (AUC). (g). For GBM and LGG samples from TCGA, the bar plots show the values of CMHR score, cytotoxic score, GZMA expression, and PRF1 expression in different histological phenotypes (Kruskal-Wallis test, P-value*** < 0.001), IDH status, and MGMT promoter status (Wilcoxon signed-rank test, P-values*** < 0.001). For GSE103659 and GSE60274, the CMHR score differed between MGMT promoter methylation and unmethylation status (Wilcoxon signed-rank test, P-values*** < 0.001).
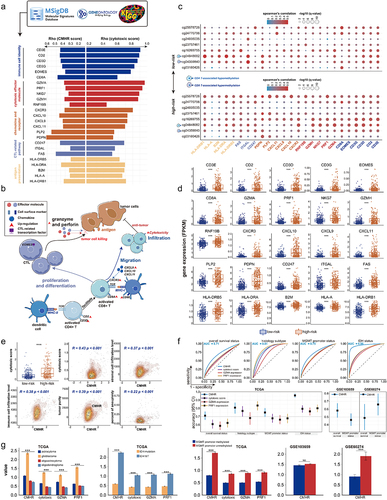
It has been observed that in high-risk patients, there is a stronger positive correlation between cytotoxic effector gene (GZMA, GZMH, and PRF1), immune cell identity genes (CD3D and CD3G), and CTL-related pathway genes (ITGAL) with the DNA methylation level of T-lymphocyte-related CpGct (). This indicated that T-lymphocyte-associated CpGct might potentially play a role in CTL regulation. Furthermore, the CMHR score was found to be positively correlated with the cytotoxic score, tumour purity, and immune cell infiltration (), indicating that the CMHR score increased in a more complex tumour immune microenvironment.
Moreover, in GBM and LGG datasets from TCGA, the CMHR score showed better predictive performances in overall survival, histological phenotype, MGMT promoter status, and IDH status than the cytotoxic score and the GZMA expression (). We compared the predictive performance of the CMHCcell score of eight CpGct with the β-values of CpG sites in the Kessler et al. study, which were related to the overall survival and MGMT promoter status of GBM patients [Citation79]. Our markers displayed better AUC values for the survival and MGMT promoter status in TCGA, GSE103659, and GSE60274 (Fig.S4). In addition, the CMHR score, the cytotoxic score, GZMA expression, and PRF1 expression showed larger values in glioblastoma, IDH-WT subtypes, and MGMT promoter unmethylated subtypes (). These findings suggested that the CMHR score contributes to the identification of markers for distinguishing different glioma phenotypes.
DNA methylation alterations of prognosis-related CpGct correlate with the glioma drug therapy
Previous studies have investigated the correlation between CpG sites and the drug therapies of glioma patients to elucidate the clinical application and regulation functions of CpG biomarkers [Citation80–82]. We aimed at exploring the association between prognosis-related CpGct and the treatment approaches for glioma. In TCGA patients treated without Temozolomide or radiotherapy, there were 3 out of 8 CpGct (37.5%) did not show DNA methylation changes between long- and short-survival patients. In GSE207426, there were 4 out of 8 CpGct (50%) had lower DNA methylation levels in long-survival patients receiving Temozolomide, and there were 3 out of CpGct (37.5%) showed increased DNA methylation levels in long-survival patients treated with radiation (), which is similar to previous studies that Temozolomide and radiation treatment could affect the DNA methylation levels of CpG sites [Citation83,Citation84]. DNA methylation levels of B cell-related cg03180426 increased more in long-survival patients who received Temozolomide than those who received radiation, while monocyte-related cg24770798 shows decreased DNA methylation in both long-survival patients treated with Temozolomide and radiation. Granulocyte-related cg16269755 showed decreased DNA methylation levels in long-survival patients accepting Temozolomide and increased DNA methylation levels in those receiving radiation (). These results suggested that prognosis-associated CpGct could be potential drug targets of Temozolomide and radiotherapy in glioma patients.
Figure 8. The correlation between DNA methylation level of prognosis-related CpGct and the drug therapies. (a). Heatmaps show the DNA methylation changes of prognosis-related CpGct in short-survival and long-survival glioma patients (TCGA and GSE207426). (b). The bar plots show the proportion of CpGct with different methylation changes between patients receiving Temozolomide and radiation as well as TCGA patients without treatment. (c). Line charts show the DNA methylation changes of prognosis-related CpGct for 19 GBM patients with primary and paired recurrent tumors (GSE85087), and 16 patients received different treatments. The pie plots show the proportion of 16 patients with different values.
, DNA methylation levels of CpGct were higher in recurrent tumors;
, DNA methylation levels of CpGct were lower in recurrent tumors. TMZ represents the drug Temozolomide, and BVZ means the drug Bevacizumab. The more species of Δβ in the pie chart, the higher DNA methylation heterogeneity. (d). Kaplan-Meier (KM) analysis shows the prognosis value of B cell-related CpGct and monocyte-related CpGct in GBM patients accepting radiation (GSE195684). (e). The forest plot shows that the DNA methylation level of B cell-related CpGct was a prognostic factor independent of the age, gender, and DNA methylation levels of other CpGct (GSE195684).
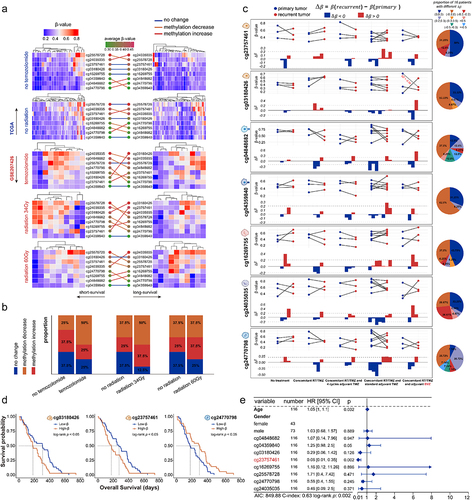
We found that the CD4+ T cell, CD8+ T cell, monocyte, and neutrophil-related CpGct showed lower DNA methylation levels in recurrent tumours, while granulocyte and B cell-related CpGct showed higher DNA methylation levels in recurrent tumours (). The highest intertumoral DNA methylation heterogeneity was observed for CD4+ T cell-related CpGct cg04848682, while CD8+ T cell-related CpGct cg04359840 showed the lowest intertumoral DNA methylation heterogeneity (). This may be due to the Temozolomide treatment, which could change the number and the anti-tumour function of CD8+ T cells [Citation85,Citation86]. These results provided a new insight that the CpGct with lower intertumoral DNA methylation heterogeneity might serve as stable markers for Temozolomide therapy.
Out of 16 patients who received Temozolomide, 9 out of them (56.25%) had higher DNA methylation levels of B cell-related cg23757461 in their recurrent tumours compared with their primary tumours. According to the study, the protein-coding gene NEDD4L (cg23757461 was located in NEDD4L) affects the drug sensitivity of GBM patients to Temozolomide [Citation82]. Moreover, the DNA methylation levels of B cell-related cg03180426 decreased more in recurrent tumours of patients treated with adjuvant Bevacizumab therapy compared with other CpGct (). These findings suggested that the DNA methylation alterations of prognosis-related CpGct in different immune cell types potentially distinguish the drug treatments for glioma.
Our research discovered a correlation between lower DNA methylation levels of B cell-related CpGct and improved survival rates of GBM patients who underwent radiation. Conversely, we found that lower DNA methylation level of monocyte-related CpGct was associated with poor prognosis in GBM patients receiving radiation (). Our multivariate Cox regression analysis revealed the DNA methylation level of B cell-related cg23757461 to be an independent prognostic factor for glioma patients, irrespective of their the age, gender, and other CpGct (). These findings indicated that the B cell-associated CpGct might be a useful clinical marker for evaluating the survival outcomes of glioma patients.
Discussion
In previous studies, researchers have investigated the relationship between DNA methylation heterogeneity and the phenotype and prognosis of glioma. Wenger et al. conducted a study where they stratified glioblastoma subtypes based on DNA methylation to better understand intertumoral epigenetic heterogeneity [Citation1]. Klughammer et al. also looked at the correlation between the clinical presentation of glioblastoma patients and DNA methylation heterogeneity [Citation17]. Additionally, Johnson et al. explored the influencing factors of DNA methylation heterogeneity in glioma tissues [Citation51]. However, the regulatory mechanism of DNA methylation heterogeneity in the tumour immune microenvironment remains unclear. To address this, we delved into the different DNA methylation patterns across cells in the complex tumour immune microenvironment that gives rise to DNA methylation heterogeneity. We hope that our findings can contribute to the application of DNA methylation heterogeneity in subtype stratification and clinical care for glioma patients.
Our research revealed that there was a higher intermediate methylation level in tumour tissues compared to a single purified human immune cell. This finding suggests that there is DNA methylation heterogeneity among cells, which increases with higher abundances of CD4+ T cell and CD8+ T cell infiltrations in glioma patients. Additionally, we found that patients with fewer intermediate methylation sites had a better prognosis and slower disease progression. This was consistent with a previous study that DNA methylation heterogeneity affects the survival of glioma patients [Citation17]. The PIM score was a prognostic factor independent of various patient factors such as age, gender, and tumour grade. We created the risk score CMHR to evaluate the prognostic value of CpGct. The low-risk patients had poorer survival outcomes and we identified differential mutation genes between high-risk and low-risk groups, some genes such as TP53 and ATRX were suggested to be prognostic biomarkers for glioma patients [Citation69,Citation71]. The CMHR score was positively correlated with T-lymphocyte infiltration, which has been indicated to be associated with GBM subtypes classified based on DNA methylation [Citation87]. We found that the CMHR score was more predictive than the cytotoxic score for IDH status and histological phenotypes and showed higher levels in glioblastoma phenotype, IDH-WT subtypes, and MGMT promoter unmethylated subtypes. Our results suggested that the CMHR score may contribute to characterizing the glioma phenotypes and could be a potential biomarker for distinguishing the patients’ drug approaches. Previous studies have also investigated the association between the DNA methylation level of CpG sites and the drug treatment of glioma patients [Citation80–82], adding to the potential clinical significance of our findings.
However, the study had some limitations. The prognostic model was created based on finite cohorts. So future studies need more datasets to test the prognostic value of DNA methylation heterogeneity score. Additionally, more datasets are needed to elucidate the association between prognosis-related CpGct and drug therapies for glioma patients. Finally, the potential function of prognosis-related CpGct needs to be further explored.
Conclusions
This study has shown that DNA methylation heterogeneity is linked to the tumour immune microenvironment, tumour progression, and treatment responses of glioma patients. The CMHR score is associated with the cytotoxicity and infiltration of T-lymphocyte, which could play a role in characterizing glioma phenotypes.
Authors’ contributions
Y.S.M. and X.P. designed the study, performed analysis, and wrote the manuscript. J.G., X.X.G., H.J.H., Y.H.H., and C.Y.W. revised the manuscript. H.Z. and W.S.N. supervised research and provided critical advice on the study. All authors approved the final manuscript.
-)Revised Supplement figures.docx
Download MS Word (4.1 MB)Supplementary tables.xlsx
Download MS Excel (23.9 MB)Data availability statement
The datasets analysed during the current study are available in the TCGA database; https://www.cancer.gov/tcga/, GEO repository; https://www.ncbi.nlm.nih.gov/geo/, and Xena browser: https://gdc.xenahubs.net. Accession numbers in GEO have been described in the section ‘Materials and Methods’ and Table S1. And custom analysis scripts are available at https://github.com/ShuangyueMa/DMH_glioma.
Disclosure statement
No potential conflict of interest was reported by the author(s).
Supplementary material
Supplemental data for this article can be accessed online at https://doi.org/10.1080/15592294.2024.2318506
Additional information
Funding
References
- Wenger A, Ferreyra Vega S, Kling T, et al. Intratumor DNA methylation heterogeneity in glioblastoma: implications for DNA methylation-based classification. Neuro Oncol. 2019;21(5):616–24. doi: 10.1093/neuonc/noz011
- Gimenez M, Marie SKN, Oba-Shinjo S, et al. Quantitative proteomic analysis shows differentially expressed HSPB1 in glioblastoma as a discriminating short from long survival factor and NOVA1 as a differentiation factor between low-grade astrocytoma and oligodendroglioma. BMC Cancer. 2015;15(1):481. doi: 10.1186/s12885-015-1473-9
- Ostrom QT, Bauchet L, Davis FG, et al. The epidemiology of glioma in adults: a “state of the science” review. Neuro Oncol. 2014;16(7):896–913. doi: 10.1093/neuonc/nou087
- Braunstein S, Raleigh D, Bindra R, et al. Pediatric high-grade glioma: current molecular landscape and therapeutic approaches. J Neurooncol. 2017;134(3):541–549. doi: 10.1007/s11060-017-2393-0
- Harris M, Svensson F, Kopanitsa L, et al. Emerging patents in the therapeutic areas of glioma and glioblastoma. Expert Opin Ther Pat. 2018;28(7):573–590. doi: 10.1080/13543776.2018.1494155
- Morshed RA, Young JS, Hervey-Jumper SL, et al. The management of low-grade gliomas in adults. J Neurosurg Sci. 2019;63(4):450–457. doi: 10.23736/S0390-5616.19.04701-5
- Choi S, Yu Y, Grimmer MR, et al. Temozolomide-associated hypermutation in gliomas. Neuro Oncol. 2018;20(10):1300–1309. doi: 10.1093/neuonc/noy016
- Korshunov A, Schrimpf D, Ryzhova M, et al. H3-/IDH-wild type pediatric glioblastoma is comprised of molecularly and prognostically distinct subtypes with associated oncogenic drivers. Acta Neuropathol. 2017;134(3):507–516. doi: 10.1007/s00401-017-1710-1
- Chahal M, Thiessen B, Mariano C. Treatment of older adult patients with Glioblastoma: moving towards the inclusion of a comprehensive geriatric assessment for guiding management. Curr Oncol. 2022;29(1):360–376. doi: 10.3390/curroncol29010032
- Stupp R, Mason WP, van den Bent MJ, et al. Radiotherapy plus concomitant and adjuvant temozolomide for glioblastoma. N Engl J Med. 2005;352(10):987–96. doi: 10.1056/NEJMoa043330
- Forst DA, Nahed BV, Loeffler JS, et al. Low-grade gliomas. Oncology. 2014;19(4):403–413. doi: 10.1634/theoncologist.2013-0345
- Haddad AF, Young JS, Oh JY, et al. The immunology of low-grade gliomas. Neurosurg Focus. 2022;52(2):E2. doi: 10.3171/2021.11.FOCUS21587
- Neftel C, Laffy J, Filbin MG, et al. An integrative model of cellular states, plasticity, and genetics for Glioblastoma. Cell. 2019;178(4):835–849.e21. doi: 10.1016/j.cell.2019.06.024
- Kim H, Zheng S, Amini SS, et al. Whole-genome and multisector exome sequencing of primary and post-treatment glioblastoma reveals patterns of tumor evolution. Genome Res. 2015;25(3):316–327. doi: 10.1101/gr.180612.114
- González-García I, Solé RV, Costa J. Metapopulation dynamics and spatial heterogeneity in cancer. Proc Natl Acad Sci, USA. 2002;99(20):13085–13089. doi: 10.1073/pnas.202139299
- Eder K, Kalman B. Molecular heterogeneity of glioblastoma and its clinical relevance. Pathol Oncol Res. 2014;20(4):777–787. doi: 10.1007/s12253-014-9833-3
- Klughammer J, Kiesel B, Roetzer T, et al. The DNA methylation landscape of glioblastoma disease progression shows extensive heterogeneity in time and space. Nat Med. 2018;24(10):1611–1624. doi: 10.1038/s41591-018-0156-x
- Pisanic TR 2nd, Athamanolap P, Wang TH. Defining, distinguishing and detecting the contribution of heterogeneous methylation to cancer heterogeneity. Semin Cell Dev Biol. 2017;64:5–17. doi: 10.1016/j.semcdb.2016.08.030
- Kim M, Costello J. DNA methylation: an epigenetic mark of cellular memory. Exp Mol Med. 2017;49(4):e322. doi: 10.1038/emm.2017.10
- Lister R, Pelizzola M, Dowen RH, et al. Human DNA methylomes at base resolution show widespread epigenomic differences. Nature. 2009;462(7271):315–22. doi: 10.1038/nature08514
- Scherer M, Nebel A, Franke A, et al. Quantitative comparison of within-sample heterogeneity scores for DNA methylation data. Nucleic Acids Res. 2020;48(8):e46. doi: 10.1093/nar/gkaa120
- Elliott G, Hong C, Xing X, et al. Intermediate DNA methylation is a conserved signature of genome regulation. Nat Commun. 2015;6(1):6363. doi: 10.1038/ncomms7363
- Sheffield NC, Pierron G, Klughammer J, et al. DNA methylation heterogeneity defines a disease spectrum in Ewing sarcoma. Nat Med. 2017;23(3):386–395. doi: 10.1038/nm.4273
- Li S, Garrett-Bakelman F, Perl AE, et al. Dynamic evolution of clonal epialleles revealed by methclone. Genome Biol. 2014;15(9):472. doi: 10.1186/s13059-014-0472-5
- Landau DA, Clement K, Ziller M, et al. Locally disordered methylation forms the basis of intratumor methylome variation in chronic lymphocytic leukemia. Cancer Cell. 2014;26(6):813–825. doi: 10.1016/j.ccell.2014.10.012
- Lin DC, Mayakonda A, Dinh HQ, et al. Genomic and Epigenomic Heterogeneity of Hepatocellular Carcinoma. Cancer Res. 2017;77(9):2255–2265. doi: 10.1158/0008-5472.CAN-16-2822
- Mazor T, Pankov A, Johnson B, et al. DNA methylation and somatic mutations converge on the cell cycle and define similar evolutionary histories in brain tumors. Cancer Cell. 2015;28(3):307–317. doi: 10.1016/j.ccell.2015.07.012
- Kurscheid S, Bady P, Sciuscio D, et al. Chromosome 7 gain and DNA hypermethylation at the HOXA10 locus are associated with expression of a stem cell related HOX-signature in glioblastoma. Genome Biol. 2015;16(1):16. doi: 10.1186/s13059-015-0583-7
- Kickingereder P, Neuberger U, Bonekamp D, et al. Radiomic subtyping improves disease stratification beyond key molecular, clinical, and standard imaging characteristics in patients with glioblastoma. Neuro Oncol. 2018;20(6):848–857. doi: 10.1093/neuonc/nox188
- Lee-Chang C, Miska J, Hou D, et al. Activation of 4-1BBL+ B cells with CD40 agonism and IFNγ elicits potent immunity against glioblastoma. J Exp Med. 2021;218(1). doi: 10.1084/jem.20200913
- Curran CS, Bertics PJ. Eosinophils in glioblastoma biology. J Neuroinflammation. 2012;9(1):11. doi: 10.1186/1742-2094-9-11
- Yoshihara K, Shahmoradgoli M, Martínez E, et al. Inferring tumour purity and stromal and immune cell admixture from expression data. Nat Commun. 2013;4(1):2612. doi: 10.1038/ncomms3612
- Hanzelmann S, Castelo R, Guinney J. GSVA: gene set variation analysis for microarray and RNA-seq data. BMC Bioinf. 2013;14(1):7. doi: 10.1186/1471-2105-14-7
- Aran D, Hu Z, Butte AJ. xCell: digitally portraying the tissue cellular heterogeneity landscape. Genome Biol. 2017;18(1):220. doi: 10.1186/s13059-017-1349-1
- Wang LB, Karpova A, Gritsenko MA, et al. Proteogenomic and metabolomic characterization of human glioblastoma. Cancer Cell. 2021;39(4):509–528.e20. doi: 10.1016/j.ccell.2021.01.006
- Gaujoux R, Seoighe C. A flexible R package for nonnegative matrix factorization. BMC Bioinf. 2010;11(1):367. doi: 10.1186/1471-2105-11-367
- Zheng SC, Breeze CE, Beck S, et al. EpiDISH web server: epigenetic dissection of intra-sample-heterogeneity with online GUI. Bioinformatics. 2020;36(6):1950–1951. doi: 10.1093/bioinformatics/btz833
- Newman AM, Liu CL, Green MR, et al. Robust enumeration of cell subsets from tissue expression profiles. Nat Methods. 2015;12(5):453–7. doi: 10.1038/nmeth.3337
- Teschendorff AE, Breeze CE, Zheng SC, et al. A comparison of reference-based algorithms for correcting cell-type heterogeneity in epigenome-wide association studies. BMC Bioinf. 2017;18(1):105. doi: 10.1186/s12859-017-1511-5
- Leek JT, Johnson WE, Parker HS, et al. The sva package for removing batch effects and other unwanted variation in high-throughput experiments. Bioinformatics. 2012;28(6):882–3. doi: 10.1093/bioinformatics/bts034
- Chakravarthy A, Furness A, Joshi K, et al. Pan-cancer deconvolution of tumour composition using DNA methylation. Nat Commun. 2018;9(1):3220. doi: 10.1038/s41467-018-05570-1
- Xie H, Wang M, de Andrade A, et al. Genome-wide quantitative assessment of variation in DNA methylation patterns. Nucleic Acids Res. 2011;39(10):4099–4108. doi: 10.1093/nar/gkr017
- Biró TS, Néda Z. Gintropy: gini index based generalization of entropy. Entropy (Basel). 2020;22(8):22(8. doi: 10.3390/e22080879
- Mayakonda A, Lin D-C, Assenov Y, et al. Maftools: efficient and comprehensive analysis of somatic variants in cancer. Genome Res. 2018;28(11):1747–1756. doi: 10.1101/gr.239244.118
- Wu ZB, Cai L, Qiu C, et al. CTL responses to HSP47 associated with the prolonged survival of patients with glioblastomas. Neurology. 2014;82(14):1261–5. doi: 10.1212/WNL.0000000000000290
- Rooney MS, Shukla S, Wu C, et al. Molecular and genetic properties of tumors associated with local immune cytolytic activity. Cell. 2015;160(1–2):48–61. doi: 10.1016/j.cell.2014.12.033
- Bindea G, Mlecnik B, Tosolini M, et al. Spatiotemporal dynamics of intratumoral immune cells reveal the immune landscape in human cancer. Immunity. 2013;39(4):782–95. doi: 10.1016/j.immuni.2013.10.003
- Borst J, Ahrends T, Bąbała N, et al. CD4(+) T cell help in cancer immunology and immunotherapy. Nat Rev Immunol. 2018;18(10):635–647. doi: 10.1038/s41577-018-0044-0
- Park EG, Pyo S-J, Cui Y, et al. Tumor immune microenvironment lncRNAs. Brief Bioinform. 2022;23(1):23(1. doi: 10.1093/bib/bbab504
- Kaminska B, Ochocka N, Segit P. Single-cell omics in dissecting immune microenvironment of malignant gliomas—challenges and perspectives. Cells. 2021;10(9):2264. doi: 10.3390/cells10092264
- Johnson KC, Anderson KJ, Courtois ET, et al. Single-cell multimodal glioma analyses identify epigenetic regulators of cellular plasticity and environmental stress response. Nat Genet. 2021;53(10):1456–1468. doi: 10.1038/s41588-021-00926-8
- Choo M, Mai V-H, Kim HS, et al. Involvement of cell shape and lipid metabolism in glioblastoma resistance to temozolomide. Acta Pharmacol Sin. 2023;44(3):670–679. doi: 10.1038/s41401-022-00984-6
- Zgheib R, Battaglia-Hsu S-F, Hergalant S, et al. Folate can promote the methionine-dependent reprogramming of glioblastoma cells towards pluripotency. Cell Death Dis. 2019;10(8):596. doi: 10.1038/s41419-019-1836-2
- Verhaak RGW, Hoadley KA, Purdom E, et al. Integrated genomic analysis identifies clinically relevant subtypes of glioblastoma characterized by abnormalities in PDGFRA, IDH1, EGFR, and NF1. Cancer Cell. 2010;17(1):98–110. doi: 10.1016/j.ccr.2009.12.020
- Wang Q, Hu B, Hu X, et al. Tumor evolution of Glioma-Intrinsic gene expression subtypes associates with immunological changes in the microenvironment. Cancer Cell. 2017;32(1):42–56.e6. doi: 10.1016/j.ccell.2017.06.003
- Sun H, Yin L, Li S, et al. Prognostic significance of IDH mutation in adult low-grade gliomas: a meta-analysis. J Neurooncol. 2013;113(2):277–84. doi: 10.1007/s11060-013-1107-5
- Hartmann C, Meyer J, Balss J, et al. Type and frequency of IDH1 and IDH2 mutations are related to astrocytic and oligodendroglial differentiation and age: a study of 1,010 diffuse gliomas. Acta Neuropathol. 2009;118(4):469–74. doi: 10.1007/s00401-009-0561-9
- Turcan S, Rohle D, Goenka A, et al. IDH1 mutation is sufficient to establish the glioma hypermethylator phenotype. Nature. 2012;483(7390):479–83. doi: 10.1038/nature10866
- Yan H, Parsons DW, Jin G, et al. IDH1 and IDH2 mutations in gliomas. N Engl J Med. 2009;360(8):765–73. doi: 10.1056/NEJMoa0808710
- Liu JK, Lubelski D, Schonberg DL, et al. Phage display discovery of novel molecular targets in glioblastoma-initiating cells. Cell Death Differ. 2014;21(8):1325–39. doi: 10.1038/cdd.2014.65
- Karachi A, Dastmalchi F, Mitchell DA, et al. Temozolomide for immunomodulation in the treatment of glioblastoma. Neuro Oncol. 2018;20(12):1566–1572. doi: 10.1093/neuonc/noy072
- Yuan Q, Zuo F-X, Cai H-Q, et al. Identifying differential expression genes and prognostic signature based on subventricular zone involved glioblastoma. Front Genet. 2022;13:912227. doi: 10.3389/fgene.2022.912227
- Tian Y, Liu C, Li Z, et al. Exosomal B7–H4 from irradiated glioblastoma cells contributes to increase FoxP3 expression of differentiating Th1 cells and promotes tumor growth. Redox Biol. 2022;56:102454. doi: 10.1016/j.redox.2022.102454
- Ge X, Wang Z, Jiang R, et al. SCAMP4 is a novel prognostic marker and correlated with the tumor progression and immune infiltration in glioma. Int J Biochem Cell Biol. 2021;139:106054. doi: 10.1016/j.biocel.2021.106054
- Li M, Zou D, Li Z, et al. EWAS Atlas: a curated knowledgebase of epigenome-wide association studies. Nucleic Acids Res. 2019;47(D1):D983–d988. doi: 10.1093/nar/gky1027
- Parsons DW, Jones S, Zhang X, et al. An integrated genomic analysis of human glioblastoma multiforme. Science. 2008;321(5897):1807–12. doi: 10.1126/science.1164382
- Brennan CW, Verhaak RW, McKenna A, et al. The somatic genomic landscape of glioblastoma. Cell. 2013;155(2):462–477. doi: 10.1016/j.cell.2013.09.034
- Aoki K, Nakamura H, Suzuki H, et al. Prognostic relevance of genetic alterations in diffuse lower-grade gliomas. Neuro Oncol. 2018;20(1):66–77. doi: 10.1093/neuonc/nox132
- Draaisma K, Wijnenga MMJ, Weenink B, et al. PI3 kinase mutations and mutational load as poor prognostic markers in diffuse glioma patients. Acta Neuropathol Commun. 2015;3(1):88. doi: 10.1186/s40478-015-0265-4
- Saadeh FS, Mahfouz R, Assi HI. EGFR as a clinical marker in glioblastomas and other gliomas. Int J Biol Markers. 2018;33(1):22–32. doi: 10.5301/ijbm.5000301
- Smith JS, Tachibana I, Passe SM, et al. PTEN mutation, EGFR amplification, and outcome in patients with anaplastic astrocytoma and glioblastoma multiforme. J Natl Cancer Inst. 2001;93(16):1246–1256. doi: 10.1093/jnci/93.16.1246
- Ruano Y, Ribalta T, de Lope ÁR, et al. Worse outcome in primary glioblastoma multiforme with concurrent epidermal growth factor receptor and p53 alteration. Am J Clin Pathol. 2009;131(2):257–263. doi: 10.1309/AJCP64YBDVCTIRWV
- Song MS, Carracedo A, Salmena L, et al. Nuclear PTEN regulates the APC-CDH1 tumor-suppressive complex in a phosphatase-independent manner. Cell. 2011;144(2):187–199. doi: 10.1016/j.cell.2010.12.020
- Mu M, Niu W, Zhang X, et al. LncRNA BCYRN1 inhibits glioma tumorigenesis by competitively binding with miR-619-5p to regulate CUEDC2 expression and the PTEN/AKT/p21 pathway. Oncogene. 2020;39(45):6879–6892. doi: 10.1038/s41388-020-01466-x
- Park AK, Kim P, Ballester LY, et al. Subtype-specific signaling pathways and genomic aberrations associated with prognosis of glioblastoma. Neuro Oncol. 2019;21(1):59–70. doi: 10.1093/neuonc/noy120
- Takeuchi A, Badr MESG, Miyauchi K, et al. CRTAM determines the CD4+ cytotoxic T lymphocyte lineage. J Exp Med. 2016;213(1):123–138. doi: 10.1084/jem.20150519
- Pearce EL, Mullen AC, Martins GA, et al. Control of effector CD8+ T cell function by the transcription factor eomesodermin. Science. 2003;302(5647):1041–1043. doi: 10.1126/science.1090148
- Eshima K, Chiba S, Suzuki H, et al. Ectopic expression of a T-box transcription factor, eomesodermin, renders CD4(+) Th cells cytotoxic by activating both perforin- and FasL-pathways. Immunol Lett. 2012;144(1–2):7–15. doi: 10.1016/j.imlet.2012.02.013
- Kessler T, Berberich A, Sadik A, et al. Methylome analyses of three glioblastoma cohorts reveal chemotherapy sensitivity markers within DDR genes. Cancer Med. 2020;9(22):8373–8385. doi: 10.1002/cam4.3447
- Kang EM, Yin A-A, He Y-L, et al. A five-CpG signature of microRNA methylation in non-G-CIMP glioblastoma. CNS Neurosci Ther. 2019;25(9):937–950. doi: 10.1111/cns.13133
- Urup T, Gillberg L, Kaastrup K, et al. Angiotensinogen promoter methylation predicts bevacizumab treatment response of patients with recurrent glioblastoma. Mol Oncol. 2020;14(5):964–973. doi: 10.1002/1878-0261.12660
- Chen KC, Chen P-H, Ho K-H, et al. IGF-1-enhanced miR-513a-5p signaling desensitizes glioma cells to temozolomide by targeting the NEDD4L-inhibited Wnt/β-catenin pathway. PloS One. 2019;14(12):e0225913. doi: 10.1371/journal.pone.0225913
- Bady P, Kurscheid S, Delorenzi M, et al. The DNA methylome of DDR genes and benefit from RT or TMZ in IDH mutant low-grade glioma treated in EORTC 22033. Acta Neuropathol. 2018;135(4):601–615. doi: 10.1007/s00401-018-1810-6
- Akgül S, Patch A-M, D’Souza RCJ, et al. Intratumoural heterogeneity underlies distinct therapy responses and treatment resistance in Glioblastoma. Cancers (Basel). 2019;11(2):11(2. doi: 10.3390/cancers11020190
- Yeo AT, Rawal S, Delcuze B, et al. Single-cell RNA sequencing reveals evolution of immune landscape during glioblastoma progression. Nat Immunol. 2022;23(6):971–984. doi: 10.1038/s41590-022-01215-0
- Kleijn A, van den Bossche W, Haefner ES, et al. The sequence of Delta24-RGD and TMZ administration in malignant glioma affects the role of CD8(+)T cell anti-tumor activity. Mol Ther Oncolytics. 2017;5:11–19. doi: 10.1016/j.omto.2017.02.002
- Dejaegher J, Solie L, Hunin Z, et al. DNA methylation based glioblastoma subclassification is related to tumoral T-cell infiltration and patient survival. Neuro Oncol. 2021;23(2):240–250. doi: 10.1093/neuonc/noaa247