
 ?Mathematical formulae have been encoded as MathML and are displayed in this HTML version using MathJax in order to improve their display. Uncheck the box to turn MathJax off. This feature requires Javascript. Click on a formula to zoom.
ABSTRACT
Although DNA methylation (DNAm) has been implicated in the pathogenesis of numerous complex diseases, from cancer to cardiovascular disease to autoimmune disease, the exact methylation sites that play key roles in these processes remain elusive. One strategy to identify putative causal CpG sites and enhance disease etiology understanding is to conduct methylome-wide association studies (MWASs), in which predicted DNA methylation that is associated with complex diseases can be identified. However, current MWAS models are primarily trained using the data from single studies, thereby limiting the methylation prediction accuracy and the power of subsequent association studies. Here, we introduce a new resource, MWAS Imputing Methylome Obliging Summary-level mQTLs and Associated LD matrices (MIMOSA), a set of models that substantially improve the prediction accuracy of DNA methylation and subsequent MWAS power through the use of a large summary-level mQTL dataset provided by the Genetics of DNA Methylation Consortium (GoDMC). Through the analyses of GWAS (genome-wide association study) summary statistics for 28 complex traits and diseases, we demonstrate that MIMOSA considerably increases the accuracy of DNA methylation prediction in whole blood, crafts fruitful prediction models for low heritability CpG sites, and determines markedly more CpG site-phenotype associations than preceding methods. Finally, we use MIMOSA to conduct a case study on high cholesterol, pinpointing 146 putatively causal CpG sites.
Introduction
DNA methylation (DNAm), the epigenetic mechanism of adding methyl groups (CH3) to the genome, serves an essential role in the regulation of gene expression [Citation1]. Inter-individual variation in DNAm has been linked to the etiology of many complex traits through conventional epidemiological studies. However, its impact on disease development is not yet well characterized, primarily due to several common issues encountered in observational studies, including selection bias, unmeasured confounding factors, and reverse causation. One strategy to address such limitations is to employ methylome-wide association studies (MWASs) [Citation2–4], in which differential methylation at CpG sites is associated with traits. Similar to transcriptome-wide association studies (TWASs) [Citation5–8], which link traits with differential gene expression, MWAS employs an instrumental variable regression setup involving two steps. First, MWAS constructs DNA methylation prediction, or imputation, models for a set of CpG sites using a methylation quantitative trait loci (mQTL) reference panel. These mQTLs represent genetic loci that explain variation in DNAm levels, and the reference panel consists of both genetic and DNAm data. Second, MWAS tests the association between predicted DNA methylation levels and traits of interest.
While appealing, current MWASs, to our knowledge, rely on individual-level mQTL reference panels, which consist of DNAm levels and SNPs for individual study participants to build DNAm prediction models, thus limiting statistical power due to the limited sample sizes of these reference panels. To ameliorate this limitation, we use a summary-level mQTL reference, in which only the overall effect of SNPs on DNAm levels across the set of participants is available, to build the MWAS Imputing Methylome Obliging Summary-Level mQTLs and Associated LD matrices (MIMOSA) [Citation9], a novel and comprehensive MWAS resource that notably improves DNAm prediction accuracy beyond existing models [Citation2,Citation3] thereby improving MWAS power. Inspired by a new TWAS method, SUMMIT, [Citation8] that builds gene expression prediction models using summary-level expression quantitative trait loci (eQTLs), genetic loci that explain variation in gene expression, we build DNAm prediction models using summary-level mQTL data in whole blood (n = 27,750 individuals) from the Genetics of DNA Methylation Consortium (GoDMC) [Citation10]. The GoDMC mQTL associations are based on samples from 27,750 participants of European ancestry hailing from 36 independent studies. The DNAm was profiled in blood using Illumina HumanMethylation450 BeadChips or EPIC arrays in at least 100 participants.
Likely due to the limitations of available sample sizes of individual-level methylation reference panels, typically only prediction models with are included in MWAS downstream [Citation2,Citation4], as DNA methylation at lower heritability CpG sites cannot be modeled accurately enough. In contrast, MIMOSA includes prediction models with
(as recommended by SUMMIT), in an effort to test CpG sites with low heritability that have been largely ignored by existing MWAS models. Here, low heritability of a CpG site refers to the low prediction
, between 0.005 and 0.01, of DNAm levels at that CpG site using SNPs. Specifically, the proportion of variation in DNAm levels at the CpG site accounted for by the variation in the SNPs is between 0.005 and 0.01.
By conducting MWAS utilizing the GWAS summary statistics for 28 complex traits and diseases, we showcase the efficacy of MIMOSA in significantly enhancing the accuracy of DNAm prediction in blood. Notably, MIMOSA identifies markedly more associations between CpG sites and traits compared to existing methods. To illustrate its applicability, we present a case study focusing on high cholesterol. We provide the association results from the 28 GWAS, as well as a database of our newly developed DNA methylation prediction models (MIMOSA) and instructions for their use (see and the Data Resources subsection) as a resource to the community.
Methods
We apply SUMMIT to build the MIMOSA models, a set of DNA methylation prediction models using summary-level mQTL data. For completeness, we briefly describe the methods here. A more detailed discussion may be found in Zhang et. al [Citation8].
Penalized regression model for methylation prediction
Consider the linear regression model for estimating DNA methylation levels shown below:
where Y is the N-dimensional vector of DNAm levels for a given CpG site, corrected for covariates such as age, sex, and genetic principal components. is the standardized genotype matrix of p cis-SNPs around the CpG site.
is the mQTL effect size, and
is mean-zero random noise.
We estimate the effect size w via five distinct penalized regressions, specifically LASSO [Citation11], elastic net [Citation12], the minimax concave penalty (MCP) [Citation13], the smoothly clipped absolute deviation (SCAD) [Citation14], and MNet [Citation15]. Thus, we seek to minimize the objective function
where is the primary penalty term. Then (2) contains
, the linkage disequilibrium (LD) matrix for the SNPs (i.e., the nonrandom proclivity of SNPs to occur together), and
, the standardized marginal effect size for SNPs (the correlation between SNPs and DNA methylation levels). Denote the LD matrix with R and the standardized marginal effects with
. We may also ignore
, as it is not a function of w. Thus, the updated objective function is
We estimate r with , which comes from z-scores calculated from the summary-level mQTL database. We estimate R with
, which comes from an LD reference panel (e.g., the 1000 Genomes Project [Citation16]) used with a shrinkage estimator. Then the final objective function is approximated by
where is an additional
penalty designed to ensure a unique solution for
. We include the additional penalty following [Citation17], as we have estimated
using
and
using
, so the expression is no longer a penalized least squares problem and the solution would often be non-unique and unstable. The additional penalty term regularizes the expression. We then optimize
.
The solution to the optimization, , is found according to the coordinate descent algorithm [Citation18], which is known to converge to a local minimum. The choice of
is restricted to the set
, and a warm start is applied to generate a solution path for
. These tuning parameters are chosen to maximize
in the individual-level tuning dataset, subcohort 1 of the FHS [Citation19].
Methylation model training, tuning, and testing
The methylation prediction models were trained on summary-level mQTL data from GoDMC [Citation10]. The GoDMC mQTL associations, simply the effect sizes of SNPs on DNAm, are based on a sample size of 27,750 participants of European ancestry from 36 independent studies, and 102,965,711 candidate cis-mQTLs were identified (,
Mb from DNAm site) [Citation10]. DNAm was profiled in whole blood with Illumina HumanMethylation450 BeadChips or EPIC arrays in at minimum 100 participants of European ancestry. The DNAm data were normalized and quality-controlled (described further in [Citation10]) and adjusted for age, sex, predicted cell counts, predicted smoking, and genetic and nongenetic principal components (PCs). In the case of related participants, each of the same steps was performed in addition to fitting the genetic kinship matrix. Finally, residuals from the previous analyses were centered and standardized to have mean 0 and variance 1. Additionally, SNPs located in the MHC region (26 Mb − 34 Mb on chromosome 6) were removed due to its known complex LD structure [Citation20].
To select tuning parameters for the model, such as the previously mentioned , and
, we employ DNA methylation and genotype data from the Framingham Heart Study subcohort 1 (n = 797) [Citation19]. DNAm was profiled using the Illumina HumanMethylation450 BeadChip, and we considered unrelated individuals of European ancestry. The DNAm data were quality-controlled and normalized (as described in [Citation4]) and adjusted for age, sex, six cell-type composition variables (CD8 T cells, CD4 T cells, NK cells, B cells, monocytes, and granulocytes) using the R package minfi [Citation21], and the top 10 principal components (PCs) from the genotype data. The best tuning parameters were selected by examining
, the proportion of variance of the DNAm that can be explained by the DNAm prediction models.
To validate the model choices, we employed an independent subset of data from the Framingham Heart Study subcohort 2 [Citation19], with no overlap from the previous tuning data (n = 798). The validation data was processed in accordance with the tuning data, and we selected models for DNA methylation prediction with .
Applying MIMOSA to GWAS
The MIMOSA models can be applied to both individual- and summary-level GWAS data. For individual-level GWAS data, we use a generalized linear regression model:
where is the phenotype for the GWAS,
is the genotype data (and thus
is the imputed, or predicted, methylation),
is the matrix of covariates, and
is a chosen link function. This expression is used to test null hypothesis
, i.e., does methylation affect the phenotype.
For summary-level GWAS data, we apply a burden-style test:
where Z is a vector of z-scores for all analysed SNPs, is the estimated effect size, and L is the LD matrix for those SNPs (following SUMMIT, L is estimated by a population LD reference panel such as from the 1000 Genomes project [Citation16]).
While the above discussion on applying the MIMOSA models assumes only a single DNAm prediction model, MIMOSA can include up to five. When multiple methods build satisfactory prediction models for a single CpG site (DNAm prediction , positive correlation), following SUMMIT, we conduct an association test as in the above procedure. The results are consolidated for the CpG site with the Cauchy combination test [Citation22]. Assuming K satisfactory models, the test statistic
approximately follows the standard Cauchy distribution, , and
is the p-value for the ith model. The consolidated p-value is found with
. Notably, the test statistic T is weighted by the DNAm prediction accuracy, so better fitting models are more impactful in the consolidated p-value.
Comparison with existing methods
To demonstrate efficacy and utility, we compared MIMOSA with the DNA methylation prediction model weights generated by Baselmans et al. [Citation2]. These weights were built from individual-level, whole-blood methylation data from the BIOS Consortium [Citation23] using 4,008 samples measured via Illumina 450k arrays. The BIOS Consortium provides genetic, methylome, transcriptome, and phenotypic data on individuals from six Dutch biobanks. For each CpG site with an mQTL (151,729), a DNAm prediction model was created using LASSO penalized regression [Citation11] with all nearby (within bp, this is discussed further below) SNPs. Then, with the prediction models, summary-level GWAS for a given phenotype, and LD reference from the 1000 Genomes Project [Citation16], a burden-style test based on the test-statistic
is performed, exactly as with MIMOSA.
For the comparison, we first examined methylation prediction accuracy on the aforementioned validation set of data from the FHS, conducted by examining and correlation at each CpG site for which both methods possess weights. We tested the differences in accuracy between the two methods with the one-sided Wilcoxon signed-rank test, which compares the locations of matched samples to determine if their population means differ. We further compared the methods by analyzing GWAS summary-level data for 28 complex traits. For each method and trait, we used the Bonferroni correction to determine significance level thresholds. In an effort to make an unbiased comparison, we further compared the methods for their shared CpG site set and used identical Bonferroni-corrected significance cutoffs. We then tested the difference in the number of significant CpG sites for the two methods with the Wilcoxon signed-rank test.
We note that while both the Baselmans models and the MIMOSA models were trained on cis-SNPs, these are defined differently for the two sets of training data. For MIMOSA, the GoDMC summary-level mQTLs include all SNPs within 1 Mb ( bp) of the CpG site. For Baselmans, the BIOS Consortium mQTLs include all SNPs within 25 kb (
bp) of the CpG site. To ensure that this difference in cis-SNP window size did not drive the increased performance of MIMOSA, we compared the correlation between predicted DNAm levels and actual DNAm levels and the accuracy of DNAm prediction models for MIMOSA with the typical cis-SNP window size 1 Mb to MIMOSA with the smaller cis-SNP window size 25 kb (Supplementary Figure S4) on 10,000 randomly selected CpG sites. The models built with the larger cis-SNP window size (1 Mb) yielded comparable results to those using the smaller window size (25 kb). In more detail, for the 10,000 compared CpG sites, the larger window size models had higher correlation in 4,620, lower correlation in 4,453, and equal correlation in the remaining 927. For prediction accuracy
, the larger window size was better for 4,600 CpG sites, worse for 4,474, and equal for 926. Given the sample size of GoDMC data is large (n = 27,750) and we hope to consider all cis-SNPs when constructing methylation prediction models, we used SNPs within 1 Mb as our predictors. We leave interesting topics, such as the impact of window size, to future research.
Application to HCH GWAS
We applied MIMOSA to a set of GWAS summary data for self-reported high cholesterol from the UK Biobank to identify associated CpG sites. The data consist of 337,119 participants of European ancestry, and more details about the data are available on the UK Biobank’s website (https://biobank.ndph.ox.ac.uk/ukb/field.cgi?id=20002). Putatively causal CpG sites were identified by sensitivity analysis with 2ScML [Citation24]; these results are available in the supplementary data. We then conducted gene-set enrichment analysis with FGSEA [Citation25] to associate differential methylation along gene pathways with high cholesterol.
Simulation design
We conducted a comprehensive simulation study to assess the performance of the MIMOSA DNAm prediction models and their ability to detect associations between CpG sites and traits. The simulation aimed to evaluate key factors, including the impact of mQTL reference panel size and the comparability of results between summary-level and individual-level mQTL reference panels. Utilizing data from the UK Biobank (application number 48,240), we simulated DNAm levels and phenotype values, considering various scenarios with different levels of DNAm heritability, phenotype heritability, and the proportion of SNPs that truly impacted the DNAm levels. Our simulations covered a range of scenarios to comprehensively test the robustness of MIMOSA under varying conditions.
In more detail, genotype data were taken from the 27,750 (matching the sample size of the mQTL data from GoDMC) randomly chosen and unrelated individuals of White British descent for training the DNAm prediction models. Tuning data were drawn from an independent set of 797 (matching the sample size of the tuning data from the FHS) White British individuals, and testing data were drawn from a further 10,000 unrelated White British subjects. We randomly selected the CpG site cg00110846 on chromosome 7 for simulations.
DNAm levels and phenotype values were simulated according to equations and
, respectively. Here,
is the standardized genotype matrix,
the vector of effect sizes,
,
, and
.
represents the DNAm heritability (the proportion of the variance of the DNAm explained by SNPs) and
represents phenotype heritability (the proportion of the variance of the phenotype explained by SNPs). Let
be the proportion of causal SNPs in the DNAm model. We simulated SNP effect sizes
.
SNPs were selected to retain their weights, and the remaining weights were set equal to zero in order to ensure that
of the SNPs were truly causal. Effect sizes
and
were then re-scaled according to
and
.
To evaluate the performance of MIMOSA, we performed an association scan on the entirety of the simulated training data . Summary-level data were computed (Z-scores) by a linear regression. In addition to models built from summary-level data, individual-level data with disparate sample sizes (250, 500, 1000, 10000, 27,750) were employed to build models; these scenarios allowed us to confirm that the quality (measured by
) of DNAm prediction models increases with sample size and that MIMOSA can recapitulate individual-level results using summary-level data (where N = 27,750) only. The MIMOSA models were compared with the Baselmans method, where data of 4,008 individual-level samples from the BIOS Consortium were used to build models [Citation2]. In accordance with the real data, primary comparisons between the two methods were made using summary-level mQTLs from 27750 samples for MIMOSA, individual-level mQTLs from 4,008 samples for Baselmans, and corresponding LD reference panels for both methods.
We attempted to cover a wide range of scenarios in the simulation study by varying the DNAm heritability (0.005, 0.01, 0.1), the phenotype heritability
(0.1, 0.2), and the proportion of causal SNPs
(0.01, 0.1, 0.2). Each simulation scenario was repeated for 1,000 iterations, and statistical power was determined by the proportion of those iterations that resulted in a p-value less than the Bonferroni-corrected significance threshold
.
Results
MIMOSA summary
Leveraging summary-level mQTL data from GoDMC, we built MIMOSA, a set of comprehensive DNAm prediction models. Specifically, following SUMMIT [Citation8], we trained DNAm prediction models for each of the 123,375 CpG sites using five penalized regression methods: the elastic net [Citation12], the MNet [Citation15], the smoothly clipped absolute deviation (SCAD) [Citation14], the minimax concave penalty (MCP) [Citation13], and the LASSO [Citation11]. We drew summary-level mQTL data in blood (n = 27,750 individuals) from the GoDMC [Citation10], which is based on Illumina HumanMethylation BeadChips and Epic arrays. Subsequently, the models were tuned and validated using independent datasets from the Framingham Heart Study (FHS) [Citation19]. In particular, we used FHS subcohort 1 (n = 797) for tuning and the independent FHS subcohort 2 (n = 798) for validation. Correlated samples with an estimated identity by descent (IBD) sharing () exceeding 0.2 were excluded in the FHS datasets. The FHS datasets encompass whole blood, individual-level mQTLs for 370,785 CpG sites that passed standard quality control checks outlined in [Citation4]. Of these, 123,375 CpG sites were included in the summary-level mQTL training data obtained from GoDMC. Consequently, we constructed DNAm prediction models for these 123,375 CpG sites, as our approach necessitates both the training data from GoDMC and the tuning data from the FHS. Lastly, models trained by MIMOSA could be used in a standard MWAS: we demonstrated this by testing the association between predicted methylation and phenotype for each methylation prediction model with satisfactory performance (
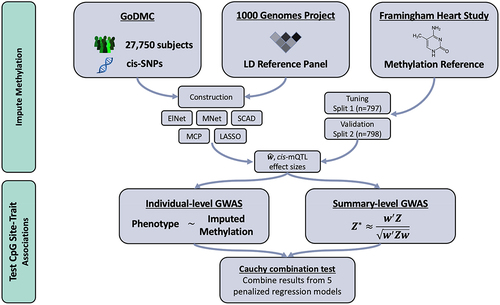
, positive correlation), resulting in a set of CpG site-trait associations. The model framework is shown in . With the more accurate DNAm prediction models of MIMOSA, more powerful MWAS may be conducted, allowing for a better understanding of disease etiology and the impact of epigenetics as more causal CpG sites are associated with traits. Researchers who wish to use the MIMOSA models are recommended to see the Data Resources subsection and use-case flow chart in .
Figure 1. MIMOSA Workflow. MIMOSA evaluates CpG site-trait associations by: 1st) training methylome prediction models; 2nd) testing associations between predicted methylation levels and phenotype. Here, ‘cis-SNPs’ refers to single nucleotide polymorphisms within 1 Mb of a particular CpG site, and ‘LD Reference Panel’ refers to the linkage disequilibrium reference panel from the 1000 Genomes Project.
MIMOSA increases accuracy in DNA methylation prediction models
We compared the prediction accuracy between MIMOSA and the models created by Baselmans et al. [Citation2] (hereafter referred to as the Baselmans models) for whole blood using independent samples from the Framingham Heart Study (FHS). The MIMOSA models were trained on summary-level mQTL data from GoDMC [Citation10], which is based on a sample size of 27,750 participants, and tuned using individual-level mQTL data (subcohort 1, n = 797) from the FHS [Citation19]. In total, MIMOSA created models for 123,375 CpG sites. The Baselmans models [Citation2] were trained on individual-level mQTL data from the BIOS Consortium [Citation23], based on samples from 4,008 participants. We evaluated the performance of both methods using independent individual-level data (subcohort 2, n = 798) from the FHS [Citation19]. To make a fair comparison, we examined the number of CpG sites with and positive Pearson’s correlation for genetically predicted vs. directly measured DNAm levels for the overlapping CpG site list (i.e., CpG sites with models created by both methods).
is the coefficient of determination, and it refers to the proportion of variance of the DNA methylation that can be explained by the DNA methylation prediction models.
Of the 109,722 candidate CpG sites in the overlapping CpG site list, MIMOSA built satisfactory (, positive correlation) prediction models for 74,283, and Baselmans for 57,223. Of the 57,223 CpG sites for which the Baselmans method created a satisfactory model, MIMOSA successfully built models for 55,131 (96.3%). Furthermore, MIMOSA yielded better prediction models for 57,637 out of 76,632 (75.2%) CpG sites with
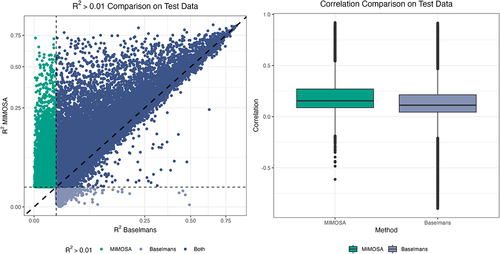
and positive correlation by either model. Regarding the correlation between real and predicted DNAm levels, the MIMOSA models produced a higher value than the Baselmans models for 78,674 of the 109,722 common CpG sites (71.7%). Average correlation for the MIMOSA models was 0.20, and average correlation for the Baselmans models was 0.14. Correlation was negative for 4,689 CpG sites (4.3%) for the MIMOSA models and 14,251 CpG sites (13.0%) for the Baselmans models. We conducted paired, one-sided Wilcoxon signed-rank tests to compare both
and correlation for the full set of 109,722 CpG sites; MIMOSA significantly improved prediction accuracy overall over the Baselmans method (
for both
and correlation). demonstrates the improved prediction accuracy of MIMOSA models. It is common in TWAS or MWAS to analyse genes or CpG sites with
to meet the relevance assumption. In contrast, we recommend including CpG sites with
and positive correlation in analyses (see [Citation8] for justifications). By using this more liberal threshold, we increased the number of testable CpG sites by 11,299.
Figure 2. Comparison. A comparison of best prediction model
on test data for all CpG sites for which either MIMOSA or Baselmans hit the
threshold.
To better understand the driving forces of the superior performance of MIMOSA compared to the Baselmans models, we explored three key differences in their training schemes: 1) the significantly larger sample size for the MIMOSA training dataset compared to Baselmans; 2) MIMOSA combines five penalized regression models, whereas Baselmans uses only LASSO; 3) the MIMOSA models are trained on SNPs within 1 Mb of the CpG sites, and the Baselmans models are trained on SNPs within 25 kb of the CpG sites. We demonstrated through simulations that increasing the sample size of the training data massively increases the accuracy of DNAm prediction models (Supplementary Figure S3). The combination of penalized regression models does improve accuracy as well, though not nearly as drastically (Supplementary Figure S1). Lastly, through the examination of a subset of CpG sites in the test dataset, we determined that the larger cis-SNP window size for MIMOSA likely favors it over Baselmans, but only marginally so (Supplementary Figure S4). In summary, the ability to train on summary-level mQTLs and the resultingly larger sample sizes drives the improvement of MIMOSA beyond the Baselmans models.
MIMOSA identifies more CpG site-trait associations
To assess the capability of MIMOSA to identify significant associations, we applied its DNAm prediction models to the GWAS summary statistics of 28 complex traits and compared the results with those using the Baselmans models. The significant results are summarized in Supplementary Table S1. As discussed previously, MIMOSA assesses CpG sites with prediction and positive correlation; however, we focused only on CpG sites with
and positive correlation here for a fair comparison. This slightly favored the competing method, as we used a more conservative significance threshold on MIMOSA. As seen in , MIMOSA identified a total of 15,151 significant associations at a Bonferroni-corrected significance threshold, a significant increase over the Baselmans method, which identified 7,680 (
per the Wilcoxon signed-rank test). MIMOSA further pinpointed 2,723 associations derived from CpG sites with
, bringing the overall association total to 17,874. We note that such a use of the Bonferroni-corrected significance threshold, 0.05/number of tests, where the number of tests is simply the number of CpG sites in the MWAS, mirrors preceding MWAS and TWAS studies [Citation2,Citation6,Citation7,Citation26]. In the interest of identifying associations with a larger effect size, we compared MWAS results at a significance threshold of
as well (Supplementary Figure S5). With this restriction, the MIMOSA models again identified significantly more associations than the Baselmans method: 11,716 vs. 5,506 (
per the Wilcoxon signed-rank test).
Figure 3. Evaluation of MIMOSA on real data. a) Number of significant associations between CpG sites and traits determined by MIMOSA and Baselmans for 28 GWAS using all CpG sites. b) Number of significant associations between CpG sites and traits determined by MIMOSA and Baselmans for 28 GWAS using shared CpG sites.
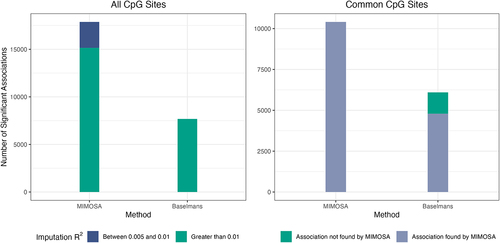
Since the two models have distinct sets of candidate CpG sites, we also compared MWAS results on the shared set of CpG sites for which both methods had prediction and positive correlation. For these 55,131 candidate sites, MIMOSA again identified significantly more associations (10,408 vs. 6,098,
, ). For the 6,098 associations identified by the Baselmans method, MIMOSA successfully identified 4,793 (78.6%) under the Bonferroni correction and 5,654 (92.7%) under a nominal p-value threshold
.
Furthermore, MIMOSA effectively analysed CpG sites with lower estimated heritability (). Still restricting to CpG sites with positive correlation, a total of 91,342 CpG sites had
and 12,873 of these had
. For the CpG sites with lower heritability (
), we found 2,723 significant CpG site-trait associations. For the remaining 78,469 CpG sites with
, we identified 15,151 significant associations. This finding indicates that CpG sites with lower
(lower estimated heritability) are just as integral as those with higher
, as the ratio of significant associations to CpG sites were very similar, 21.1% vs. 19.3%. We explored this further and examined the ratios of significant associations to CpG sites with
in bins of width 0.005 from (0.005,0.845), where 0.845 is the maximum observed
. We conducted a Kruskal-Wallis test to determine if these ratios could have come from different distributions; the resulting p-value was 0.49, which indicates that this was not the case. As a result, we concluded that lower heritability CpG sites are just as key as those with higher heritability. Notably, a similar finding has been reported for gene expression [8 [Citation27]; researchers report that genes with low expression heritability have substantially larger causal effect sizes on complex traits [Citation27].
MIMOSA determines putatively causal CpG sites for high cholesterol
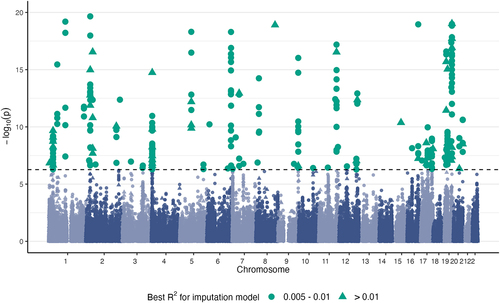
We conducted an MWAS with MIMOSA for self-reported high cholesterol using GWAS summary statistics from 337,119 participants (41,296 cases) of European ancestry from the UK Biobank. We identified 321 significantly associated CpG sites at a Bonferroni-corrected threshold (). For comparison, the Baselmans method found 165 significantly associated CpG sites, 128 of which were successfully identified by MIMOSA under the Bonferroni correction and 148 of which were identified by MIMOSA under the nominal p-value threshold 0.05. For the 321 CpG sites pinpointed by MIMOSA, we conducted sensitivity analysis with 2ScML [Citation24], a new robust TWAS method for identifying causal effects in TWAS-style studies; this indicated that 146 of the associations were putatively causal.
Figure 4. HCH Manhattan plot. CpG sites significantly associated with high cholesterol by MIMOSA at a Bonferroni-corrected p-value threshold .
We further conducted gene-set enrichment analysis with FGSEA [Citation25] to link differential methylation of CpG sites along gene pathways to high cholesterol. Eight gene sets were identified as significantly under-enriched in methylated CpG sites in participants with high cholesterol by BH-adjusted p-values: scavenging by class F receptors, binding and uptake of ligands by scavenger receptors, scavenging by class H receptors, scavenging by class A receptors, chylomicron remodeling, plasma lipoprotein remodeling, regulation of toll-like receptors (TLRs) by endogenous ligands, and post-translational protein phosphorylation. There is prior biologic knowledge supporting links between the first seven of these pathways and high cholesterol.
To expand, the first four of the aforementioned pathways (scavenging by class F receptors, binding and uptake of ligands by scavenger receptors, scavenging by class H receptors, and scavenging by class A receptors) involve scavenger receptors, which are a set of receptors that can recognize molecular patterns associated with danger [Citation28]. Scavenger receptors are often involved in the uptake of modified low-density lipoproteins (LDLs) that encourage cellular accumulation of cholesterol [Citation29,Citation30]. The following two pathways (chylomicron remodeling and plasma lipoprotein remodelling) deal with remodelling lipoproteins. Chylomicrons are large, diffuse LDLs produced to facilitate the transport of dietary triglycerides and cholesterol by binding to them, though they must be converted to chylomicron remnants in plasma to bind to LDL receptors on the surface of liver cells to remove cholesterol from circulation [Citation31]. Lastly, endogenous ligands bind to receptors to produce physiological responses; damage-associated molecular patterns (DAMPs) fulfill this role for TLRs to regulate the innate immune system. Furthermore, DAMPs have been linked to the pathogenesis of atherosclerosis [Citation32], in which plaques, including cholesterol, harden in the arteries.
The finding of a potential role of post-translational protein phosphorylation for high cholesterol is rather novel, which warrants further investigation in the future. From a broader perspective, these results underscore the capacity of MIMOSA to effectively generate improved methylation prediction models, thereby boosting the results in downstream analyses. The consistency of most of our findings with existing literature provides reassurance against concerns of false positives.
Simulation studies confirm the superior performance of MIMOSA
We conducted a simulation study to confirm the superior performance of the MIMOSA models. To save space, we describe the majority of the simulation results in the supplementary material, rather than the main body of the work. Briefly, in simulations based on a randomly selected CpG site, cg00110846, with varying values for methylation heritability , causal proportion of SNPs
, and phenotypic heritability
, MIMOSA consistently outperforms the Baselmans method in both DNAm prediction accuracy and power to detect associations in MWAS (Supplementary Figure S2). Furthermore, we explored the impact of the sample size of the mQTL training dataset on DNAm prediction accuracy. Naturally, prediction accuracy, or
, increases as the sample size increases. Additionally, for the true sample size of the GoDMC data (n = 27,750), MIMOSA can perform nearly as well when trained with summary-level mQTLs (
= 0.093) versus individual-level mQTLs (
= 0.094).
Data resources
As the MIMOSA models are provided as a resource to the community, we wish to make clear how the resources may be used. We constructed a flow chart () for common scenarios in which one may want to use our resources. We anticipate that there are three such cases.
Figure 5. Flow chart for using the MIMOSA models.
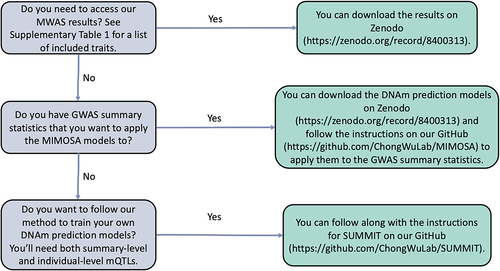
First, we provide the full MWAS results for 28 GWAS traits on Zenodo https://zenodo.org/record/8400313. Simply download the MIMOSA_MWAS_Results.zip file, unzip the directory with whatever method is preferred, and the full set of MWAS results are available as text files.
Second, we provide the newly built DNA methylation prediction models (MIMOSA), which are also available on Zenodo https://zenodo.org/record/8400313. Download and unzip the MIMOSA-Models.zip file, and models for each of the CpG sites we considered will be available. Instructions for preparing GWAS summary statistics and running the MIMOSA models are available on our GitHub https://github.com/ChongWuLab/MIMOSA.
Third, one may have a different set of summary-level mQTLs, perhaps from another ancestry group or tissue, and wish to train their own set of DNAm prediction models. This can be accomplished by following the SUMMIT [Citation8], for which instructions are also available on our GitHub https://github.com/ChongWuLab/SUMMIT.
Discussion
We built a comprehensive source of DNAm prediction models, MIMOSA, which was created following the SUMMIT method [Citation8] with a large, summary-level mQTL dataset from GoDMC [Citation10]. MIMOSA notably improved prediction accuracy for the methylome and, through this, increased power to identify associations in MWAS by successfully leveraging the large sample size of the training data. We demonstrated through the analysis of GWAS results for complex traits that MIMOSA provided an appreciable step forward from previous MWAS models that were only able to be trained with individual-level mQTL data. MIMOSA increased accuracy in methylation prediction, identified more CpG site-trait associations, and was able to analyse CpG sites with lower heritability (i.e., prediction ). Furthermore, as larger summary-level mQTL datasets are released, it is eminently possible to scale the MIMOSA models up by retraining them on the larger samples, further improving results.
MWAS can be viewed as one type of instrumental variable (IV) regression, which seeks causal relationships between exposures and outcomes using instrumental variables [Citation33,Citation34]. From this perspective, the optimal instrument is the genetic prediction score combining information from multiple SNPs and providing the best prediction accuracy [Citation35]. This explains why the MIMOSA models, which feature better prediction accuracy, increase the statistical power to identify (causal) associations in MWAS. However, it is crucial to note that causal interpretations are valid only when all genetic variants used to predict DNAm are valid instrumental variables (IVs) [Citation5]. Given the prevalence of horizontal pleiotropy, which violates instrumental variable assumptions [Citation36], it is essential to consider and model potential violations of these assumptions. The exploration of these exciting topics is left to future research.
The new MIMOSA resource is largely motivated by our previous work, SUMMIT [Citation8], where we built gene expression prediction models for TWAS using SUMMIT with summary-level eQTL data. While MIMOSA follows SUMMIT, the resource is equally important and widely needed by the community, as powerful DNA methylation prediction models, such as those featured here, will help us gain substantial insights into the etiology of complex diseases [Citation37,Citation38].
We conclude by discussing the limitations of the current study. First, MIMOSA is built from mQTL data from whole blood from participants of European ancestry. Thus, the provided methylation prediction weights are appropriate for identifying CpG sites in whole blood for participants of European ancestry. With the eventual release of large, summary-level mQTL datasets for participants of other ancestry groups or using samples from other tissues, the MIMOSA method can be applied to train and tune new models appropriate for diverse cohorts. Fortunately, as blood cells play a key role in the immune system and are relevant to many phenotypes, this is a natural starting place. Second, the summary-level mQTL data used in MIMOSA are based on microarray technology (Illumina HumanMethylation BeadChips and Epic arrays), limiting our analysis to only 1.5% of the ~28 million DNAm sites across the genome [Citation39]. With the recent advancement in whole-genome bisulphite sequencing, we expect the percentage of analysable CpG sites to grow substantially in the future. The MIMOSA framework can be scaled up to more CpG sites once such summary-level datasets become available to the community. We further note that, until large, summary-level mQTL datasets other than GoDMC [Citation10] are available, we cannot unbiasedly replicate the MWAS results presented in this work. We additionally emphasize that the MWAS results should be independently verified on additional GWAS datasets if possible, though this is left to future work.
Additionally, while individual-level mQTL data cannot be used to train the MIMOSA models directly, such data could potentially be converted to the summary-level and combined with other summary-level data (e.g., GoDMC) through meta-analysis to further improve the prediction model performance. Furthermore, we focused on cis-SNPs to build prediction models and did not consider the effect of trans-mQTLs. Possibilities for future work include incorporating such trans information or leveraging methylation data generated from samples other than whole blood, such as in TWAS methods UTMOST [Citation7] and MR-JTI [Citation26]. We anticipate either direction will further improve the performance, though substantial additional work may be needed. For example, the effect size of trans-mQTLs is often weaker and is more likely to be impacted by horizontal pleiotropy [Citation10]. Leveraging information generated from outside of the blood may also violate the valid IV assumptions because the used IVs may affect several tissues simultaneously. Finally, as discussed above, the causal argument of MWAS results (including using the MIMOSA models) carries weight only when instrumental variable assumptions hold. Therefore, careful interpretation of MWAS results is warranted, and additional sensitivity analyses such as 2ScML [Citation24] should be conducted.
Code availability statement
Code to use the MIMOSA models in MWAS is available on GitHub https://github.com/ChongWuLab/MIMOSA. Code and data to reproduce the results in this study are available on Zenodo https://zenodo.org/record/8400313.
MIMOSA_Supplementary_Table.xlsx
Download MS Excel (1.4 MB)Supplementary_3.pdf
Download PDF (1.2 MB)Acknowledgments
The content in this study is solely the responsibility of the authors and does not necessarily represent the official views of the National Institutes of Health. This study was conducted using the UK Biobank recourse under Application Number 48240 (https://www.ukbiobank.ac.uk/researchers/). We thank Dr. Jihwan Ha at University of Hawaii Cancer Center for his help for this study. The authors would like to thank all of the individuals for their participation in the GWASs and UK Biobank and all the researchers, clinicians, technicians and administrative staff for their contribution to the studies and for making their GWAS summary results publicly available.
Disclosure statement
No potential conflict of interest was reported by the author(s).
Data availability statement
The mQTL summary data are available at http://mqtldb.godmc.org.uk/downloads. The datasets of FHS Offspring Cohort are publicly available via dbGaP (www.ncbi.nlm.nih.gov/gap): dbGaP Study Accession: phs000342 and phs000724. The UK Biobank is an open-access resource but requires registration, available at https://www.ukbiobank.ac.uk/researchers/. The Baselmans models can be downloaded from http://bbmri.researchlumc.nl/atlas/#data. The 1000 Genomes Project data can be downloaded from https://www.internationalgenome.org/data. The genetic distance data for 1000 Genomes Project can be downloaded from https://github. com/joepickrell/1000-genomes-genetic-maps. The MIMOSA models are available at Zenodo https://zenodo.org/record/8400313. Real data results are available at Zenodo as well https://zenodo.org/record/8400313, where they can be easily downloaded.
Supplemental material
Supplemental data for this article can be accessed online at https://doi.org/10.1080/15592294.2024.2370542
Additional information
Funding
References
- Jones PA. Functions of DNA methylation: islands, start sites, gene bodies and beyond. Nat Rev Genet. 2012 July;13(7):484–15. issn: 1471-0064. doi:10.1038/nrg3230
- Baselmans BML, Jansen R, Ip HF, et al. Multivariate genome-wide analyses of the well-being spectrum. Nat Genet. 2019;51(3):445–451. issn: 15461718. doi: 10.1038/s41588-018-0320-8
- Barbu MC, Huider F, Campbell A, et al. Methylome-wide association study of antidepressant use in generation Scotland and the Netherlands Twin Register implicates the innate immune system. Mol Psychiatry. 2021. Oct;27(3):1647–1657. issn: 14765578. doi: 10.1038/s41380-021-01412-7
- Wu L, Venters CC, Di C, et al. An integrative multi-omics analysis to identify candidate DNA methylation biomarkers related to prostate cancer risk. Nat Commun. 2020 Aug;11(1):1–11. issn: 2041-1723. doi: 10.1038/s41467-019-13993-7
- Gusev A, Ko A, Shi H, et al. Integrative approaches for large-scale transcriptome-wide association studies. Nat Genet. 2016. 48(3):245–252. issn: 15461718. doi: 10.1038/ng.3506
- Gamazon ER, Wheeler HE, Shah KP, et al. A gene-based association method for mapping traits using reference transcriptome data. Nat Genet. 2015;47(9):1091–1098. issn: 15461718. doi: 10.1038/ng.3367
- Hu Y, Li M, Lu Q, et al. A statistical framework for cross-tissue transcriptome-wide association analysis. Nat Genet. 2019 Feb;51(3):568–576. issn: 1546-1718. doi: 10.1038/s41588-019-0345-7
- Zhang Z, Bae YE, Bradley JR, et al. SUMMIT: an integrative approach for better transcriptomic data imputation improves causal gene identification. Nat Commun. 2022 Oct 1;13(1):1–12. issn: 2041–1723. doi: 10.1038/s41467-022-34016-y
- Melton HJ, Zhang Z, Deng, HW, et al. MIMOSA: a resource consisting of improved methylome imputation models increases power to identify DNA methylation-phenotype associations (Preprint). medRxiv: Prepr Serv Health Sci. 2023 Oct.
- Min JL, Hemani G, Hannon E, et al. Genomic and phenotypic insights from an atlas of genetic effects on DNA methylation. Nature Genet. 2021;53(9):1311–1321. issn: 15461718. doi: 10.1038/s41588-021-00923-x
- Tibshirani R. Regression Shrinkage and Selection via the Lasso. J Royal Stat Soc Ser B (Methodological). 1996 Jan;58(1):267–288. issn: 25176161. doi: 10.1111/j.2517-6161.1996.tb02080.x
- Zou H, Hastie T. Regularization and variable selection via the elastic net. J R Stat Soc Series B Stat Methodol. 2005 Apr;67(2):301–320. issn: 1467-9868. doi: 10.1111/j.1467-9868.2005.00503.x
- Zhang C-H. Nearly unbiased variable selection under minimax concave penalty. Ann Stat. 2010 2;38(2):894–942. doi: 10.1214/09-AOS729
- Fan J, Li R. Variable selection via nonconcave penalized likelihood and its oracle properties. J Am Stat Assoc. 2001 Dec;96(456):1348–1360. issn: 0162-1459. doi: 10.1198/016214501753382273
- Huang J, Breheny P, Lee S, et al. The Mnet method for variable selection. Stat Sinica. 2016;26:903–923. doi: 10.5705/ss.202014.0011
- Auton A, Abecasis GR, Altshuler DM, et al. A global reference for human genetic variation. Nature. 2015 Sept;526(7571):68–74. issn: 1476-4687. doi: 10.1038/nature15393
- Mak TSH, Porsch RM, Choi SW, et al. Polygenic scores via penalized regression on summary statistics. Genet Epidemiol. 2017;41(6):469–480. doi: 10.1002/gepi.22050
- Friedman J, Hastie T, Tibshirani R. Regularization paths for generalized linear models via coordinate descent. J Stat Softw. 2010;33(1):1. issn: 15487660. doi: 10.18637/jss.v033.i01
- Kannel WB, Feinleib M, McNamara PM, et al. An investigation of coronary heart disease in families: the Framingham offspring study. Am J Epidemiol. 1979 Sept;110(3):281–290. issn: 0002-9262. doi: 10.1093/oxfordjournals.aje.a112813
- Zheng J, Haberland V, Baird D, et al. Phenome-wide Mendelian randomization mapping the influence of the plasma proteome on complex diseases. Nature Genet. 2020;52(10):1122–1131. issn: 15461718. doi: 10.1038/s41588-020-0682-6
- Aryee MJ, Jaffe AE, Corrada-Bravo H, et al. Minfi: a flexible and comprehensive Bioconductor package for the analysis of Infinium DNA methylation microarrays. Bioinformatics. 2014;30(10):1363–1369. doi: 10.1093/bioinformatics/btu049
- Liu X, Li YI, Pritchard JK. Trans effects on gene expression can drive omnigenic inheritance. Cell. 2019 May;177(4):1022–1034.e6. issn: 1097-4172. doi: 10.1016/j.cell.2019.04.014
- Zhernakova DV, Deelen P, Vermaat M, et al. Identification of context-dependent expression quantitative trait loci in whole blood. Nat Genet. 2016 Dec 1;49(1):139–145. issn: 1546-1718. doi: 10.1038/ng.3737
- Xue H, Shen X, Pan W. Causal inference in transcriptome-wide association studies with invalid instruments and GWAS summary data. J Am Stat Assoc. 2023 Mar;118(543):1–27. issn: 0162-1459.
- Korotkevich G, Sukhov V, Budin N, et al. Fast gene set enrichment analysis. bioRxiv. 2021 Feb:060012.
- Zhou D, Jiang Y, Zhong X, et al. A unified framework for joint-tissue transcriptome-wide association and Mendelian randomization analysis. Nat Genet. 2020 Oct;52(11):1239–1246. issn: 1546-1718. doi: 10.1038/s41588-020-0706-2
- Yao DW, O’Connor LJ, Price AL, et al. Quantifying genetic effects on disease mediated by assayed gene expression levels. Nat Genet. 2020 May;52(6):626–633. issn: 15461718. doi: 10.1038/s41588-020-0625-2
- Canton J, Neculai D, Grinstein S. Scavenger receptors in homeostasis and immunity. Nat Rev Immunol. 2013 Aug 9;13(9):621–634. issn: 1474-1741. doi: 10.1038/nri3515
- Moore KJ, Freeman MW. Scavenger receptors in atherosclerosis. Arteriosclerosis Thrombosis Vasc Biol. 2006 Aug 8;26(8):1702–1711. issn: 10795642. doi: 10.1161/01.ATV.0000229218.97976.43
- Van Berkel TJC, VAN Eck M, Herijgers N, et al. Scavenger receptor classes a and B: their roles in atherogenesis and the metabolism of modified LDL and HDL. Ann N Y Acad Sci. 2000 May 1;902(1):113–127. issn: 1749-6632. doi: 10.1111/j.1749-6632.2000.tb06306.x
- Redgrave TG. Chylomicron metabolism. Biochem Soc Trans. 2004 Feb 1;32(1):79–82. issn: 0300-5127. doi: 10.1042/bst0320079
- Roh JS, Hyun Sohn D. Damage-associated molecular patterns in inflammatory diseases. Immune Netw. 2018). issn: 20926685. Aug 4;18(4). doi: 10.4110/in.2018.18.e27
- Pierce BL, Burgess S. Efficient design for Mendelian randomization studies: subsample and 2-sample instrumental variable estimators. Am J Epidemiol. 2013 Oct;178(7):1177–1184. issn: 1476-6256. doi: 10.1093/aje/kwt084
- Smith GD, Ebrahim S. ‘Mendelian randomization’: can genetic epidemiology contribute to understanding environmental determinants of disease? Int J Epidemiol. 2003 Feb;32(1):1–22. issn: 0300-5771. doi: 10.1093/ije/dyg070
- Belloni A, Chen D, Chernozhukov V, et al. Sparse models and methods for optimal instruments with an application to eminent domain. Econometrica. 2012 Nov 6;80(6):2369–2429. issn: 1468-0262.
- Verbanck M, Chen C-Y, Neale B, et al. Detection of widespread horizontal pleiotropy in causal relationships inferred from Mendelian randomization between complex traits and diseases. Nat Genet. 2018 Apr;50(5):693–698. issn: 1546-1718. doi: 10.1038/s41588-018-0099-7
- Wahl S, Drong A, Lehne B, et al. Epigenome-wide association study of body mass index, and the adverse outcomes of adiposity. Nature. 2016 Dec;541(7635):81–86. issn: 1476-4687. doi: 10.1038/nature20784
- Chambers JC, Loh M, Lehne B, et al. Epigenome-wide association of DNA methylation markers in peripheral blood from Indian Asians and Europeans with incident type 2 diabetes: a nested case-control study. Lancet Diabetes Endocrinol. 2015 July;3(7):526. issn: 22138595. doi: 10.1016/S2213-8587(15)00127-8
- Pidsley R, Zotenko E, Peters TJ, et al. Critical evaluation of the Illumina MethylationEPIC BeadChip microarray for whole-genome DNA methylation profiling. Genome Bio. 2016 Oct 1;17(1):1–17. issn: 1474760X. doi: 10.1186/s13059-016-1066-1