
 ?Mathematical formulae have been encoded as MathML and are displayed in this HTML version using MathJax in order to improve their display. Uncheck the box to turn MathJax off. This feature requires Javascript. Click on a formula to zoom.
ABSTRACT
Early detection is crucial for increasing the survival rate of gastric cancer (GC). We aimed to identify a methylated cell-free DNA (cfDNA) marker panel for detecting GC. The differentially methylated CpGs (DMCs) were selected from datasets of The Cancer Genome Atlas (TCGA) and Gene Expression Omnibus (GEO) databases. The selected DMCs were validated and further selected in tissue samples (40 gastric cancer and 36 healthy white blood cell samples) and in a quarter sample volume of plasma samples (37 gastric cancer, 12 benign gastric disease, and 43 healthy individuals). The marker combination selected was then evaluated in a normal sample volume of plasma samples (35 gastric cancer, 39 control diseases, and 40 healthy individuals) using real-time methylation-specific PCR (MSP). The analysis of the results compared methods based on 2−ΔΔCt values and Ct values. In the results, 30 DMCs were selected through bioinformatics methods, and then 5 were selected for biological validation. The marker combination of two fragments of IRF4 (IRF4–1 and IRF4–2) and one of ZEB2 was selected due to its good performance. The Ct-based method was selected for its good results and practical advantages. The assay, IRF4–1 and IRF4–2 in one fluorescence channel and ZEB2 in another, obtained 74.3% sensitivity for the GC group at any stage, at 92.4% specificity. In conclusion, the panel of IRF4 and ZEB2 in plasma cfDNA demonstrates good diagnostic performance and application potential in clinical settings.
Introduction
Gastric cancer (GC) is a prevalent cancer, ranking fifth in terms of incidence and fourth in terms of cancer-related mortality worldwide [Citation1]. The highest incidence rates are observed in Eastern Asia, particularly in China, Korea, and Japan [Citation2]. In China, gastric cancer is the third most commonly diagnosed cancer and the third most common cause of cancer-related mortality. In 2022, it is estimated that there would be 509,421 new cases and 400,415 deaths due to gastric cancer [Citation2].
Gastric cancer (GC) has a worldwide survival rate of around 30% [Citation3], including China [Citation4]. The majority of patients are asymptomatic during the early stages of the disease, resulting in over 80% of patients being diagnosed at a late stage [Citation5,Citation6]. However, when diagnosed early, the 5-year survival rate for gastric cancer is 80–90%, compared to less than 30% when diagnosed in advanced stages [Citation7–11]. However, it is important to note that this scenario does not account for Japan and Korea. In these countries, screening for GC is predominantly done in a structured manner, which has led to diagnoses of GC in early stages and increased 5-year survival rates to well above 60% [Citation12]. Therefore, screening for GC is crucial for improving 5-year survival rates.
The incidence of gastric cancer (GC) is primarily related to Helicobacter pylori (H. pylori) infection, which accounts for the majority of endemic cases [Citation13,Citation14]. Additionally, approximately 10% of GC cases are associated with Epstein-Barr virus (EBV) infection [Citation15]. Non-infectious factors such as smoking, high intake of salt, red meat, processed and smoked meat are also associated with GC [Citation3]. Over the last five decades, there has been a clear decline in the incidence of GC worldwide. The decline in prevalence of H. pylori infection and reduction in consumption of salty and smoked foods are the main factors attributed to this decline [Citation16,Citation17].
Endoscopy with sampling of gastric biopsies for histological examination is currently considered the gold standard for screening and diagnosing GC. Although serum tumour markers, including CEA, CA-125, and CA 19–9, are used clinically, their utility is limited due to low sensitivity and specificity [Citation18]. In Japan and China, H. pylori antibody and serum pepsinogen levels have also been used as a combined method of screening, but it has a high false-positive rate for GC [Citation19,Citation20]. The strongest evidence has been accumulated for a low serum pepsinogen I level and low pepsinogen I to pepsinogen II ratio, as reliable markers for atrophic gastritis [Citation21,Citation22]. Therefore, there is still a need for less invasive or non-invasive tests, as well as highly specific biomarkers for GC [Citation23].
DNA methylation is a widely studied epigenetic mechanism that mainly involves the modification of 5-methylcytosine (5-mC) and 5-hydroxymethylcytosine (5-hmC) of DNA. It has been identified as an early event in several tumours, indicating that altered DNA methylation patterns could be one of the first detectable neoplastic changes associated with tumorigenesis [Citation24]. DNA methylation biomarkers have been used in commercial products for other cancers, such as colorectal cancer, in recent years [Citation25,Citation26].
One promising non-invasive approach for cancer detection is the detection of circulating cell-free DNA (cfDNA), which is circulating extracellular DNA found in blood and other body fluids [Citation27]. cfDNA, with a length of 150–180 bp, is released by necrotic or apoptotic normal cells or tumour cells. The detection of circulating cell-free tumour DNA (ctDNA) [Citation28,Citation29], a type of non-invasive ‘liquid biopsy,’ can revolutionize cancer screening and diagnosis due to its many advantages [Citation30,Citation31]. Real-time monitoring of tumour status can be achieved through minimally invasive methods. This approach can reveal tumours that may not be apparent or are indeterminate on imaging [Citation32].
Cancer-specific DNA methylation in ctDNA has been investigated as a feasible biomarker in cancers [Citation33]. Various DNA methylation biomarkers have been identified in gastric cancer [Citation27,Citation34–37]. However, these studies have some limitations. Focusing on single biomarkers leads to suboptimal performance [Citation34,Citation36]. The assays based on the MSP of methylated and unmethylated products for result determination are complex to apply [Citation35,Citation38,Citation39]. Serum is used as a sample type, which has been shown to be inferior to plasma [Citation34,Citation39]. Given the advancements in technology and the availability of cancer datasets, it is imperative to identify additional biomarkers using a bioinformatics-based methods, to develop assays based on real-time MSP of methylated products, and validate and evaluate marker combinations in clinical cohorts for detecting gastric cancer.
The objective of this study is to identify methylated cfDNA biomarkers and develop a test for detecting gastric cancer. Initially, we screened DNA methylation biomarkers using datasets of stomach cancer (STAD) from The Cancer Genome Atlas (TCGA) and normal gastric tissues from Gene Expression Omnibus (GEO) databases. We designed and validated primers and MGB probes for the selected 5 biomarkers for real-time methylation-specific PCR (MSP) in the TaqMan system. Five biomarkers were validated in tissue samples by MSP. Then, four biomarkers selected was evaluated in 1/4 amount of plasma samples to assess the effectiveness of each marker and marker combinations. Finally, the diagnostic performance of the three-biomarkers combination selected was evaluated in normal amount of plasma samples.
Patients and methods
Study design and participants
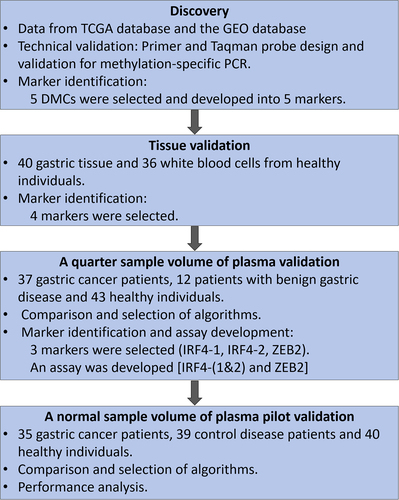
shows the design and workflow chart for identifying, selecting, and validating the methylated cfDNA marker panel for gastric cancer in this study.
Figure 1. The design and workflow chart for identifying, selecting and validating the methylated cfDNA maker panel for gastric cancer.
The specimens used in this study was from and approved by the First Affiliated Hospital of Zhengzhou University. Each participant signed an informed consent form, and the study protocol complied with the principles of the Declaration of Helsinki. The clinical trial was registered on the ClinicalTrials.gov (registration number NCT05685524), the American Clinical Trial Registry website.
For tissue selection and validation, 40 samples of gastric cancer tissue and 36 white blood cells were used. The patient characteristics are summarized in Table S1.
For the validation of a quarter and total sample amounts of plasma, 37 and 35 samples from individuals with gastric cancer, and 43 and 40 samples from healthy individuals were used, respectively. Additionally, 12 samples from individuals with gastric disease (gastric polyps, non-atrophic gastritis) were used for the a quarter sample volume experiment, and 39 samples from individuals with control disease (orthopaedic disorders) were used for the normal sample volume of plasma validation. The characteristics of the patients are summarized in .
Table 1. Patient and tumour characteristics of gastric adenocarcinoma in plasma validation.
The inclusion criteria for patients with gastric adenocarcinoma were as follows: patients aged 18 years or older who were clinically diagnosed with the disease and were not diagnosed with any other malignant tumours except for metastatic tumours of primary gastric adenocarcinoma. The control disease group consisted of patients with orthopaedic disorders, such as arthritis, fractures, spinal disc herniation, etc.
Biomarker discovery and selection
To supplement the Infinium Methylation 450K data of 393 gastric adenocarcinoma tissue samples and only 2 normal adjacent tissue (NATs) samples in STAD dataset in TCGA cohort, we included GEO datasets of normal gastric tissues. Specifically, we used GSE103186, GSE85464 and GSE85467, and GSE99553, which included 61, 19 and 84 normal gastric tissue samples, respectively. It is important to note that in GSE103186, the 61 samples were adjacent tissues of intestinal metaplasia, while in GSE85464 and GSE85467, the 19 samples were NATs. In GSE99553, the 42 samples were NATs and the other 42 samples were normal gastric tissues from healthy individuals. Three datasets of raw IDAT data were downloaded and processed in the same manner before being merged into a single dataset as a normal control group. The GSE40279 cohort included whole blood cell (WBC) samples collected from 656 healthy individuals.
Differentially methylated regions (DMRs) between GC tissues and the normal tissues were identified by a sliding window method, which was described previously [Citation40]. Briefly, the probes within 2 kb upstream of TSS, gene body, and 0.2 kb downstream of differentially methylated genes (DMGs) were selected and sorted by their coordinates. With a predefined window size and step size, these probes were separated into multiple fragments with overlapping regions of equal length. The mean methylation level of the probes within each sliding window was calculated as the methylation level of the region. Finally, ∆β values were defined as the different methylation levels of CpG regions between tumour and normal samples. The receiver operating characteristic (ROC) analysis was performed with the methylation levels (defined as the mean β value of each sliding window) as test variables and ‘cancer’/‘non-cancer’ as state variables. The AUC value, sensitivity, and specificity of the maximum Youden index were recorded.
The DMRs were selected using the following criteria: AUC > 0.8, specificity > 90%, and sensitivity > 70%. 108 DMRs were selected, containing 568 differentially methylated CpGs (DMCs). Since there were many DMCs in DMRs, the DMCs were analysed for further selection. First, the β value in 710 normal tissues of TCGA were < 0.1, the β value in gastric cancer tissues were > 0.45, and the β value in white blood cells < 0.1. 60 DMCs were identified. LASSO regression was implemented in the R package ‘glmnet’ to further select these DMCs. β values of 164 NATs in GEO and 393 GCs in TCGA, used as independent variables and response variables, respectively, were input to the ‘cv.glmnet’ method with parameters alpha = 1 and family= binomial. LASSO regression was repeated 100 times and the frequencies of probes was counted with non-zero coefficients in the regressions. 30 DMCs were identified.
Then the 5 DMCs were selected based on the following criteria:
Δmeanβ>0.2;
DMCs should have higher or similar mean methylation level compared to other digestive cancers and higher mean methylation level compared to non-digestive cancers;
The mean β value of normal tissues of other cancers should be lower than 0.25;
The β value of the WBC should be below 0.1;
The sequence is suitable for designing primers and MGB probes.
Extraction of DNA
The tissue samples were formalin-fixed and paraffin-embedded (FFPE) samples. The genomic DNA (gDNA) was extracted using FFPE tissue DNA extraction kit (DP340, Tiangen Biotech, Beijing, China) according the manufacturer’s instructions.
To obtain healthy white blood cells, 8 ml of whole blood was collected in an anticoagulant tube and centrifuged at 2000 rpm for 10 min at room temperature to separate the plasma and buffy coat. Human leukocyte gDNA was isolated using nucleic acid extraction reagents developed by Wuhan Ammunition Life Technology, Ltd. (Wuhan, China; Cat. No. AA04).
For plasma samples, 5 ml of whole blood was centrifuged at 2000 rcf for 10 minutes. The plasma was transferred to new 15 ml centrifuge tubes and centrifuged again at 2000 rcf for 10 minutes. The supernatant was retained. cfDNA was extracted from 1.5 ~ 2 ml of plasma using a plasma cfDNA Extraction Kit (AA16, Wuhan Ammunition, Wuhan, China). If the volume is less than 2 ml, make up the difference with lysis-binding buffer. Briefly, 2 ml of plasma was added to a mixture of proteinase K, lysis-binding buffer, and magnetic bead suspension, and incubated for 30 minutes. The magnetic bead-bound DNA was washed once with rinsing buffer WB1 and twice with rinsing buffer WB2. Finally, the DNA was eluted with 50 μl of TE buffer.
The cfDNA was either immediately converted using bisulphite or stored at 4°C or −20°C overnight before conversion.
Bisulfite conversion and purification of nucleic acids
The DNA was chemically modified with sodium bisulphite to convert unmethylated cytosine into uracil, while the methylated cytosine remained unchanged.
The gDNA extracted from the tissue or white blood cells was then converted using the DNA Conversion Kit (AA13, Wuhan Ammunition, Wuhan, China). Briefly, the DNA was incubated with sodium bisulphite buffer at 98°C for 10 minutes and at 64°C for 60 minutes in a PCR machine. The bisulphite-treated DNA was added to the binding buffer and the magnetic bead suspension and incubated for 15 minutes. The DNA was washed once at room temperature and desulfurized for 15 minutes. After that, it was washed twice and eluted using 50 μl TE buffer.
The cfDNA was converted using a Plasma cfDNA Conversion Kit (AA20, Wuhan Ammunition, Wuhan, China). The procedure was similar to that of AA13, with the exception of the addition of a protective reagent to the sodium bisulphite buffer. In the validation of plasma samples, an eluting volume of 80 μl of TE buffer was used for a quarter sample volume validation, while a volume of 50 μl was used for a normal sample volume validation.
The bisulphite-converted gDNA was named bisgDNA, and could be stored at −20°C, whereas the bisulphite-converted cfDNA was named biscfDNA and was promptly used for real-time PCR analysis.
Cell lines and plasmids
The MKN45 and HCT-116 cell lines were obtained from the China Center for Type Culture Collection (CCTCC). The cells were cultured in DMEM (11960044, Thermo Fisher, MA, USA) supplemented with 10% foetal bovine serum (12484010, Thermo Fisher, MA, USA).
pUC57 plasmids were constructed with bisulphite-converted methylated sequence (Bs-M) and bisulphite-converted unmethylated sequence (Bs-UM) of differentially methylated regions (DMRs) of IRF4–1, IRF4–2, ZEB2, ITGA4, DNAJC6, and ACTB genes, respectively (Wuhan GeneCreate Biological Engineering. Wuhan, China). Plasmids were prepared with serial dilution to obtain 10, 102, 103, and 104 copies/μl.
Real-time methylation specific PCR and the data analysis
Before conducting MSP analysis on clinical samples, the methylation-specific primers and probes were verified in two ways. Firstly, the amplification efficiency of the primers was tested using standard curves made from 10, 102, 103, and 104 copies/μl of Bs-M plasmids and it should be between 90.0% and 110.0% (Figure S1). Secondly, the primers and probes were tested to ensure they only amplify the methylated templates (HCT116 cells) and not the unmethylated templates (healthy white blood cells). The primer and probe sequences can be found in supplemental Table S2. The ACTB primers and probes were the same as described previously [Citation41].
For MSP detection of bisgDNA, 5 μl of template DNA was added to a 20 μl PCR reaction solution, resulting in a total volume of 25 μl for each reaction. For MSP detection of biscfDNA, 20 μl of template DNA was added to a 15 μl PCR reaction solution for plasma validation of a quarter sample volume, while 40 μl of template DNA was added to a 10 μl PCR reaction solution for plasma validation of a normal sample volume. For a quarter sample volume experiment, there were four MSP reactions for one sample; for a normal sample volume experiment, there was one MSP reaction for one sample. The PCR reaction solution consisted of 20*HA buffer (Wuhan Ammunition Life-tech, Wuhan), dNTP Mixture (Takara, Takara Biomedical Technology), and TaKaRa EpiTaqTM HS (Takara, Takara Biomedical Technology). A non-template control was used as a negative control, while a methylated cell line (either MKN45 or HCT116) was used as a positive control. Both controls were detected simultaneously on each plate. PCR was performed on ABI 7500 systems using the following cycling conditions: 95°C for 10 minutes, followed by 95°C for 15 seconds and 60°C for 30 seconds for 45 cycles (for bisgDNA) and 50 cycles (for bisgDNA or biscfDNA). The result was considered valid and used for analysis when the ACTB Ct value ≤ 35.
The methylation level of the biomarkers in the MSP result analysis was evaluated using 2−ΔΔCt value and Ct value. If the target was not amplified, the Ct value was set as the cycle number for statistical analysis. The equation used to calculate 2−ΔΔCt value is: ΔΔCt = (Cttarget gene - Ctinternal reference) sample–(Cttarget gene - Ctinternal reference) positive control. The internal reference used is ACTB.
ROC analysis was conducted, and the Youden index was calculated. Generally, the sensitivity, specificity, and cut-off corresponding to the maximum Youden index were obtained. Marker combination analysis was performed using logistic regression based on 2−ΔΔCt values and Ct values. Additionally, the 1/n algorithm was utilized in Ct value-based analysis. The 1/n algorithm is as follows: First, determine the positive or negative results of samples for individual markers using their respective cut-off values. A positive result was determined when the Ct value of the marker was lower than its corresponding cut-off. Next, determine the positive or negative measurement of samples for marker combinations using the criteria that if at least one biomarker result is positive, the assay result is determined to be positive. If all biomarker results are negative, the assay is negative.
When the cut-off is set, the equations for sensitivity and specificity are as follows:
Bioinformatics and statistic analysis
Statistical analyses were conducted using R version 3.6.1 or SPSS. GraphPad Prism 8 was utilized for the preparation of figures. The comparison of two data groups was performed using the Mann-Whitney test, also named Wilcoxon Rank Sum test. Statistical significance was considered at p < 0.05.
Results
Identification of biomarkers
The GC data from TCGA and GEO databases were analysed to identify DMRs and then DMCs.The method and criteria used to select the DMRs and DMCs are described in the method section. After this selection, 30 DMCs were chosen, belonging to 22 differentially methylated genes (DMGs) (refer to Table S3). Then 5 DMCs were further selected (refer to the method section).
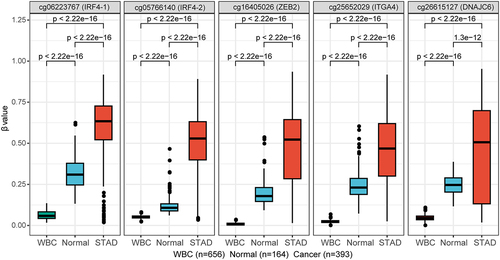
The five DMCs are cg05766140, cg06223767, cg25652029, cg26615127, and cg16405026. The first two DMCs are located in IRF4, cg05766140 locates in the upstream and the first exon; cg06223767 locates in the second intron. cg25652029 locates in about ~ 300 nt upstream of ITGA4 gene. cg26615127 locates in the first intron of DNAJC6 gene. cg16405026 locates in about ~ 3500 nt upstream of ZEB2 gene, in the long intergenic non-protein coding RNA 2993, which is named LINC02993. DNA methylation levels (β values) of the five DMCs in healthy WBC from GEO dataset, normal gastric tissues from GEO datasets and gastric cancer tissues from TCGA dataset of STAD are shown in .
Figure 2. DNA methylation levels (β values) of the five DMCs in healthy WBC, normal gastric tissues from GEO datasets and gastric cancer tissues from TCGA dataset of STAD. The abscissa is the type of sample, and the ordinate is the methylation level (β value). The extremes of the boxes define the upper and lower quartiles, and the centre lines define the median. Statistical analysis between the two groups was performed using Wilcoxon rank sum test, with p < 0.05 indicating significance.
Validation and selection of markers in tissues
Specific primers and probes for the methylated DNA region of biomarkers were designed and validated as described in the methods section. The marker corresponding to cg06223767 was named IRF4–1, and the marker corresponding to cg05766140 was named IRF4–2. The remaining three markers were named after their respective genes.
The biomarkers IRF4–1, IRF4–2, ZEB2, ITGA4 and DNAJC6 were validated in 40 gastric tissue specimens and 36 healthy white blood cell samples. The sample information is summarized in Table S1. Positive results were found in a certain proportion of normal adjacent gastric tissues based on preliminary data, which showed a similar trend to the results of the database (). Therefore, we did not include them as controls. Previous data suggests that white blood cells can serve as a good negative control [Citation42].
All five markers exhibit high methylation levels, as demonstrated by 2−ΔΔCt and Ct values in gastric tissues (). In healthy white blood cells, IRF4–1, IRF4–2, ZEB2, and ITGA4 showed almost no amplification, while approximately half of the white blood cells exhibited intermediate levels of DNAJC6 methylation. Low Ct values indicate good amplification and high methylation, while high Ct values indicate poor amplification and low methylation. A Ct value equal to 45 or 50 indicates no amplification of the target.
Figure 3. The methylation levels of five markers were analysed in the white blood cells of healthy individuals and gastric cancer tissues using 2−ΔΔCt values or ct values. The sample size for WBC was n = 36, and for GC it was n = 40. The upper picture displays the methylation levels based on 2−ΔΔCt values, while the lower picture shows the methylation levels based on ct values. Statistical analysis between the two groups was performed using Mann-Whitney test, with p < 0.05 indicating significance.
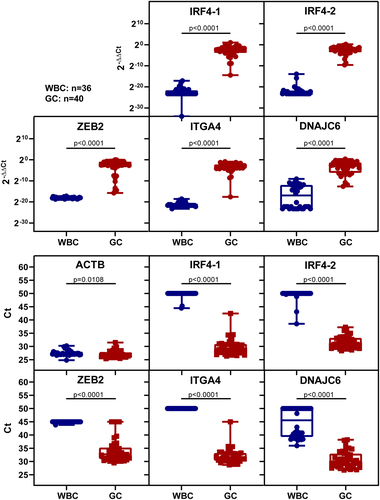
The sensitivity and specificity were calculated using a cut-off set as the maximum 2−ΔΔCt value of samples without amplification curves. All six biomarkers had detection rates higher than 90%, with IRF4–1 and IRF4–2 being the best at 100% (). IRF4–1, IRF4–2, ZEB2 and ITGA4 had high specificity in white blood cells, all above 90%, while DNAJC6 had low specificity of 47.2% ().
Table 2. The detection rates of markers in healthy white blood cells and gastric cancer tissues.
Based on the results, IRF4–1, IRF4–2, ZEB2 and ITGA4 demonstrated high sensitivity in detecting GC tissue and specificity in healthy WBC. These markers were chosen for plasma validation and selection.
Validation and selection of markers in a quarter sample volume of plasma
To evaluate all four markers simultaneously for the same patient, and due to the limited amount of plasma obtained from each patient, we conducted a validation using only 1/4 of the sample amount of plasma firstly. This was achieved by using 80 μl of buffer to elute the bisulphite-converted DNA, and 20 μl of the eluted DNA was used as a template in each MSP reaction (refer to the method section).
IRF4–1, IRF4–2, ZEB2 and ITGA4 were validated and selected in plasma samples from 36 gastric cancer patients, 55 non-gastric cancer individuals, including 43 healthy individuals, and 12 patients with benign gastric diseases (patient and tumour characteristics refer to ).
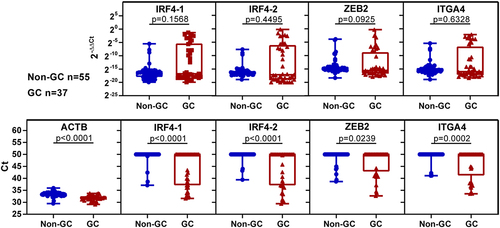
To analyse the results, we used 2−ΔΔCt values and Ct values. Based on the 2−ΔΔCt value analysis, the four markers had higher values than those in the non-GC group, though without statistical significance (, upper layer). In the Ct value analysis, there were significantly more samples showing amplification of the four markers in the GC group than in the healthy group, with all markers showing statistical significance between the two groups (, lower layer).
Figure 4. The methylation levels of selected markers in a quarter sample volume of plasma were analysed using 2−ΔΔCt values or Ct values. The study included healthy individuals, those with benign gastric disease, and those with GC. The upper picture displays the methylation levels based on 2−ΔΔCt values, while the lower picture shows the methylation levels based on Ct values. Statistical analysis between two groups was performed using Mann Whitney-test, and p < 0.05 was considered significant.
In , the AUC based on Ct values was higher than that based on 2−ΔΔCt values. The analysis of results based on Ct values revealed similar results for the marker combination analysis by logistic regression and 1/n algorithm method. Among the four markers, IRF4–1 and IRF4–2 exhibited the best AUC based on Ct values. The combination of IRF4–1 and IRF4–2 outperformed any single marker. The combinations of IRF4–1 + IRF4–2 + ITGA4, IRF4–1 + IRF4–2 + ZEB2, IRF4–1+ IRF4–2 + ZEB2 + ITGA4 demonstrated good performance, achieving sensitivities of 64.9%, 62.2%, and 67.6%, respectively, at specificities of 87.3%, 87.3%, and 85.4%, respectively. Our goal was to choose the marker combination that provided the best performance-to-cost ratio. Therefore, when faced with similar performance, we took into account both cost and operational convenience. As a result, we consider three-marker combination was superior to the four-marker combination. Consequently, we did not consider IRF4–1 + IRF4–2 + ZEB2 + ITGA4 any further. Validation results showed that the detection ability were decreased when IRF4–1, IRF4–2 and ITGA4 were used in one reaction compared to when they were used in separate reactions in MSP, indicating that the primers or MGB probes of IRF4 and ITGA4 might interact with each other, and the DNA regions were hard to design compatible primers and MGB probes. However, no such interaction was observed in IRF4–1 + IRF4–2 + ZEB2. Therefore, IRF4–1 + IRF4–2 + ZEB2 was selected. Since IRF4–1 and IRF4–2 belong to the same gene, they were combined into one channel of fluorescence signal, while ZEB2 was assigned to another channel.
Table 3. The diagnostic performance of markers was evaluated using a quarter sample volume of plasma samples analysed based on 2−∆∆Ct values or Ct values.
A normal sample volume of plasma pilot evaluation
The assay, using IRF4-(1&2) and ZEB2, was evaluated in the pilot plasma validation. The panel was evaluated using 35 gastric cancer, 39 control disease (mainly orthopaedic disorders), and 40 healthy plasma samples (patient and tumour characteristics refer to ).
The analysis of the results was based on 2−ΔΔCt values and Ct values (see ). Methylation levels were higher in the GC group than in the other two groups. The ROC analysis and marker combination analyses were conducted as described in the a quarter sample volume experiment, and the ROC curves are shown in and results are summarized in . The different methods showed similar AUC, sensitivity, and specificity. The method based on Ct values was adopted because it was easier for the operator, doctors, and subjects to understand. The 1/n algorithm method, which had similar advantages, was also adopted. The panel achieved 74.3% sensitivity for the GC group at any stage and 92.4% specificity.
Figure 5. The methylation levels of selected markers in plasma samples and ROC curves. (a) displays the methylation levels based on 2−ΔΔCt values, while (b) displays the methylation levels based on ct values. CD represents control disease and GC represents gastric cancer. Statistical analysis between two groups was performed using Mann-Whitney test, and p < 0.05 was considered significant. (c) are ROC curves of single marker and marker combination based on 2−ΔΔCt values (left) and ct values (right). Combination represents IRF4-(1&2) and ZEB2.
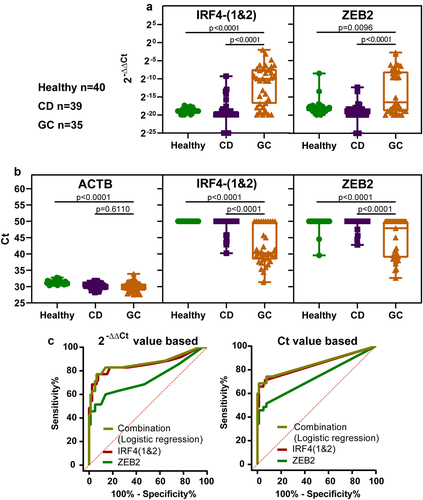
Table 4. The diagnostic performance of markers in plasma validation analysed based on 2−∆∆Ct or ct values.
We analysed the differences in methylation levels between different groups based on age and disease status for both the database and experimental validation samples. As we did not find any datasets of normal gastric tissues with age at the same time in the database, we only analysed the TCGA STAD dataset. The results showed only a significant difference between the age groups [Citation45–60] and (≥60) for the DMC of IRF4–1 (p = 0.021; see Figure S2). There was no significant difference between the other age groups for the DMC of IRF4–1 and all age groups for the other two DMCs. The experimental validation samples did not show any significant differences between cancer groups of different ages. However, the methylation levels in the cancer group were significantly higher than those in at least one control group for age groups [Citation45–60] and (≥60), as shown in Figure S3. This indicates that the methylation of markers is specific to cancer.
Discussion
Developing an MSP-based test for detecting cancer-specific ctDNA in plasma is challenging due to the limited amount of ctDNA and the presence of cfDNA from other tissues. To address these challenges, proper strategies should be employed, such as using appropriate data criteria and bioinformatic methods to select good biomarkers. Additionally, primers with excellent efficiency and specificity for methylated sequences should be used, including two DMRs for one gene [Citation40] or two DMRs from sense or anti-sense strands [Citation43]. Effective sample treatment technology should be utilized to ensure high recovery rates and purity of the bisulphite-converted nucleic acids. The study employed these strategies.
During the tissue validation phase, NATs were not used as controls because they were not considered suitable controls. Methylated DNA biomarkers often have certain detection rates in NATs. This is due to the difficulty in obtaining clean NAT samples and the possibility of molecular changes in methylation occurring earlier than morphological changes [Citation44]. In order to develop a plasma cfDNA marker, it is important to ensure that the biomarkers used for blood diagnosis are not interfered with by white blood cells, as part of the cfDNA in blood originates from white blood cells and other tissues [Citation45]. Therefore, healthy white blood cells were used as controls in tissue validation for this study. They were also used as controls in other studies [Citation42,Citation46,Citation47].
The volume of plasma used can directly affect the sensitivity of the markers and is correlated with the methods used. Studies have used volumes ranging from 200 to 2000 μl of plasma. For plasma volumes ranging from 200 to 500 μl, the methods primarily used were MSP-based, detecting both methylated and unmethylated products simultaneously and visualized by gel electrophoresis [Citation35,Citation38,Citation48]. However, this method was not easily applied in clinical settings due to its complex results-determination procedure. The real-time MSP method, based solely on detecting methylated products, requires a larger volume of 800 μl [Citation36] or 2000 μl [Citation49]. In this study, we used two types of plasma volumes: one was approximately 375–500 μl, which corresponds to 1/4 of the sample amount, and the other was approximately 1500–2000 μl, which corresponds to the normal sample volume. The results indicate a 10–20% increase in sensitivity, with no significant impact on specificity. For instance, IRF4–1 and IRF4–2 exhibited a sensitivity of 59.5% at specificity of 90.9% in the 1/4 plasma amount experiment, and a sensitivity of 71.4% at specificity of 93.7% in the normal plasma amount experiment, based on the analysis of the Ct value and the 1/n algorithm. These findings are consistent with our previous unpublished data.
Numerous studies have been conducted on the use of DMRs for cancer diagnosis. The methylation index, evaluated with MSP, has been the most frequently used method to assess the methylation level. There are several methods for calculating methylation levels, including MI = ΔCt [Citation50], MI = 2−ΔCt [Citation51], MI = 10,000 × 2ΔCt where ΔCt = Cttarget gene - Ctinternal reference [Citation52], MI = 2−ΔΔCt where ΔΔCt = ΔCtsample - ΔCtcalibrator [Citation51], MI = Cttarget gene/Ctinternal reference [Citation52], and MI = Ct [Citation26,Citation41,Citation53]. Regarding the use of Ct as an MI index, the lower the Ct value is, the higher the methylation level is, and the endogenous reference such as ACTB used in this study should be valid, indicating that the sample treatment was effective. Previous studies have shown that Ct-based diagnosis is superior to 2−ΔΔCt-based diagnosis [Citation41]. In this study, Ct-based diagnosis was found to be better than 2−ΔΔCt-based diagnosis in a quarter sample volume experiments (see ). However, the two methods produced similar results in the normal amount experiment (see ). Additionally, the Ct-based method was easy to understand and apply clinically, making it the preferred method for this study.
The panel of this study achieved a sensitivity of 74.3% for GC at 92.4% specificity. Most plasma samples were only 1.5 ml, but obtaining a 2 ml volume would improve performance. The 3-marker panel (ELMO1, ZNF569, C13orf18) published by Exact Sciences and Mayo Clinic achieved 86% sensitivity for GC at 95% specificity [Citation49]. A review paper summarized the data on methylated DNA as biomarkers for detecting GC [Citation27]. In one study, RNF180 had a detection rate of 56% (18 out of 32) for gastric cancer and a specificity of 100% (64 out of 64) for normal samples in plasma [Citation36]. Reprimo (also known as RPRM) showed a sensitivity of 95.3% (41 out of 43) for gastric cancer and a specificity of 90.3% (28 out of 31) for normal samples in plasma validation [Citation35]. A study found that ZIC1 had a sensitivity of 69.5% and a specificity of 69.2%; HOXD10 had a sensitivity of 48.1% and a specificity of 80.0%; and RUNX3 had a sensitivity of 42.7% and a specificity of 79.2% in 131 GC and 34 normal plasma samples. The combination of the three markers had a sensitivity of 91.5% and a specificity of 50.0% [Citation48]. Our panel’s performance ranks in the top third in overall marker performance.
The panel detects DNA methylation using the MSP method, which enables efficient cancer detection compared to endoscopy. One lab technician can handle multiple samples at once. Plasma sample type are a highly acceptable sample type due to its high participation rate and collection convenience. The panel’s sensitivity is 74.3%, which is not excellent, however, compared with the other current detection methods, such as CEA, CA 19–9 and CA72–4, which have positive rates of 21.1%, 27.8% and 30.3%, respectively [Citation18]; Serum pepsinogen levels, which have sensitivity and specificity of 69% (95% CI: 60%-76%) and 73% (95% CI: 62%-82%) for GC detection [Citation22], this panel has better performance. One potential limitation of this panel is that the biomarkers it includes are also hypermethylated in colorectal and oesophageal cancers, although to a lesser extent in oesophageal cancer than in gastric cancer. Therefore, physicians and subjects with positive results should also be aware of the potential for these other types of cancer.
The selected biomarker IRF4 belongs to interferon regulatory factors (IRFs), a family of transcriptional regulators defined by a characteristic homology in their DNA-binding domain [Citation54]. They play a crucial role in regulating various genes (such as IFNs, interleukins, MHC class I/II), as well as apoptosis and differentiation/maturation [Citation55,Citation56]. It was also reported that IRF4 was correlated with cancer, it was hypermethylated in gastric cancer cell lines and in primary gastric cancer tissues [Citation57]. The combination of methylated IRF4, ELMO1, CLIP4 and MSC has been identified as biomarkers for detecting gastric cancer in endoscopic biopsies [Citation54]. Methylated IRF4, in combination with IKZF1 and BCAT1, has been reported as blood-based biomarkers for detecting colorectal cancer [Citation58].
The other selected ZEB2 gene, also known as SIP1, coding for a member of the Zfh-1 family of two-handed zinc finger/homeodomain proteins [Citation59]. It functions as a DNA-binding transcriptional repressor that interacts with activated SMADs. ZEB2 has several biological functions, including inhibiting transcription by binding to DNA in different promoters [Citation60,Citation61], inhibiting E-cadherin transcription, and regulating Mesenchyme Homeobox 2 (MEOX2) expression. ZEB2 is expressed differentially in tumours and can regulate tumour cell growth [Citation62]. The DMC selected is actually located in the long intergenic non-protein coding RNA 2993 (LINC02993), which is about ~ 3500 nt upstream of the ZEB2 gene. Its relation to the ZEB2 gene is not known.
There were limitations in this study. The panel’s performance should be validated in a larger sample size, including atrophic gastritis, benign gastric disease and other cancers as control groups. The early GC samples included in this study were relatively small, with only six cases in stage I (). The overall detection rate for ‘a quarter sample volume’ assay and ‘normal sample volume’ assay was only 33.33% (2/6). Based on the current data, the early sensitivity of the assay is unsatisfactory, and further validation is needed with a larger number of early cancer samples. Additionally, the panel should be compared to other existing biomarkers or tests for GC. These are the future directions of our study.
In conclusion, 30 DMCs were selected for detecting GC from TCGA and the GEO databases, 5 were further selected for biological validation. Primers and probes based on the DMCs’ surrounding region were designed and validated. The 5 markers were then validated and further selected in tissues and in a quarter sample volume of plasma. Among them, IRF4–1, IRF4–2, and ZEB2 were selected. Subsequently, the diagnostic performance of the panel [IRF4-(1&2) and ZEB2] was validated in normal sample volume of plasma for detecting gastric cancer. The panel demonstrated good performance in detecting GC and has good potential for clinical application.
Authors’contributions
YTZ designed the study and wrote the manuscript; CXB collected clinical samples. CXB and ZLW performed research and data analysis. All authors read and approved the final manuscript.
Ethics approval and consent to participate
This study was approved by the Ethics Committee of the First Affiliated Hospital of Zhengzhou University (2022-KY-0631-002). The collection of human samples and clinical data was in line with the principles of the Helsinki Declaration. Each participant signed the informed consent form for the use of their tissues and blood samples.
Supplementary tables.xlsx
Download MS Excel (14.9 KB)Supplementary figures_revised.docx
Download MS Word (462.2 KB)Acknowledgments
We express our gratitude to all the participants who took part in our study. We appreciate Dihan Zhou and Yan Zhang from Wuhan Ammunition Life-tech Company, Ltd. for their technical support.
Disclosure statement
No potential conflict of interest was reported by the author(s).
Data availability statement
The datasets used and/or analysed during the current study are available from the corresponding author upon reasonable request.
Supplementary material
Supplemental data for this article can be accessed online at https://doi.org/10.1080/15592294.2024.2374988
Additional information
Funding
References
- Sung H, Ferlay J, Siegel RL, et al. Global cancer statistics 2020: GLOBOCAN estimates of incidence and mortality worldwide for 36 cancers in 185 countries. CA Cancer J Clin. 2021;71(3):209–17. doi: 10.3322/caac.21660 PMID: 33538338.
- Xia C, Dong X, Li H, et al. Cancer statistics in China and United States, 2022: profiles, trends, and determinants. Chin Med J (Engl). 2022;135(5):584–590. doi: 10.1097/CM9.0000000000002108 PMID: 35143424; PMCID: PMC8920425.
- Eusebi LH, Telese A, Marasco G, et al. Gastric cancer prevention strategies: a global perspective. J Gastroenterol Hepatol. 2020;35(9):1495–1502. doi: 10.1111/jgh.15037 PMID: 32181516.
- Chen W, Zheng R, Baade PD, et al. Cancer statistics in China, 2015. CA Cancer J Clin. 2016;66(2):115–132. doi: 10.3322/caac.21338 PMID: 26808342.
- Bonelli P, Borrelli A, Tuccillo FM, et al. Precision medicine in gastric cancer. World J Gastrointest Oncol. 2019;11(10):804–829. doi: 10.4251/wjgo.v11.i10.804 PMID: 31662821; PMCID: PMC6815928.
- Xia JY, Aadam AA. Advances in screening and detection of gastric cancer. J Surg Oncol. 2022;125(7):1104–1109. doi: 10.1002/jso.26844 PMID: 35481909; PMCID: PMC9322671.
- SEER cancer stat facts: stomach cancer. National cancer institute. 2013-2019 [cited 2023]. Available from: https://seer.cancer.gov/statfacts/html/stomach.html
- Tanabe S, Ishido K, Matsumoto T, et al. Long-term outcomes of endoscopic submucosal dissection for early gastric cancer: a multicenter collaborative study. Gastric Cancer. 2017;20(Suppl 1):45–52. doi: 10.1007/s10120-016-0664-7 PMID: 27807641.
- Nashimoto A, Akazawa K, Isobe Y, et al. Gastric cancer treated in 2002 in Japan: 2009 annual report of the JGCA nationwide registry. Gastric Cancer. 2013;16(1):1–27. doi: 10.1007/s10120-012-0163-4 PMID: 22729699; PMCID: PMC3549249.
- Khanderia E, Markar SR, Acharya A, et al. The influence of gastric cancer screening on the stage at diagnosis and survival: a meta-analysis of comparative studies in the far east. J Clin Gastroenterol. 2016;50(3):190–197. doi: 10.1097/MCG.0000000000000466 PMID: 26844858.
- Yang K, Lu L, Liu H, et al. A comprehensive update on early gastric cancer: defining terms, etiology, and alarming risk factors. Expert Rev Gastroenterol Hepatol. 2021;15(3):255–273. doi: 10.1080/17474124.2021.1845140 PMID: 33121300.
- Hamashima C, Narisawa R, Ogoshi K, et al. Optimal interval of endoscopic screening based on stage distributions of detected gastric cancers. BMC Cancer. 2017;17(1):740. doi: 10.1186/s12885-017-3710-x PMID: 29121881; PMCID: PMC5680820.
- de Martel C, Ferlay J, Franceschi S, et al. Global burden of cancers attributable to infections in 2008: a review and synthetic analysis. Lancet Oncol. 2012;13(6):607–615. doi: 10.1016/S1470-2045(12)70137-7 PMID: 22575588.
- Gonzalez CA, Megraud F, Buissonniere A, et al. Helicobacter pylori infection assessed by ELISA and by immunoblot and noncardia gastric cancer risk in a prospective study: the eurgast-EPIC project. Ann Oncol. 2012;23(5):1320–1324. doi: 10.1093/annonc/mdr384 PMID: 21917738.
- Akiba S, Koriyama C, Herrera-Goepfert R, et al. Epstein-Barr virus associated gastric carcinoma: epidemiological and clinicopathological features. Cancer Sci. 2008;99(2):195–201. doi: 10.1111/j.1349-7006.2007.00674.x PMID: 18271915.
- Howson CP, Hiyama T, Wynder EL. The decline in gastric cancer: epidemiology of an unplanned triumph. Epidemiol Rev. 1986;8(1):1–27. doi: 10.1093/oxfordjournals.epirev.a036288 PMID: 3533579.
- Coggon D, Barker DJ, Cole RB, et al. Stomach cancer and food storage. J Natl Cancer Inst. 1989;81(15):1178–1182. doi: 10.1093/jnci/81.15.1178 PMID: 2746670.
- Shimada H, Noie T, Ohashi M, et al. Clinical significance of serum tumor markers for gastric cancer: a systematic review of literature by the task force of the Japanese gastric cancer association. Gastric Cancer. 2014;17(1):26–33. doi: 10.1007/s10120-013-0259-5 PMID: 23572188.
- Hamashima C. Systematic Review G, Guideline Development Group for Gastric Cancer Screening G. Update version of the Japanese guidelines for gastric cancer screening. Jpn J Clin Oncol. 2018;48(7):673–683. doi: 10.1093/jjco/hyy077 PMID: 29889263.
- Yamaguchi Y, Nagata Y, Hiratsuka R, et al. Gastric cancer screening by combined assay for serum anti-Helicobacter pylori IgG antibody and serum pepsinogen levels–the ABC method. Digestion. 2016;93(1):13–18. doi: 10.1159/000441742 PMID: 26789514.
- Mizuno S, Kobayashi M, Tomita S, et al. Validation of the pepsinogen test method for gastric cancer screening using a follow-up study. Gastric Cancer. 2009;12(3):158–163. doi: 10.1007/s10120-009-0522-y PMID: 19890696.
- Huang YK, Yu JC, Kang WM, et al. Significance of serum pepsinogens as a biomarker for gastric cancer and atrophic gastritis screening: a systematic review and meta-analysis. PLOS ONE. 2015;10(11):e0142080. doi: 10.1371/journal.pone.0142080 PMID: 26556485; PMCID: PMC4640555.
- Necula L, Matei L, Dragu D, et al. Recent advances in gastric cancer early diagnosis. World J Gastroenterol. 2019;25(17):2029–2044. doi: 10.3748/wjg.v25.i17.2029 PMID: 31114131; PMCID: PMC6506585.
- Baylin SB, Jones PA. Epigenetic determinants of cancer. Cold Spring Harb Perspect Biol. 2016;8(9). doi: 10.1101/cshperspect.a019505 PMID: 27194046; PMCID: PMC5008069.
- Imperiale TF, Ransohoff DF, Itzkowitz SH, et al. Multitarget stool DNA testing for colorectal-cancer screening. N Engl J Med. 2014;370(14):1287–1297. doi: 10.1056/NEJMoa1311194 PMID: 24645800.
- Wang Z, Shang J, Zhang G, et al. Evaluating the clinical performance of a dual-target stool DNA test for colorectal cancer detection. J Mol Diagn. 2022;24(2):131–143. doi: 10.1016/j.jmoldx.2021.10.012 PMID: 34890778.
- Huang ZB, Zhang HT, Yu B, et al. Cell‑free DNA as a liquid biopsy for early detection of gastric cancer (review). Oncol Lett. 2021;21(1):1–1. doi: 10.3892/ol.2020.12264 PMID: 33240409; PMCID: PMC7681206.
- Li J, Xu M, Peng J, et al. Novel technologies in cfDNA analysis and potential utility in clinic. Chin J Cancer Res. 2021;33(6):708–718. doi: 10.21147/j.issn.1000-9604.2021.06.07 PMID: 35125814; PMCID: PMC8742177.
- Lin C, Liu X, Zheng B, et al. Liquid biopsy, ctDNA diagnosis through NGS. Life (Basel). 2021;11(9). doi: 10.3390/life11090890 PMID: 34575039; PMCID: PMC8468354.
- Bettegowda C, Sausen M, Leary RJ, et al. Detection of circulating tumor DNA in early- and late-stage human malignancies. Sci Transl Med. 2014;6(224):224ra24. doi: 10.1126/scitranslmed.3007094 PMID: 24553385; PMCID: PMC4017867.
- Newman AM, Bratman SV, To J, et al. An ultrasensitive method for quantitating circulating tumor DNA with broad patient coverage. Nat Med. 2014;20(5):548–554. doi: 10.1038/nm.3519 PMID: 24705333; PMCID: PMC4016134.
- Haber DA, Velculescu VE. Blood-based analyses of cancer: circulating tumor cells and circulating tumor DNA. Cancer Discov. 2014;4(6):650–661. doi: 10.1158/2159-8290.CD-13-1014 PMID: 24801577; PMCID: PMC4433544.
- Board RE, Knight L, Greystoke A, et al. DNA methylation in circulating tumour DNA as a biomarker for cancer. Biomark Insights. 2008;2:307–319. PMID: 965 19662228; PMCID: PMC2717819. doi: 10.1177/117727190700200003
- Lu Y XX, Ying JL, Han LS, et al. Stepwise cumulation of RUNX3 methylation mediated by Helicobacter pylori infection contributes to gastric carcinoma progression. Cancer. 2012;118(22):5507–5517. doi: 10.1002/cncr.27604, PMID: 22576578.
- Bernal C, Aguayo F, Villarroel C, et al. Reprimo as a potential biomarker for early detection in gastric cancer. Clin Cancer Res. 2008;14(19):6264–6269. doi: 10.1158/1078-0432.CCR-07-4522 PMID: 18829507.
- Cheung KF, Lam CN, Wu K, et al. Characterization of the gene structure, functional significance, and clinical application of RNF180, a novel gene in gastric cancer. Cancer. 2012;118(4):947–959. doi: 10.1002/cncr.26189 PMID: 21717426.
- Wang G, Zhang W, Zhou B, et al. The diagnosis value of promoter methylation of UCHL1 in the serum for progression of gastric cancer. Biomed Res Int. 2015;2015:1–8. doi: 10.1155/2015/741030 PMID: 26550574; PMCID: PMC4624918.
- Pimson C, Ekalaksananan T, Pientong C, et al. Aberrant methylation of PCDH10 and RASSF1A genes in blood samples for non-invasive diagnosis and prognostic assessment of gastric cancer. PeerJ. 2016;4:e2112. doi: 10.7717/peerj.2112 PMID: 27330867; PMCID: PMC4906662.
- Zheng Y, Chen L, Li J, et al. Hypermethylated DNA as potential biomarkers for gastric cancer diagnosis. Clin Biochem. 2011;44(17–18):1405–1411. doi: 10.1016/j.clinbiochem.2011.09.006 PMID: 21945024.
- Li R, Qu B, Wan K, et al. Identification of two methylated fragments of an SDC2 CpG island using a sliding window technique for early detection of colorectal cancer. FEBS Open Bio. 2021;11(7):1941–1952. doi: 10.1002/2211-5463.13180 PMID: 33955718; PMCID: PMC8255834.
- Zhang L, Dong L, Lu C, et al. Methylation of SDC2/TFPI2 and its diagnostic value in colorectal tumorous lesions. Front Mol Biosci. 2021;8:706754. doi: 10.3389/fmolb.2021.706754 PMID: 35004840; PMCID: PMC8729808.
- Bian Y, Gao Y, Lu C, et al. Genome-wide methylation profiling identified methylated KCNA3 and OTOP2 as promising diagnostic markers for esophageal squamous cell carcinoma. Chin Med J (Engl). 2023. doi: 10.1097/CM9.0000000000002832 PMID: 37650127.
- Jensen SO, Ogaard N, Nielsen HJ, et al. Enhanced performance of DNA methylation markers by simultaneous measurement of sense and antisense DNA strands after cytosine conversion. Clin Chem. 2020;66(7):925–933. doi: 10.1093/clinchem/hvaa100 PMID: 32460325.
- Chen X, Gole J, Gore A, et al. Non-invasive early detection of cancer four years before conventional diagnosis using a blood test. Nat Commun. 2020;11(1):3475. doi: 10.1038/s41467-020-17316-z PMID: 32694610; PMCID: PMC7374162.
- Moss J, Magenheim J, Neiman D, et al. Comprehensive human cell-type methylation atlas reveals origins of circulating cell-free DNA in health and disease. Nat Commun. 2018;9(1):5068. doi: 10.1038/s41467-018-07466-6 PMID: 30498206; PMCID: PMC6265251.
- Zhao Y, Zhao L, Jin H, et al. Plasma methylated GNB4 and riplet as a novel dual-marker panel for the detection of hepatocellular carcinoma. Epigenetics. 2024;19(1):2299044. doi: 10.1080/15592294.2023.2299044 PMID: 38154055; PMCID: PMC10761049.
- Xu RH, Wei W, Krawczyk M, et al. Circulating tumour DNA methylation markers for diagnosis and prognosis of hepatocellular carcinoma. Nat Mater. 2017;16(11):1155–1161. doi: 10.1038/nmat4997 PMID: 29035356.
- Lin Z, Luo M, Chen X, et al. Combined detection of plasma ZIC1, HOXD10 and RUNX3 methylation is a promising strategy for early detection of gastric cancer and precancerous lesions. J Cancer. 2017;8(6):1038–1044. doi: 10.7150/jca.18169 PMID: 28529617; PMCID: PMC5436257.
- Anderson BW, Suh YS, Choi B, et al. Detection of gastric cancer with novel methylated DNA markers: discovery, tissue validation, and pilot testing in plasma. Clin Cancer Res. 2018;24(22):5724–5734. doi: 10.1158/1078-0432.CCR-17-3364 PMID: 29844130; PMCID: PMC6239895.
- Huang YK, Peng BY, Wu CY, et al. DNA methylation of PAX1 as a biomarker for oral squamous cell carcinoma. Clin Oral Investig. 2014;18(3):801–808. doi: 10.1007/s00784-013-1048-6 PMID: 23907469.
- Pfaffl MW. A new mathematical model for relative quantification in real-time RT-PCR. Nucleic Acids Res. 2001;29(9):e45. doi: 10.1093/nar/29.9.e45 PMID: 11328886; PMCID: PMC55695.
- Huang TH, Lai HC, Liu HW, et al. Quantitative analysis of methylation status of the PAX1 gene for detection of cervical cancer. Int J Gynecol Cancer. 2010;20(4):513–519. doi: 10.1111/IGC.0b013e3181c7fe6e PMID: 20442585.
- Zhang L, Yu J, Huang W, et al. A sensitive and simplified classifier of cervical lesions based on a methylation-specific PCR assay: a Chinese cohortstudy. Cancer Manag Res. 2020;12:2567–2576. doi: 10.2147/CMAR.S246103 PMID: 32346310; PMCID: PMC7167279.
- Pirini F, Noazin S, Jahuira-Arias MH, et al. Early detection of gastric cancer using global, genome-wide and IRF4, ELMO1, CLIP4 and MSC DNA methylation in endoscopic biopsies. Oncotarget. 2017;8(24):38501–38516. doi: 10.18632/oncotarget.16258 PMID: 28418867; PMCID: PMC5503549.
- Nguyen H, Hiscott J, Pitha PM. The growing family of interferon regulatory factors. Cytokine Growth Factor Rev. 1997;8(4):293–312. doi: 10.1016/s1359-6101(97)00019-1 PMID: 9620643.
- Tanaka N, Taniguchi T. The interferon regulatory factors and oncogenesis. Semin Cancer Biol. 2000;10(2):73–81. doi: 10.1006/scbi.2000.0310 PMID: 10936058.
- Yamashita M, Toyota M, Suzuki H, et al. DNA methylation of interferon regulatory factors in gastric cancer and noncancerous gastric mucosae. Cancer Sci. 2010;101(7):1708–1716. doi: 10.1111/j.1349-7006.2010.01581.x PMID: 20507321.
- Young GP, Symonds EL, Nielsen HJ, et al. Evaluation of a panel of tumor-specific differentially-methylated DNA regions in IRF4, IKZF1 and BCAT1 for blood-based detection of colorectal cancer. Clin Epigenetics. 2021;13(1):14. doi: 10.1186/s13148-020-00999-y PMID: 33478584; PMCID: PMC7818774.
- Scott CL, Omilusik KD. ZEBs: novel players in immune cell development and function. Trends Immunol. 2019;40(5):431–446. doi: 10.1016/j.it.2019.03.001 PMID: 30956067.
- Long J, Zuo D, Park M. Pc2-mediated sumoylation of smad-interacting protein 1 attenuates transcriptional repression of E-cadherin. J Biol Chem. 2005;280(42):35477–35489. doi: 10.1074/jbc.M504477200 PMID: 16061479.
- Chen Y, Banda M, Speyer CL, et al. Regulation of the expression and activity of the antiangiogenic homeobox gene GAX/MEOX2 by ZEB2 and microRNA-221. Mol Cell Biol. 2010;30(15):3902–3913. doi: 10.1128/MCB.01237-09 PMID: 20516212; PMCID: PMC2916411.
- Fardi M, Alivand M, Baradaran B, et al. The crucial role of ZEB2: from development to epithelial-to-mesenchymal transition and cancer complexity. J Cell Physiol. 2019;234(9):14783–14799. doi: 10.1002/jcp.28277 PMID: 30773635.