
ABSTRACT
In mammals, the molecular mechanisms underlying transgenerational inheritance of phenotypic traits in serial generations of progeny after ancestral environmental exposures, without variation in DNA sequence, remain elusive. We’ve recently described transmission of a beneficial trait in rats and mice, in which F0 supplementation of methyl donors, including folic acid, generates enhanced axon regeneration after sharp spinal cord injury in untreated F1 to F3 progeny linked to differential DNA methylation levels in spinal cord tissue. To test whether the transgenerational effect of folic acid is transmitted via the germline, we performed whole-genome methylation sequencing on sperm DNA from F0 mice treated with either folic acid or vehicle control, and their F1, F2, and F3 untreated progeny. Transgenerational differentially methylated regions (DMRs) are observed in each consecutive generation and distinguish folic acid from untreated lineages, predominate outside of CpG islands and in regions of the genome that regulate gene expression, including promoters, and overlap at both the differentially methylated position (DMP) and gene levels. These findings indicate that molecular changes between generations are caused by ancestral folate supplementation. In addition, 29,719 DMPs exhibit serial increases or decreases in DNA methylation levels in successive generations of untreated offspring, correlating with a serial increase in the phenotype across generations, consistent with a ‘wash-in’ effect. Sibship-specific DMPs annotate to genes that participate in axon- and synapse-related pathways.
Introduction
Ancestral environmental exposures influence the phenotypes of consecutive generations of unexposed offspring in the absence of corresponding DNA sequence variation. Transgenerational epigenetic inheritance refers to a hereditary trait present in progeny without the F0 environmental exposure that produced it. Because exposure in F0 males may also directly affect sperm derived from embryonic gonads (F1), transgenerational non-genomic inheritance in males is established only if the phenotype is observed in the F2 generation. Similarly, because a gestational exposure in F0 females may also directly affect the embryo (F1) and the gamete within the embryo (F2), female-transmitted transgenerational non-genomic inheritance is established only if the phenotype is observed in the F3 generation. Transgenerational non-genomic inheritance of detrimental traits is well-documented in mammals including impaired stress and anxiety responses [Citation1], infertility in males [Citation2], and decreased follicle pool sizes in females [Citation3] after ancestral exposure to pollutants and toxins [Citation4]. Transgenerational epigenetic inheritance of a beneficial trait in 2 mammalian genera has been reported using the experimental model of the present data [Citation5,Citation6].
Mechanisms by which non-genetic traits are transmitted from generation to generation have been proposed, especially those related to paternal transmission via sperm. For example, stress causes a reduced response of the hypothalamic-pituitary axis to stress, accompanied by altered sperm microRNA content [Citation7]. Furthermore, paternal exposure to chronic social defeat stress in mice leads to substantial alterations in sperm transcriptomes and RNA content in offspring [Citation8]. In humans, differential DNA methylation profiles in sperm have been observed between fathers of children with or without autism [Citation9].
We have shown that folic acid (FA) and other methyl donors enhance the ability of spinal neurons to regenerate axons after sharp injury, and that this effect is transmitted to at least 3 generations of unexposed progeny, in parallel with alterations in DNA methylation levels in spinal cord neurons [Citation5,Citation6]. Folate-induced transgenerational epigenetic inheritance supports axon regeneration of increasing magnitude in successive generations of spinal cord injured animals without intervening methyl donor supplementation. Enhanced axonal recovery is observed with an oral methyl-supplemented diet, intraperitoneal folic acid and methylfolate, in inbred and outbred animals, and in rats and mice. The combination of these controlled experiments, the van Elteren test, and a likelihood ratio test of pedigree showed that inheritance of the regeneration phenotype is inconsistent with a Mendelian genetic model [Citation10].
An epigenetic wash-out phenomenon refers to the gradual decline of a phenotype in consecutive generations following F0 exposure to an environmental intervention or stressor [Citation10]. Conversely, a wash-in phenomenon refers to gradual amplification of a phenotype in consecutive generations. To the present, molecular correlates to transgenerational non-genomic phenotypes that increase or decrease in magnitude over serial generations have not been reported.
Using whole genome methylation sequencing (WGMS) of sperm DNA obtained from F0 and F1-F3 progeny derived from ancestrally (F0) exposed (folic acid or vehicle) mice, we show that the molecular alterations previously observed in spinal cord tissue [Citation6] are transmitted via the germline. In addition, we identify specific DNA methylation changes that increase in magnitude in consecutive generations of progeny, in parallel with the observed wash-in phenotype [Citation6].
Methods
Mouse breeding
To establish a mouse lineage, 4–6 week-old ICR (CD-1®) outbred mice were obtained from the Harlan Laboratories Inc. (Madison, WI) and maintained on a CD-1 background for F1 to F3 generations as previously described [Citation6]. Mice were housed under uniform conditions in a pathogen-free mouse facility with a 12-h light/dark cycle. Food and water were available ad libitum. All experiments were approved by the University of Wisconsin-Madison Institutional Animal Care and Use Committee (Animal protocol number M005286). We’ve previously shown that the transgenerational effect of folate on axon regeneration is identical in inbred and outbred animals, and in mice and rats [Citation6]. Considering that powering the axon regeneration phenotype experiments requires a large number of animals (minimum of 8), as previously shown [Citation6,Citation11,Citation12], the present study uses outbred animals, which produce larger litters than inbred animals.
Mice (folic acid: 3 males and 3 females from each generation; vehicle (DDI): 3 males and 3 females from each generation) were bred in a non-sibling manner. In each succeeding generation (F1-F3), females were used only for breeding, whereas male animal sibs were used for either spinal axon regeneration phenotyping or sperm harvest. Males used for breeding were not used for phenotyping or sperm harvest. Breeding and folate treatment protocols were as previously described [Citation5,Citation6]. Only males were studied in view of the following: 1) in previous reports, no discernable or statistical differences in the inherited folate-driven axonal regeneration phenotype were observed between females and males [Citation6]; 2) females were conserved for further breeding; 3) the surgical phenotype required efficient use of resources; 4) while studying sperm requires all molecular and phenotypic analyses to be done in males, preliminary work on oocytes is underway and will be the subject of future publications.
Folic acid supplementation
Folic acid (FA) 80 μg/kg (APP Pharmaceuticals, Schaumberg, IL) or an equivalent volume of distilled de-ionized water (DDI) were injected intraperitoneally (IP) in F0 mice beginning 14 days before mating and continuing daily in males until the pups were born, and in females until the pups were weaned. A dose of 80 μg/kg was previously shown to optimally enhance spinal axon regeneration in rodents [Citation6,Citation11,Citation12]. Folic acid and DDI mouse lineages were generated by conducting non-sibling mating of offspring to create F1-F3 generations with no additional intervening FA or DDI supplementation. The duration of exposure (14 days) was previously shown to optimize the transgenerational transmission of the phenotype [Citation5,Citation6].
Phenotyping: mouse spinal cord regeneration model (SCRM)
Adult F2 and F3 mice (ages 22–32 weeks) underwent SCRM surgery as previously described [Citation6,Citation11,Citation12]. We’ve established that in this animal model, at least 8 to 10 animals per group are required for statistical significance [Citation5,Citation6,Citation11,Citation12]. Mice were anesthetized with a combination of IP ketamine (100 mg/ml at 90–12 0 mg/kg Clipper Distributing Company LLC, St. Joseph, MO) and Xylazine (100 mg/ml at 10 mg/kg Bimeda-MTC Animal Health Inc., Le Sueur, MN). Additional doses of ketamine (10–20 mg/kg) were administered as needed. A C3 laminectomy and dural opening exposed the cervical spinal cord and a sharp transection injury was made in both posterior columns with a jeweller’s forceps or 25 G needle under a surgical microscope. A sciatic nerve segment was then harvested from the left hindlimb, attached to the injury site and secured with 11–0 nylon sutures with its distal end lying freely under the skin. Pain was controlled with buprenorphine (0.05 to 0.1 mg/kg, SQ) intraoperatively with additional doses every 8 to 12 hours as needed. Two weeks later, the incision was reopened under anaesthesia as above, and a gelfoam (Johnson & Johnson Ethicon-SARL, Neuchatel, Switzerland) soaked in 5 µl of the retrograde tracer Fluoro-GoldTM (Fluorochrome, LLC, Denver, Co) was placed at the free end of the nerve graft. The fluorescent tracer is transmitted retrogradely through axons that have re-grown from the spinal cord into the graft to reach neuronal cell bodies in the dorsal root ganglia (DRG) ().
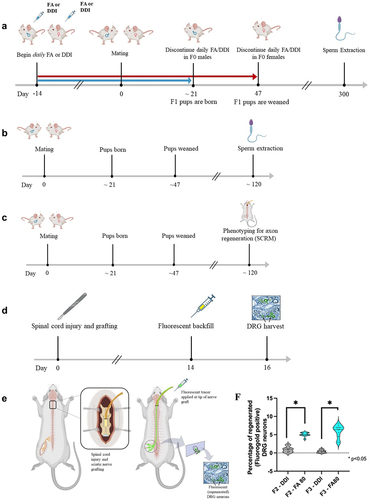
Figure 1. Breeding paradigm, axon regeneration phenotyping, and sperm DNA extraction. (a) timeline of the F0 breeding paradigm and sperm extraction. Male and female F0 animals were treated with daily injections of folic acid (FA) or DDI vehicle control starting two weeks before mating; the injections were discontinued 1) in the males when the F1 pups were born and 2) in the females when the pups were weaned. Sperm was extracted from the F0 animals after breeding, and DNA was extracted and used for whole-genome methylation sequencing (WGMS). (b) Timeline of the F1–F3 breeding paradigm and sperm harvest. Untreated F1, F2, and F3 animals were generated from the F0 lineage. Sperm was harvested from adult F1, F2, and F3 animals (n = 3), and DNA was extracted and used for WGMS. (c) Timeline for axon regeneration phenotyping (SCRM). (d, e) Details of SCRM in F2 and F3 male mice: Animals undergo bilateral C3 dorsal column transection and implantation of a sciatic nerve graft at the injury site. Two weeks later, a florescent tracer is applied to the free end of the graft (green arrow). The ends of the axons that have extended into the graft (i.e. regenerated) ipsilateral to sciatic nerve harvest take up the tracer, which is detected 48 h later in the corresponding lumbar DRG neuron cell bodies. The L4-L6 DRGs were harvested 2 days later. The fluorescent tracer is seen only in regenerated DRG neurons. (f) Intraperitoneal (IP) folic acid supplementation of F0 progenitors enhances spinal axon regeneration in untreated F2 and F3 male progeny. Percentage of regenerated DRG neurons in untreated offspring (F2–F3) descending from F0 progenitors treated with folic acid vs. DDI control. The figure shows responses to test compounds by group and by generation as violin plots. Comparisons of differences within generations were made using the Wilcoxon rank-sum test, and statistical significance was reported as p < 0.05 (FA-turquoise, DDI-grey: F2 FA: n = 10, F2 DDI: n = 11, F3 FA: n = 11, F3 DDI: n = 13).
Tissue preparation and harvest: Forty-eight hours later, the animals were euthanized with 100 mg/kg IP of Beuthanasia-D Special (a combination of pentobarbital sodium and phenytoin sodium; Schering-Plough Animal Health Corp., Union, NJ). The 4th, 5th, and 6th lumbar (L4–6) DRGs were removed, fixed overnight in 4% paraformaldehyde at 4°C, incubated for 3 h in 30% sucrose at room temperature, and quick frozen in Optimal Cutting Temperature compound (OCT; Sakura Finetek, Torrance, CA). Twelve µm sections were cut with a cryostat, then floated on pretreated glass slides (FisherFinestTM, Fisher Scientific, Pittsburgh, PA) and kept at −80°C.
Analysis: DRG sections were scored for tracer uptake using an Axioscope 20 fluorescent microscope (Zeiss, Peabody, MA) with a gold filter (Fluorescence Zeiss Filter Set 02 For UV Shift Free, Excitation: G 365 nm, Dichroic: FT 395 nm, Emission: LP 420 nm) to detect Fluoro-seq™. To detect auto-fluorescence, each section was also examined with a red filter (Zeiss Filter Set 63 HE MRFP Shift Free, Excitation: BP 575/25 nm, Dichroic Mirror: FT 590 nm, Emission: BP 629/62 nm). An observer blinded to the treatment conditions counted the Fluoro-Gold™-labelled cells. The percentage of labelled DRG neurons in each animal was calculated. The denominator was the average total number of cells in mouse DRG using laboratory normative data i.e., 1743 DRG neurons on the side of sciatic nerve injury per the assumption-based method of Abercombie [Citation12] counting only cells with visible nucleoli [Citation13]. Harvesting the peripheral sciatic nerve axon of the ipsilateral DRG enhances the growth of the injured central (i.e., dorsal column) components of DRG neurons [Citation14]. Addition of folic acid supplementation to peripheral nerve injury is synergistic, increasing the number of regenerating axons on the harvested side up to 10-fold [Citation11]. The percentage of labelled neuronal cell bodies in DRGs ipsilateral to the site of the sciatic nerve harvest is reported.
Mouse sperm collection
Animals used for sperm collection were sibs of animals used for phenotyping. Animals used for phenotyping were not used for sperm harvest in order to maintain consistency in the timing of harvest. Three adult male F0, F1, F2, and F3 mice (ages 22–32 weeks) from each treatment group (i.e., FA and DDI) were administered a 10:1 mixture of ketamine/xylazine intraperitoneally (IP) under sterile conditions as above. A small incision was made in the abdomen to expel the epididymis. The cauda epididymis was then isolated and perforated with an 18-gauge needle. Mature sperm cells were collected from the cauda epididymis under the microscope into a well with 700 microlitres (μl) of Human Tubal Fluid (HTF, Millipore-Sigma, catalogue #MR-070 + bovine serum albumin (4 mg/ml of BSA in HTF)) [Citation15]. Sperm movement from the cauda epididymis in solution was observed under a microscope to ensure viability. The mixture was incubated for 10 min at room temperature before 600 μl of sperm/HTF/BSA solution was collected in a 5 ml sterile tube containing 1.2 ml of DNA/RNA shield (Zymo Research, catalogue # R1100–50) to protect DNA and RNA from degradation.
DNA extraction and whole genome methylation sequencing
DNA was extracted according to the manufacture’s protocol for the Quick-DNA miniprep plus kit (Zymo Research, catalogue # D4068). WGMS with enzyme conversion (NEBNext Enzymatic Methyl-Seq, EM-seq™) was used to profile all potentially methylated CpG sites (>25 million) of DNA. EM-seq™ uses TET2 and Oxidation Enhancer to protect methylated cytosines from deamination, and APOBEC to convert unmethylated cytosines to uracil. Subsequent sequencing of the treated DNA provides single base-pair resolution for all methylated sites in the mouse genome. To process the samples, 500ng of high molecular weight genomic DNA was forwarded to the University of Illinois at Urbana-Champaign Roy J. Carver Biotechnology Center for DNA sequence library construction and whole-genome sequencing on a Next-Generation sequencer (Illumina NovaSeq6000).
Whole genome methylation sequencing analysis
The quality of raw FASTQ files was assessed using FastQC. Quality trimming of the reads was performed using trim_galore with a minimum read length of 30bp and a quality score of 30 run in paired-end mode. Following trimming, the reads were aligned to the UCSC mm10 mouse genome using Bismark [Citation16], coupled with bowtie2 [Citation17] with reads aligned in paired-end mode, a minimum score set to L,0,-0.3, and insertion length of 1000bp. Following alignment, reads were deduplicated using Bismark. Methylation extraction and reporting of the methylation level from a single CpGs were performed using Bismark, ignoring 3bp from the 5’-most and 3’-most of reads to avoid methylation bias as indicated by M-bias plots. Read counts were collapsed across strands to report methylation values of CpG dinucleotide sites on the sense strand for downstream analyses.
Identification of differentially methylated regions and positions
Biological replicates (n = 3) from each generation (F0, F1, F2, and F3) were used to identify DMRs using a conservative package (dmrseq) with stringent statistical cut-offs [Citation18]. This number of replicates falls within the realm of normality for exploratory data. Prior reports investigating genome-wide molecular data have successfully used the same sample size [Citation19–23], which, coupled with filtering CpGs for a minimum of 10× coverage (similar to parameters used for this dataset), fulfils sensitivity and specificity thresholds [Citation24]. For each generational pair-wise comparison (i.e., F0 FA versus F0 DDI) CpGs were removed if their coverage was < 5× in at least 1 sample, leaving ~ 20 million CpGs tested in each comparison. DMRs were identified from background candidate regions using the following parameters: 1) A minimum of 5 CpG differentially methylated positions (DMPs) in the region; 2) >10% mean differential methylation between FA and DDI animals in each generation, which aligns with commonly used statistical cut-offs in similar tissues [Citation25–27]; 3) 10 permutations; and 4) a permutated P-value <0.05. Notably, dmrseq performs a generalized least squares regression model with a nested autoregressive correlated error structure in its identification of DMRs.
To test for interactions between treatment group and generation, R package DSS was used to identify DMPs between the F1-F3 generations using a model that incorporated group (i.e., DDI or FA) and generation treated as a continuous variable, and an interaction term between group and generation [Citation28]. DMPs were identified using a false discovery rate (FDR) threshold of 0.05 to determine significance. Notably, DSS performs a dispersion shrinkage method from beta-binomial distributions, coupled with Wald tests to identify DMPs. DMRs were annotated to genes, genomic features, and CpG islands using R package ChIPseeker [Citation29], using ± 2,000bp surrounding the transcription start site as the promoter region. Gene ontologies were performed using R package clusterProfiler [Citation30]. The Hypergeometric Optimization of Motif EnRichment (HOMER) toolkit was used to identify enriched transcription factor motifs in DMRs relative to background regions from DMR identification, using a q value < 0.01 to identify significant transcription factors [Citation31]. R package LOLA [Citation32] was used for enrichment testing of DMRs to genomic features, CpG islands, and chromatin states [Citation33].
Results
Intraperitoneal folic acid supplementation of outbred F0 mice promotes transgenerational epigenetic inheritance of spinal axon regeneration in vivo
We first replicated previous findings of axon regeneration inheritance in progeny of F0 mice treated with folic acid [Citation6]. The proportion of regenerated axons in F2 animals (n = 10–11/group) that descended from F0 progenitors given folic acid (FA) was 5-fold greater than in animals that descended from F0 progenitors given distilled de-ionized water (DDI). In the F3 animals (n = 11–13/group), the proportion of regenerated axons in the FA lineage was 15-fold compared to those in the DDI lineage, consistent with transgenerational epigenetic inheritance (). Full phenotypic data of F0-F3 animals were previously reported [Citation6].
Sperm DNA methylation levels distinguish serial generations of progeny from folic acid treated ancestors
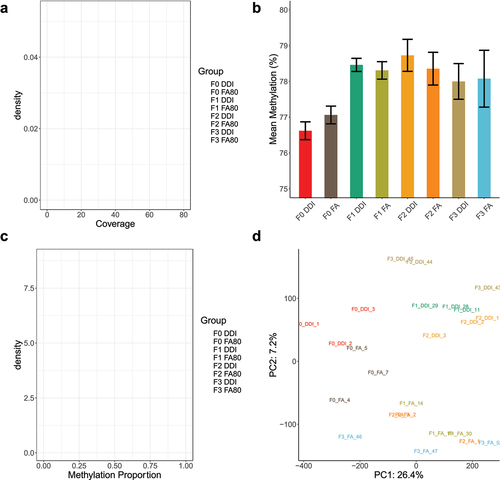
Using the FA and DDI lineages with confirmed axonal regeneration data as above, we collected sperm from adult F0 (n = 3/group), F1 (n = 3/group), F2 (n = 3/group), and F3 (n = 3/group) male mice (&c). Sperm DNA whole-genome methylation sequencing provides basepair-resolution of DNA methylation status at greater than 21 million CpG dinucleotide sites throughout the mouse genome. Following alignment to the mouse reference genome (GRCm38; mm10), deduplication of sequence reads, and removal of CpGs with less than 5× coverage in all tested animals, ~20 million CpG sites with an average coverage of 35× remained for downstream analyses (). The average DNA methylation abundance of the remaining CpG sites spanned 77% to 79% across all generations of untreated progeny from ancestrally (F0) treated FA and DDI lineages (). The distribution of DNA methylation levels was bimodal across all generations and between treatment groups, with the majority of CpG sites either fully methylated or fully unmethylated (). Principal component analysis using DNA methylation estimates from all CpG sites segregated each sample by treatment lineage (FA vs. DDI) using the second principal component. However, the samples did not cluster by generation (). These findings indicate that total DNA methylation levels differentiate by treatment but not by generation.
Figure 2. Global DNA methylation in transgenerational sperm specimens show no significant changes in total methylation levels in untreated generations. (a) A density plot depicts the average read coverage (x-axis) for each of the experimental groups. Coverage depicts the number of sequencing reads covering a given CpG across the genome after collapsing across the 2 DNA strands. Experimental groups are colour-coordinated. (b) A bar plot shows the average genome-wide methylation abundance (%) (y-axis) of biological replicates across all experimental groups and generations (x-axis). (c) A density plot displays the distribution of methylation values (x-axis) and their density (y-axis) of all the tested CpG sites. The distribution of methylation abundance is bimodal, with peaks at 0 (unmethylated) and 1 (fully methylated). Experimental groups are colour-coordinated. (d) A plot shows the distribution of samples plotted against the first 2 principal components following principal component analysis using methylated values from all tested CpG sites.
Folic acid treatment induces DMRs in sperm between serial generations of untreated progeny
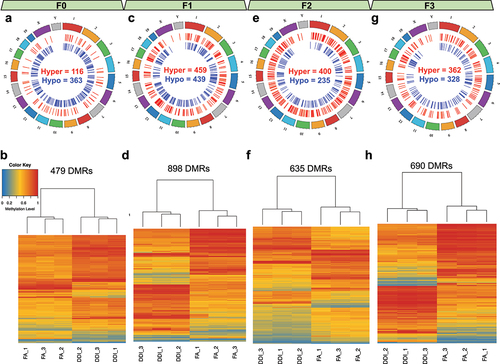
To identify DMRs in mouse sperm genome between treatment groups (FA vs. DDI) within each generation, we used the R package dmrseq that revealed 479 FA-DMRs in F0 mouse sperm, 898 FA-DMRs in F1 mouse sperm, 635 FA-DMRs in F2 mouse sperm, and 690 FA-DMRs in F3 mouse sperm (Methods, ). DNA methylation levels from the FA-DMRs alone were sufficient to distinguish treatment groups in all generations. In each generation, FA-DMRs were located across all autosomes and sex chromosomes of the mouse sperm genome (Supplementary Table 1–4). While the majority of the F0 FA-DMRs were hypomethylated (75.7%), subsequent generations (F1-F3) comprised a greater proportion of hypermethylated FA-DMRs (F1: 51.1%, F2: 62.9%, and F3: 52.6%), indicating greater abundance of DNA methylation levels in untreated progeny following ancestral F0 FA supplementation.
Figure 3. Transgenerational DMRs after F0 exposure to folic acid are found in each consecutive generation and are able to distinguish DDI- from FA-lineage specimens. (a, c, e, g) Circos plots depict the relative location of DMRs distributed across the genome in the F0 generation (a), the F1 generation (c), the F2 generation (e), and the F3 generation (g). Hypermethylated DMRs are shown in red. Hypomethylated DMRs are shown in blue. (b, d, f, h) Heatmaps show the unsupervised hierarchical clustering of tested samples as determined using the DNA methylation levels from CpGs contained within identified generational DMRs for the F0 generation (b), the F1 generation (d), the F2 generation (f), and the F3 generation (h). Low methylation is depicted in blue. High methylation is depicted in red.
Folic acid-generated transgenerational sperm DMRs are enriched in gene regulatory regions
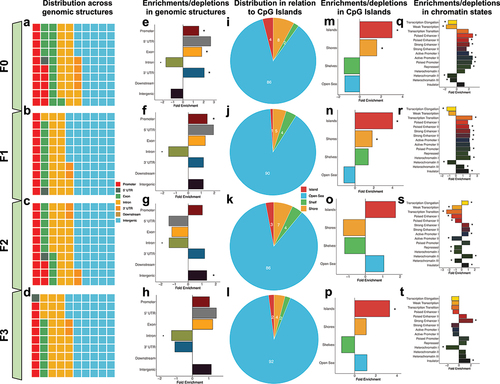
To examine the relationship between FA-DMRs and gene regulatory networks, FA-DMRs from all generational pair-wise comparisons were tested for enrichment in conventional genomic locations (i.e., promoters, 5’ untranslated regions (UTR), exons, introns, 3’ UTR, downstream of genes, and intergenic regions). In each generation, the largest proportion of FA-DMRs was located in intergenic regions of annotated genes (44–56% of DMRs in each generation), followed by intronic sequences (21–28% of DMRs in each generation), and promoters (9–15% of FA-DMRs in each generation; ). Between generations, FA-DMRs were significantly enriched in promoters (F0-F1), exons (F0), 3’ UTRs (F0), and intergenic regions (F2); and significantly depleted in introns (F0-F3; q-value <0.05; ). Only 1–4% of FA-DMRs in each generation were located in CpG islands, with the overwhelming majority located distal (>4kb) to islands (86–92% of DMRs; . Relative to CpG island-specific structures, FA-DMRs were significantly enriched in CpG islands (F0, F1, and F3) and CpG island shores (F0-F1; q < 0.05; ). FA-DMRs tested for enrichment within a 15-chromatin-state model from published mouse testes tissue from F0 and F1 generations were enriched in the majority of chromatin states (, 4 R) [Citation33]. F2 DMRs were mostly depleted in the majority of chromatin states (). F3 DMRs were enriched in strong enhancers and insulators, and depleted in heterochromatin (; q-value <0.05).
Figure 4. Transgenerational DMRs are found in regions of the genome known to regulate gene expression, including promoters and in CpG islands. (A-D) Waffle plots show the relative proportion of DMRs located in each of the standard genomic features for each of the tested generations. Genomic features are colour-coordinated. (E-H) Bar plots show the fold enrichment (x-axis) of the transgenerational DMRs, relative to background regions, for each of the genomic features (y-axis). Significant enrichments/depletions are depicted by an asterisk (*) (adjusted P-value <0.05; Fisher’s exact test). (I-L) Pie charts show the proportions of transgenerational DMRs based on their locations relative to CpG islands. DMRs were determined to be either in CpG islands (red), on the shores of CpG islands (yellow), the shelves of CpG islands (green), or distal to CpG islands in the open sea (blue). (M-P). Bar plots show the fold enrichment (x-axis) of the transgenerational DMRs, relative to background regions, for each of the CpG island features (y-axis). Significant enrichments/depletions are depicted by an asterisk (*) (adjusted P-value <0.05; Fisher’s exact test). (Q-T)) Bar plots show the fold enrichment (x-axis) of the transgenerational DMRs, relative to background regions, for each of the varying 15-chromatin states previously identified in the mouse genome (y-axis). Significant enrichments/depletions are depicted by an asterisk (*) (adjusted P-value <0.05; Fisher’s exact test).
Genes associated with folic acid-generated transgenerational sperm DMRs are functionally enriched for axon-related processes
All FA-DMRs (F0-F3) were annotated to the nearest gene revealing 255, 262, 256, and 212 genes from each consecutive generation, respectively. To appraise the biological significance of FA-DMR-associated genes, we performed a gene ontological (GO) analysis for each generational pair-wise comparison. While the top enriched terms from the F0 FA-DMR-associated genes were related to general cellular mechanisms, FA-DMR-associated genes from all generations of untreated progeny (F1-F3) were enriched for terms linked to axon-related and synapse-related processes including axonogenesis, axon guidance and synapse organization (P-value <0.05; ).
Figure 5. Ontological and transcription factor enrichment analyses of transgenerational DMRs identify genes involved in axon- and synapse-related processes and transcription factors. (a-d) Bar plots depict the top 10 ontological terms (y-axis) for enriched biological processes from transgenerational DMR-associated genes in the F0 generation (a), the F1 generation (b), the F2 generation (c), and the F3 generation (d). The x-axis displays the -log10 value of the adjusted P-value (FDR) for each ontological term. (E-H) Bar plots show the top 10 transcription factors (y-axis) with enriched motifs in the transgenerational DMR sequences for the F0 generation (e), the F1 generation (f), the F2 generation (g), and the F3 generation (h). The x-axis displays the -log10 value of the adjusted P-value (FDR) for each enriched transcription factor.
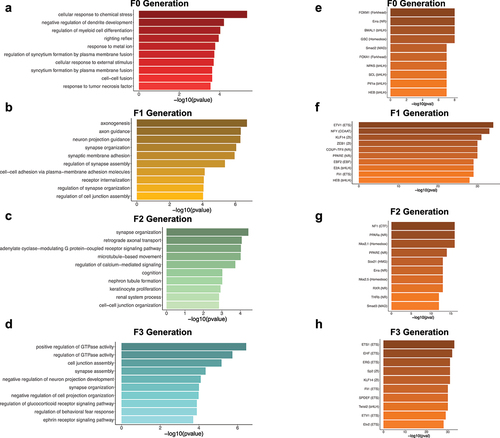
Folic acid-generated transgenerational sperm DMRs are enriched for motifs of developmental transcription factors
The role of FA-DMRs in gene regulation was examined for enrichments in known transcription factor binding motifs [Citation31]. The top enriched motifs were FOXM1 in F0 DMRs (), ETV1 in F1 DMRs (), NF1 in F2 DMRs (), and ETS1 in F3 DMRs (). Among the top 10 enriched motifs for each of the pair-wise comparisons, HEB (TCF12), Erra, ETV1, KLF14, PPARE and Fli1 were present in 2 generations. None of the top 10 motifs were enriched in 3 or all 4 generations.
Folic acid-generated transgenerationally inherited sperm DMRs distinguish between treatment groups
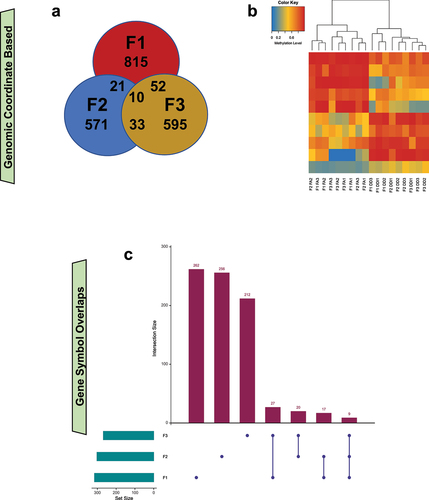
FA-DMR genomic coordinates disclosed 10 shared FA-DMRs between generations (; Supplementary Table 1–4). Average DNA methylation levels from the 10 FA-DMRs were sufficient to discriminate between treatment groups in all generations (). Seven of these mapped to distal intergenic regions, and three mapped to genes Agpat4; Ephb1; and Plekhb1. There were 9 FA-DMR-associated genes that overlapped between generations. These are: Agpat4; D730045A05Rik; Endou; Ephb1; Eya4; Lhcgr; Mpzl1; Plekhb1; and Prkn ().
Figure 6. Transgenerational DMRs in untreated generations overlap at both DMR location and gene-level, suggesting commonality of molecular changes caused by ancestral FA treatment. (a) A Venn diagram depicts the overlap of DMRs, based on genomic coordinates, from the F1 (red), F2 (blue), and F3 (yellow) generations. (b) A heatmap shows the unsupervised hierarchical clustering of tested samples using the mean DNA methylation levels from the 10 transgenerational DMRs that are identified in all 3 generations. (c) An UpSet plot shows the overlap of transgenerational DMR-associated genes between the generations that were not directly treated (i.e., F1–F3). Green bars show the number of DMR-associated genes for each generation. Purple bars show the number of DMR-associated genes specific to each tested overlap.
Transgenerationally inherited sperm DNA methylation levels exhibit increasing or decreasing magnitudes of absolute change with subsequent generations
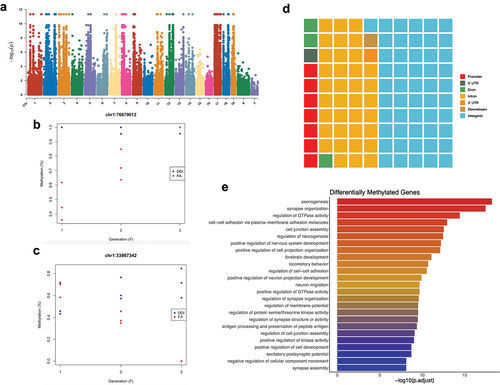
DNA methylation levels in sperm of animals from the 3 untreated generations were subjected to a multivariate linear model that incorporates the condition (i.e., DDI or FA), the generation (i.e., F1, F2, F3), and the interaction between the two. When studying complex models with interactions, locus- or position-level differential methylation (DMP) analyses provide more data points than region-level methylation (DMR) analyses. Our data showed that 14,320 and 15,399 DMPs exhibit progressive increases or decreases in the magnitude of absolute change of DNA methylation levels between the 3 generations, respectively (; Supplementary Table 5). Annotation of the DMPs to genomic structures revealed that 53% were intergenic and 35% were intronic (). Intragenic DMPs reside in genes linked to axonogenesis, synapse organization, brain development, and the regulation of neurogenesis and nervous system development (). These data indicate that many genes associated with axonal regeneration and nervous system development undergo progressive increases or decreases in the magnitude of absolute change of DNA methylation levels.
Figure 7. An interaction model finds molecular evidence of differential DNA methylation in successive F1–F3 generations after ancestral F0 folic acid treatment, with incremental or decremental methylation in 29,719 DMPs. (a) Manhattan plot shows the relative location (x-axis) and significance (y-axis) of the tested CpGs following an analysis of the interaction between groups (i.e., DDI vs FA) and generations (i.e., F1–F3). (b) Plot shows percent DNA methylation (y-axis) of the top DMPs – after ranking by p value – showing increasing methylation levels in FA animals (red) compared to DDI animals (blue) in serial generations (x-axis). (c) Plot shows percent DNA methylation (y-axis) of the top DMPs – after ranking by p value – showing decreasing methylation levels in FA animals (red) compared to DDI animals (blue) in serial generations (x-axis). (d) Waffle plot shows the relative proportion of wash-in DMPs in each of the standard genomic features. Genomic features are colour-coordinated. (e) A bar plot depicts the top 25 enriched ontological terms (y-axis) in genes displaying wash-in DMPs. The x-axis displays the -log10 value of the adjusted P-value (FDR) for each ontological term.
Discussion
Using whole genome methylation sequencing (WGMS) of sperm from folic acid- vs. vehicle-supplemented rodents and their unsupplemented progeny, we report differential germline DNA methylation levels between the treated and untreated lineages and across generations. While stable global DNA methylation levels indicate that sample quality was maintained across generations, we observe that F0 folic acid treatment generates significant gene-specific changes in sperm DNA methylation that are passed down to 3 generations of unexposed progeny, with the alterations occurring primarily in genes that support the development and maintenance of axons and synapses. Because packages for differential DNA methylation analysis of complex WGMS datasets (e.g., DSS and dmrseq [Citation18,Citation34]), including interaction terms, are better suited to analyse DMPs than DMRs, we tested DMRs in 2-group comparisons, and DMPs in the dynamic/wash-in analyses. The use of both DMRs and DMPs is in line with previous studies that have examined differential DNA methylation in sperm samples with conservative statistical cut-offs [Citation25–27].
The number of FA-induced DMRs identified in F1 (N = 898), F2 (N = 635), and F3 (N = 690) generations were greater than those identified in the F0 animals (N = 479). Differentially methylated genes in later generations (F1-F3) were enriched for ontological terms underlying biologically relevant pathways (e.g., synaptic and axonal processes). DMRs fluctuated in all generations, with predominant hypomethylation in the F0 generation, equivalent differential methylation in the F1 generation, predominant hypermethylation in the F2 generation, and equivalent differential methylation in the F3 generation. DNA methylation levels between the 3 generations of untreated progeny derived from F0 animals treated with folic acid revealed over 29,000 CpGs that exhibit progressively increasing or decreasing DNA methylation from F1 to F3, an effect sometimes referred to as ‘wash-in’ [Citation10]. Genes annotated to incremental DMP levels between generations in the present study were previously linked to axonal regeneration, including subunits of the Na+/K+-ATPase [Citation35]. The top terms from ontological analyses showed a high association with axonogenesis and synapse organization. When overlaying the 3,381 unique genes exhibiting dynamic transgenerational shifts in sperm with our previously published list of 1,029 genes displaying differential methylation in F3 spinal cord tissue, 187 genes overlap, denoting genes with links to axonal regeneration, such as Pten, Dscam, and Gabbr2 [Citation5,Citation36–38]. Importantly, the shared genes are observed in different tissues and a different genus of rodents (spinal cord = rats, sperm = mice), and from different comparisons (spinal cord = DMRs in F3 tissue, sperm = DMPs from F1-F3 tissues).
Consistent transgenerational non-genomic changes across all generations (i.e., F1–F3) were observed in 10 DMRs. Genomic annotation of the DMRs revealed that 7 were intergenic and 3 were mapped to genes: Agpat4; Ephb1; and Plekhb1. Agpat4 (1-acylglycerol-3-phosphate-O-acyltransferase 4) encodes a member of the 1-acylglycerol-3-phosphate-O-acyltransferase family, an integral membrane protein that converts lysophosphatidic acid to phosphatidic acid that participates in de novo phospholipid biosynthesis [Citation39] and neuronal regeneration [Citation40]. Ephb1 (EPH receptor B1) encodes a member of the ephrin-B receptor family that mediates developmental nervous system processes [Citation41], including hippocampal neurogenesis [Citation42]. Plekhb1 (Pleckstrin homology domain containing B1) encodes a protein that influences cellular differentiation and protein homodimerization activity, and is deregulated in neurodegenerative models of amyotrophic lateral sclerosis [Citation43,Citation44].
Folic acid-induced changes in DNA methylation levels may alter gene expression, and differential levels of DNA methylation may promote or inhibit the binding of transcription factors to DNA, which may, in turn, also alter gene expression [Citation45]. When we tested for enrichment of folic acid-induced DMRs in published transcription factor binding motifs [Citation31], we found that sperm DMRs are enriched for motifs that are known to bind transcription factors with key functions in developmental pathways. None of the top 10 motifs in our data were enriched in 3 or all 4 generations. Because chromatin states alter the ability of transcription factors to bind and thereby regulate gene expression, we interrogated enrichment of DMRs in diverse chromatin states. Chromatin states derived from testes were generated using 5C chromosome conformation capture. DMRs from all tested generations (F0–F3) were enriched within enhancer regions of the genome that increase the likelihood of transcription of target genes by binding activator proteins [Citation46]. Accordingly, future functional studies will investigate the role of folic acid-induced DNA methylation changes in genomic regions known to bind transcription factors, and to foster chromatin states that are critical in neurological development.
A wash-in effect involves the gradual emergence or increase of a phenotype in consecutive generations of progeny following F0 exposure to an environmental intervention or stressor [Citation10]. Empirical data in support of a non-mammalian wash-in phenotype include increased longevity in C. elegans after exposure to deficiencies of chromatin modifiers [Citation47], and increased insect resilience in plants after treatment with methyl jasmonate [Citation48]. In mammals, Arsenic exposure of male and female F0 rats leads to significant phenotypic changes in the F2 and F3 generations (but not F1), including a decrease in adult body weight, a decrease in liver weight, and an increase in testicular weight, and these results correlated with increased global DNA methylation levels in F2 and F3 [Citation49]. To our knowledge, the rodent model described here and in our previous study [Citation6] is the only experimental model that comprises a wash-in phenotype of a beneficial trait in mammals (both rats and mice), following treatment in F0 progenitors only [Citation5,Citation6].
In the present study, distinctive perturbations in sperm DNA methylation levels of genes involved in axon- and synapse-related biological processes were observed, with a large number of CpG sites revealing a gradual increase or decrease in DNA methylation levels in successive generations of untreated offspring. Conversely, a ‘wash-out’ effect (not observed in this study), represents the emergence of a phenotype in F1 offspring after F0 exposure to an environmental intervention or stressor, followed by a gradual fading or washing out of the phenotype in subsequent generations of offspring, eventually reverting back to baseline levels [Citation10]. Evidence of wash-out effects is also scarce, particularly in mammalian species. These include decreased sperm count in rats following gestational exposure to endocrine disruptors (i.e., vinclozolin and methoxychlor), in which the effect on spermatogenesis gradually dampens in serial generations [Citation50]. Another study identified increased incidence of multiple disease states in female and male rats following gestational exposure to dioxin [Citation51]. Offspring of exposed dams exhibited an increased incidence of prostate disease, ovarian primordial follicle loss, polycystic ovary disease, kidney disease and pubertal abnormalities, in tandem with differentially methylated regions in sperm. The total incidence of disease decreased with each subsequent generation, in keeping with a wash-out effect. While our results support prior observations that epigenetic modifications in sperm may escape erasure during embryogenesis [Citation52], the adaptive advantage of wash-in and wash-out effects is unknown.
The WGMS data reported here do not include sex chromosomes, and they are restricted to one phenotype in one biological system, with no correlation with the size of the biological effect. These limitations will be the subject of future investigations. In addition, since DNA methylation levels operate in concert with other epigenetic mechanisms, including histone and microRNA modifications, future research will include multi-omics and gene pathway analyses of tissues associated with the transgenerationally inherited phenotypes, the study of other tissues that may display transgenerational inheritance of a trait, and further examination of how one carbon metabolism pathways intersect with molecular mechanisms to transmit the epigenetic mark across generations.
Supplmentary Tables 1 to 5.xlsx
Download MS Excel (2.5 MB)Disclosure statement
No potential conflict of interest was reported by the author(s).
Data availability statement
Data used and generated in this manuscript are available upon reasonable request from the authors. Code used to analyse data and generate figures are available at TBD.
Supplementary material
Supplemental data for this article can be accessed online at https://doi.org/10.1080/15592294.2024.2380930
Additional information
Funding
References
- Crews D, Gillette R, Scarpino SV, et al. Epigenetic transgenerational inheritance of altered stress responses. PSNS; 2012;109( 23):9143–17.
- Rahman MS, Pang WK, Ryu DY, et al. Multigenerational and transgenerational impact of paternal bisphenol a exposure on male fertility in a mouse model. Hum Reprod. 2020;35(8):1740–1752. doi: 10.1093/humrep/deaa139
- Nilsson E, Larsen G, Manikkam M, et al. Environmentally induced epigenetic transgenerational inheritance of ovarian disease. PLOS ONE. 2012;7(5):e36129. doi: 10.1371/journal.pone.0036129
- Korolenko AA, Noll SE, Skinner MK. Epigenetic inheritance and transgenerational environmental justice. Yale J Biol Med. 2023;96(2):241–250. doi: 10.59249/FKWS5176
- Madrid A, Borth LE, Hogan KJ, et al. DNA methylation and hydroxymethylation have distinct genome-wide profiles related to axonal regeneration. Epigenetics. 2021;16(1):64–78. doi: 10.1080/15592294.2020.1786320
- Patel NJ, Hogan KJ, Rizk E, et al. Mol Neurobiol. 2020;57(4):2048–2071. doi: 10.1007/s12035-019-01812-5
- Rodgers AB, Morgan CP, Bronson SL, et al. Paternal stress exposure alters sperm microRNA content and reprograms offspring HPA stress axis regulation. J Neurosci. 2013;33(21):9003–9012. doi: 10.1523/JNEUROSCI.0914-13.2013
- Cunningham AM, Walker DM, Ramakrishnan A, et al. Sperm transcriptional state associated with paternal transmission of stress phenotypes. J Neurosci. 2021;41(29):6202–6216. doi: 10.1523/JNEUROSCI.3192-20.2021
- Garrido N, Cruz F, Egea RR, et al. Sperm DNA methylation epimutation biomarker for paternal offspring autism susceptibility. Clin Epigenetics. 2021;13(1):6. doi: 10.1186/s13148-020-00995-2
- Burggren WW, Hoppeler HH. Dynamics of epigenetic phenomena: intergenerational and intragenerational phenotype ‘washout’. J Exp Biol. 2015;218(1):80–87. doi: 10.1242/jeb.107318
- Iskandar BJ, Nelson A, Resnick D, et al. Folic acid supplementation enhances repair of the adult central nervous system. Ann Neurol. 2004;56(2):221–227. doi: 10.1002/ana.20174
- Iskandar BJ, Rizk E, Meier B, et al. Folate regulation of axonal regeneration in the rodent central nervous system through DNA methylation. J Clin Invest. 2010;120(5):1603–1616. doi: 10.1172/JCI40000
- Abercrombie M. Estimation of nuclear population from microtome sections. Anat Rec. 1946;94(2):239–247. doi: 10.1002/ar.1090940210
- Richardson PM, Issa VM. Peripheral injury enhances central regeneration of primary sensory neurones. Nature. 1984;309(5971):791–793. doi: 10.1038/309791a0
- Kito S, Hayao T, Noguchi-Kawasaki Y, et al. Improved in vitro fertilization and development by use of modified human tubal fluid and applicability of pronucleate embryos for cryopreservation by rapid freezing in inbred mice. Comp Med. 2004;54(5):564–570.
- Krueger F, Andrews SR. Bismark: a flexible aligner and methylation caller for bisulfite-seq applications. Bioinformatics. 2011;27(11):1571–1572. doi: 10.1093/bioinformatics/btr167
- Langmead B, Trapnell C, Pop M, et al. Ultrafast and memory-efficient alignment of short DNA sequences to the human genome. Genome Biol. 2009;10(3):R25. doi: 10.1186/gb-2009-10-3-r25
- Korthauer K, Chakraborty S, Benjamini Y, et al. Detection and accurate false discovery rate control of differentially methylated regions from whole genome bisulfite sequencing. Biostatistics. 2019;20(3):367–383. doi: 10.1093/biostatistics/kxy007
- Ruhr I, Bierstedt J, Rhen T, et al. Galli GLJ: developmental programming of DNA methylation and gene expression patterns is associated with extreme cardiovascular tolerance to anoxia in the common snapping turtle. Epigenet & Chromatin. 2021 2nd;14(1):42. doi: 10.1186/s13072-021-00414-7
- Božić T, Frobel J, Raic A, et al. Variants of DNMT3A cause transcript-specific DNA methylation patterns and affect hematopoiesis. Life Sci Alliance. 2018;1(6):e201800153. doi: 10.26508/lsa.201800153
- Haghani A, Li CZ, Robeck TR, et al. DNA methylation networks underlying mammalian traits. Science (New York, NY). 2023;381(6658):eabq5693. doi: 10.1126/science.abq5693
- Clark DF, Schmelz R, Rogers N, et al. Acute high folic acid treatment in SH-SY5Y cells with and without MTHFR function leads to gene expression changes in epigenetic modifying enzymes, changes in epigenetic marks, and changes in dendritic spine densities. PLOS ONE. 2021;16(1):e0245005. doi: 10.1371/journal.pone.0245005
- Chen LL, Han WF, Geng Y, et al. A genome-wide study of DNA methylation modified by epigallocatechin-3-gallate in the CAL-27 cell line. Mol Med Rep. 2015;12(4):5886–5890. doi: 10.3892/mmr.2015.4118
- Ziller MJ, Hansen KD, Meissner A, et al. Coverage recommendations for methylation analysis by whole-genome bisulfite sequencing. Nat Methods. 2015;12(3):230–232. doi: 10.1038/nmeth.3152
- Zhang Y, Bruna de Lima C, Labrecque R, et al. Whole-genome DNA methylation analysis of the sperm in relation to bull fertility. Reproduction. 2023;165(5):557–568. doi: 10.1530/REP-22-0283
- Chen X, Lin Q, Wen J, et al. Whole genome bisulfite sequencing of human spermatozoa reveals differentially methylated patterns from type 2 diabetic patients. J Diabetes Investig. 2020;11(4):856–864. doi: 10.1111/jdi.13201
- Perrier JP, Kenny DA, Chaulot-Talmon A, et al. Accelerating onset of puberty through modification of early life nutrition induces modest but persistent changes in bull sperm DNA methylation profiles post-puberty. Front Genet. 2020;11:945. doi: 10.3389/fgene.2020.00945
- Chen Y, Damayanti NP, Irudayaraj J, et al. Diversity of two forms of DNA methylation in the brain. Front Genet. 2014;5:46. doi: 10.3389/fgene.2014.00046
- Yu G, Wang LG, He QY. ChIPseeker: an R/Bioconductor package for ChIP peak annotation, comparison and visualization. Bioinformatics. 2015;31(14):2382–2383. doi: 10.1093/bioinformatics/btv145
- Yu G, Wang LG, Han Y, et al. clusterProfiler: an R package for comparing biological themes among gene clusters. Omics: A J Intgr Biol. 2012;16(5):284–287. doi: 10.1089/omi.2011.0118
- Heinz S, Benner C, Spann N, et al. Simple combinations of lineage-determining transcription factors prime cis-regulatory elements required for macrophage and B cell identities. Mol Cell. 2010;38(4):576–589. doi: 10.1016/j.molcel.2010.05.004
- Sheffield NC, Bock C. LOLA: enrichment analysis for genomic region sets and regulatory elements in R and Bioconductor. Bioinformatics. 2016;32(4):587–589. doi: 10.1093/bioinformatics/btv612
- Bogu GK, Vizán P, Stanton LW, et al. Chromatin and RNA maps reveal regulatory long noncoding RNAs in mouse. Mol Cell Biol. 2015;36(5):809–819. doi: 10.1128/MCB.00955-15
- Wu H, Xu T, Feng H, et al. Detection of differentially methylated regions from whole-genome bisulfite sequencing data without replicates. Nucleic Acids Res. 2015;43(21):e141. doi: 10.1093/nar/gkv715
- Rizk E, Madrid A, Koueik J, et al. Purified regenerating retinal neurons reveal regulatory role of DNA methylation-mediated Na+/K±ATPase in murine axon regeneration. Commun Biol. 2023;6(1):120. doi: 10.1038/s42003-023-04463-4
- Park KK, Liu K, Hu Y, et al. Promoting axon regeneration in the adult CNS by modulation of the PTEN/mTOR pathway. Science (New York, NY). 2008;322(5903):963–966. doi: 10.1126/science.1161566
- Fernandes KA, Bloomsburg SJ, Miller CJ, et al. Novel axon projection after stress and degeneration in the dscam mutant retina. Mol Cell Neurosci. 2016;71:1–12. doi: 10.1016/j.mcn.2015.12.003
- Lu Y, Shan Q, Ling M, et al. Identification of key genes involved in axon regeneration and wallerian degeneration by weighted gene co-expression network analysis. Neural Regen Res. 2022;17(4):911–919. doi: 10.4103/1673-5374.322473
- Zhukovsky MA, Filograna A, Luini A, et al. The structure and function of acylglycerophosphate acyltransferase 4/Lysophosphatidic acid acyltransferase delta (AGPAT4/LPAATδ). Front Cell Dev Biol. 2019;7:147. doi: 10.3389/fcell.2019.00147
- Roy D, Tedeschi A. The role of lipids, lipid metabolism and ectopic lipid accumulation in axon growth, regeneration and repair after CNS injury and disease. Cells. 2021;10(5):1078. doi: 10.3390/cells10051078
- Cramer KS, Miko IJ. Eph-ephrin signaling in nervous system development. F1000Res. 2016;5:5. doi: 10.12688/f1000research.7417.1
- Chumley MJ, Catchpole T, Silvany RE, et al. EphB receptors regulate stem/progenitor cell proliferation, migration, and polarity during hippocampal neurogenesis. J Neurosci. 2007;27(49):13481–13490. doi: 10.1523/JNEUROSCI.4158-07.2007
- Marques RF, Duncan KE. SYNGR4 and PLEKHB1 deregulation in motor neurons of amyotrophic lateral sclerosis models: potential contributions to pathobiology. Neural Regen Res. 2022;17(2):266–270. doi: 10.4103/1673-5374.317960
- Marques RF, Engler JB, Küchler K, et al. Motor neuron translatome reveals deregulation of SYNGR4 and PLEKHB1 in mutant TDP-43 amyotrophic lateral sclerosis models. Hum Mol Genet. 2020;29(16):2647–2661. doi: 10.1093/hmg/ddaa140
- Deaton AM, Bird A. CpG islands and the regulation of transcription. Genes Dev. 2011;25(10):1010–1022. doi: 10.1101/gad.2037511
- Sanyal A, Lajoie BR, Jain G, et al. The long-range interaction landscape of gene promoters. Nature. 2012;489(7414):109–113. doi: 10.1038/nature11279
- Greer EL, Maures TJ, Ucar D, et al. Transgenerational epigenetic inheritance of longevity in Caenorhabditis elegans. Nature. 2011;479(7373):365–371. doi: 10.1038/nature10572
- Rasmann S, De Vos M, Casteel CL, et al. Herbivory in the previous generation primes plants for enhanced insect resistance. Plant Physiol. 2012;158(2):854–863. doi: 10.1104/pp.111.187831
- Nava-Rivera LE, Betancourt-Martínez ND, Lozoya-Martínez R. Transgenerational effects in DNA methylation, genotoxicity and reproductive phenotype by chronic arsenic exposure. Sci Rep. 2021;11(1):11. doi: 10.1038/s41598-021-87677-y
- Paoloni-Giacobino, A. Epigenetic effects of methoxychlor and vinclozolin on male gametes. Vitam Horm. 2014;94:211–227. doi:10.1016/B978-0-12-800095-3.00008-0
- Manikkam M, Guerrero-Bosagna C, Tracey R, et al. Transgenerational actions of environmental compounds on reproductive disease and identification of epigenetic biomarkers of ancestral exposures. PLOS ONE. 2012;7(2):e31901. doi: 10.1371/journal.pone.0031901
- Ben Maamar M, Wang Y, Nilsson EE, et al. Transgenerational sperm DMRs escape DNA methylation erasure during embryonic development and epigenetic inheritance. Environ Epigenet. 2023;9(1):dvad003. doi: 10.1093/eep/dvad003