
 ?Mathematical formulae have been encoded as MathML and are displayed in this HTML version using MathJax in order to improve their display. Uncheck the box to turn MathJax off. This feature requires Javascript. Click on a formula to zoom.
ABSTRACT
Epigenetic marks do not follow the Mendelian laws of inheritance. The environment can alter the epigenotype of an individual when exposed to different external stressors. In lactating cows, the first stages of gestation overlap with the lactation peak, creating a negative energy balance that is difficult to overcome with diet. This negative energy balance could affect early embryo development that must compete with the mammary tissue for nutrients. We hypothesize that the methylation profiles of calves born to nonlactating heifers are different from those of calves born to lactating cows. We found 50,277 differentially methylated cytosines and 2,281 differentially methylated regions between these two groups of animals. A comethylation network was constructed to study the correlation between the phenotypes of the mothers and the epigenome of the calves, revealing 265 regions associated with the phenotypes. Our study revealed the presence of DMCs and DMRs in calves gestated by heifers and lactating cows, which were linked to the dam’s lactation and the calves’ ICAP and milk EBV. Gene-specific analysis highlighted associations with vasculature and organ morphogenesis and cell communication and signalling. These finding support the hypothesis that calves gestated by nonlactating mothers have a different methylation profile than those gestated by lactating cows.
Background
Breeding programs in animal production aim to increase both productivity and health-related traits. In dairy cattle, improvements in phenotypes of interest have been achieved due to the adoption of genetic selection and artifitial selection (e.g., milk, protein and fat yields, fertility or welfare) [Citation1]. The genomic era provided new tools to further improve the statistical models used in animal breeding, increasing the accuracy of estimated breeding values (EBVs), even for young individuals who have not yet produced offspring [Citation2]. The more information available, the fewer errors are made when selecting the parents of the next generation [Citation3]. However, EBV accuracy is far from perfect yet, as statistical models cannot totally capture the complexity of biological systems, including the effect of environmental forces.
For instance, the environment surrounding an individual can modify their phenotype and that of their offspring via methylation marks [Citation4]. These external signals are usually stressors that put animal welfare at risk [Citation5]. These acquired marks can persist throughout an individual’s life [Citation6] and into adulthood and thus their study is relevant in the animal breeding field. In lactating dairy cows, the peak of lactation overlaps with the first stages of foetal development of subsequent gestation [Citation7]. During lactation, the cow mobilizes large energy reserves, and the food intake does not provide the necessary energy to support both lactation and pregnancy. This leads to a negative energy balance that may challenge the metabolic demands for gestation, posing an external stressor for the embryo/foetus and potentially altering its epigenetic profile [Citation8]. This phenomenon does not occur in heifers (i.e., animals in their first pregnancy), as they have not undergone a previous lactation.
Some epigenetic modifications, such as methylation, involve a set of genetic features that do not follow the Mendelian laws of inheritance [Citation9]. In mammals, DNA methylation consists of the addition of a methyl group at the fifth carbon of a cytosine, creating 5-methylcytosine (5mC) [Citation10]. This process is usually related to gene silencing, as it inhibits the binding of transcription factors (TFs) to promoter regions, preventing the start of DNA transcription into RNA [Citation11]. These marks are of crucial importance in cell differentiation and embryogenesis and are involved in the determination of cell types [Citation12] and imprinting [Citation13]. Nevertheless, the role of methylation marks in gene coding regions remains uncertain, as they are associated with both the protection of the genomic region from mutations and gene activation [Citation14,Citation15]. Methylation marks act on the DNA either silencing gene expression when appearing on promoter regions or enhancing it when overlapping with the gene body.
Methylation marks are just one mechanism that modulates phenotypes. Other regulators of gene expression include histone modifications, chromatin remodelling, and RNA-mediated silencing [Citation16]. Histones, proteins in chromatin, undergo various posttranslational modifications that affect their interactions with nuclear proteins and DNA. During oocyte maturation, low acetylation levels maintain precise gene expression. In early embryo development, chromatin remodelling ensures proper nuclear architecture for cellular differentiation. Before fertilization, male chromatin decondenses, while maternal chromatin remains stable but marked for replication and transcription. Gene silencing also occurs at the mRNA level via noncoding RNAs (ncRNAs), which include long ncRNAs (over 100 nt) and short ncRNAs (under 100 nt) [Citation17]. Long ncRNAs, like Xist RNA, ensure gene dosage balance [Citation18], while short ncRNAs include siRNAs, miRNAs, and piRNAs, each playing roles in gene silencing and maintaining genome integrity [Citation17,Citation19]. In this work, we mainly focused on the silencing role of methylation marks, but these modifications also act as means of protecting the gene sequencing by hinding mutations or sequence alterations and upregulating gene expression [Citation20,Citation21].
Recent advancements in technologies for detecting methylation marks have provided an opportunity for the animal breeding industry to complement genomic selection. Epigenetic information may increase the accuracy of genomic predictions of breeding values. If these marks persist across generations, some of them might be in linkage disequilibrium with SNPs and could be treated as (epi)genetic variants [Citation22] that can be incorporated into genomic relationship matrices and statistical models. Those that are not associated with SNPs may provide new information and explain part of the phenotypic variability in the population.
One of these advances is the detection of new epigenetic biomarkers [Citation4]. Oxford Nanopore Technologies (ONT) enables the simultaneous identification of a sample’s genotype and epigenotype by generating FAST5 files (a native data format provided by nanopore sequencers) that capture the electric changes in the pore. These files are later transformed into nucleotide sequences (FASTQ files) through a process called basecalling. The sequences of nucleic acid patterns have a unique electrical profile that can be detected during the basecall process [Citation23]. Methylation marks in CpGs change the original profile of cytosines, making them detectable by ONT [Citation24].
Based on these premises, we hypothesize that the methylation profile of calves born to nonlactating heifers may differ from that of calves born to lactating cows. Studying differentially methylated cytosines (DMCs) and differentially methylated regions (DMRs) could lead to the discovery of potential biomarkers of metabolic stress in calves and its implementation in breeding programs. Additionally, we inferred a novel comethylation network based on the partial correlation and information theory (PCIT) algorithm [Citation25] to identify clusters of DMRs that share biological pathways, allowing us to reduce the dimensionality of the data by focusing on differentially methylated genes (DMGs).
Methods
DNA extraction
Blood samples were drawn from six newborn Holstein – Friesian calves from a commercial farm by jugular venepuncture. Three of them were gestated by nonlactating heifers, and the remaining 3 were from multiparous cows during their third pregnancy and second lactation. All cows and calves were unrelated. Samples NL1, NL2 and NL3 were from calves born to nonlactating cows (NL), and L1, L2 and L3 were from lactating cows (L).
DNA extraction was conducted using the Monarch ® HWM DNA Extraction Kit for Cells & Blood (New England Biolabs®). This kit was selected to obtain long DNA fragments and improve the sequencing yield. To further increase the sequencing yield, the DNA was fragmented to a length of 8 kilobases using a Covaris g-TUBE® (Covaris 520,079) to centrifuge the sample at 8,600 rpm, as recommended by the manufacturer. The purity and concentration of the samples were measured using a Qubit Fluorometer (Thermo Fisher Scientific).
DNA sequencing
Sequencing of the samples was performed using a GridION sequencer (Oxford Nanopore Technologies. ONT, Oxford, UK). Libraries were prepared starting from 3 µg of DNA following the protocol from the SQK-LSK110 kit provided by Oxford Nanopore Technologies. Each sample was sequenced individually in an R9.4 flow cell. Basecalling was performed using Guppy version 6.3.7 [Citation26] with the model dna_r9.4.1_e8.1_modbases_5mc_cg_sup.cfg. Quality control of the samples was conducted using NanoPlot (v1.36.2) [Citation27] to ensure that the Phred score and mean length of the samples passed the quality threshold.
Methylation calling
The analyses were performed using f5c version 1.1 in the Bracewell CSIRO HPC (Australia). FAST5 and FASTQ files were indexed using the f5c index function and then aligned to the reference genome Bos_taurus.ARS-UCD1.2.fa by minimap2 [Citation28]. Files were sorted using samtools v1.16.1 [Citation29] to generate a bam file. The candidate sites were extracted from the FASTQ files using the function call_methylation from the f5c software. Then, the methylation frequency was determined using f5c’s meth-freq. The distribution of the methylation frequencies obtained by f5c [Citation30] of each sample was estimated using methylkit v3.16 [Citation31]. The ensembl genesBtau.gff3 annotation file (https://ftp.ensembl.org/pub/release-111/gff3/bos_taurus/) was used to estimate the methylation frequency of the CpGs detected in each sample in regions close to the transcription start site (TSS) and transcription termination site (TTS).
Differential methylation analyses
The R (version 4.2.1) [Citation32] package DSS v2.46.0 [Citation33], which is specifically designed for bisulphite-sequenced data, was used to estimate differentially methylated regions. The methylation files generated from f5c were formatted to meet the requirements of DSS. This involved retaining only the chromosome, the position of the CpG methylation site, the sequencing depth of that CpG site, and the number of methylated reads. Only the sites that were present in all samples were retained 12,160 CpGs were hence included in the following analyses. Files were filtered to only retain sites with CpGs with a sequencing depth greater than 7X, independent of their methylation status. The methylation object was then created using the function makeBSseqData, and the differential methylation at each CpG was calculated using DMLtest, manually selecting the groups to which each sample belongs. The smoothing option was set to TRUE, as recommended for genome-wide analyses. The DMCs were then called using the callDML function, setting a p-value threshold of 0.05. Delta, the minimum value for the difference between the estimated means of each group, was set at 0.2. The remaining sites were then filtered by a false discovery ratio (FDR) of 0.05. The same procedure was followed for the DMRs using the callDMR function. CallDMR detects regions with statistically significant CpGs and merges the position into regions if there are at least 3 CpGs within 50 base pairs.
Both DMCs and DMRs were separated into hypermethylated or hypomethylated features using calves born from NL heifers as a reference (DMR hypomethylated, DMR hypermethylated, DMC hypomethylated and DMC hypermethylated). Thus, we referred to a hypomethylated DMC/DMR when the methylation frequency was lower in the genome of calves from nonlactating heifers and hypermethylated when the position had a methylation frequency greater in this group than in the calves born from lactating cows. The genomic positions were annotated to the closest gene/microRNA with a maximum distance allowed of 50 kb [Citation34]. Regions that appeared to be associated with both hyper and hypomethylated genes were excluded to facilitate interpretation.
Permutation of the groups
Permutation analyses were implemented to check for spurious associations. The differential methylation analyses were implemented on each of the 20 possible combinations of each sample belonging to the nonlactating or lactating groups given by the following formula: where the samples were interchanged between group of calves gestated by primiparous cows and calves gestated by multiparous cows. The minimum overlap of genes appearing in the four categories of DMC hypo- and hypermethylated and DMR hypo- and hypermethylated was sought, as well as a decreased number of genes overlapping between hypermethylated DMC and hypomethylated DMC.
Gene annotation and description of genomic regions
Gene annotation was performed using the function annotatePeak from the R package ChipSeeker [Citation35]. Org.Bt.eg.db [Citation36] and TxDb.Btaurus.UCSC.bosTau9.refGene, which correspond to the Bos taurus reference genome ARS-UCD1.2, were selected as annotation packages. A window of 3,000 base pairs both up- and downstream of the promoters was selected as the transcription start site. Each of the subset datasets was annotated individually, and the list of genes associated with those regions was extracted.
Enrichment analyses
Enrichment analyses were performed on the previously mentioned datasets using the compareCluster function from the R package clusterProfiler [Citation37] adjusted by the Benjamini‒Hochberg procedure to control the false discovery rate with a p-value cut-off of 0.05. The function ‘enrichGO’ was applied to perform a gene ontology over-representation test.
To determine whether the significant regions are associated with genes involved in biological processes related to embryo development, well-being, or phenotypic traits of interest in the farming industry, an enrichment analysis was performed on the genes identified by the PCIT algorithm. Enrichment of the networks was performed using g:Profiler [Citation38], the statistical domain scope was set as ‘only annotated genes’ and the significance threshold as ‘g:SCS threshold’ with an adjusted p-value threshold of 0.05.
Construction of the comethylation network
Windows of 500 bp along the genome were created using pycoMeth [Citation39]. The log likelihood-ratio (llr) for methylation probability in each window was estimated. Those windows with a llr greater than −3.5 or lower than 3.5 were removed to avoid ambiguous sites. Missing data were not allowed (e.g., windows must appear in all six samples to be kept for the analyses).
The lactation status of the dam was included as a binomial explanatory variable to indicate whether the dam was lactating during gestation. The calves’ milk EBV and the genetic indices for body capacity index (ICAP) were also included to study their effect on the methylation status. The ICAP index incorporates traits like stature, chest width, body depth, and rump width into economic indexes by assigning them appropriate weights. Meanwhile, the EBV, or estimated breeding value, compares an animal’s genetic merit for a specific trait to the population’s average genetic value, enabling the ranking of animals according to their genetic potential. Both values were included in this work due to their significance in assessing and improving livestock genetics. All traits were provided by CONAFE, the Spanish Holstein Association, obtained during their genomic evaluations.
The relationship between the remaining regions was estimated using a PCIT analysis [Citation21]. The PCIT algorithm consists of two main steps: (1) the partial correlations are estimated in every trio of nodes (genes, phenotypes or DMRs) to determine the strength of the linear relationship when the first node pair is uncorrelated to the third node, and (2) the Data Processing Inequality theorem of Information theory is used to calculate the tolerance level and discard the nonsignificant associations. An association was considered significant when the correlation of the first two genes of the gene was greater than the tolerance level. Regions with a correlation greater than or equal to 0.75 were retained for subsequent analyses.
Visualisation of the network
The correlation matrix was loaded into Cytoscape [Citation40], and the yFiles organic layout was used to visualize the correlations. This algorithm follows the force-directed layout approach, which handles the nodes as physical objects with repulsive forces and the edges (connections between the nodes) as springs, exerting forces in both directions. The aim is to minimize the forces exerted by both edges and nodes. Regions were annotated and named as the closest gene to them. Nodes are coloured according to the status of that region in the differential methylation analyses; hypermethylated regions were coloured in yellow, and hypomethylated regions were coloured in purple. The size of the gene-containing nodes is determined by the proximity to promoter regions and is greater if the region is annotated to a window of −3,000 to 3,000 bp to the promoter of the gene.
Phenotypic subnetworks of the first neighbours of lactation, EBV and ICAP, were extracted, and the nodes were separated according to their methylation status and their correlation with the phenotype.
Results
Sequencing results
The sequencing yields are shown in Supplementary and a summarization in . The mean length was ~8 kb, as expected and the Phred score was >11 for every sample.
Table 1. Summary statistics of sequencing performance. On the upper side of the table, calves born from nonlactating cows; on the bottom, calves born from lactating cows.
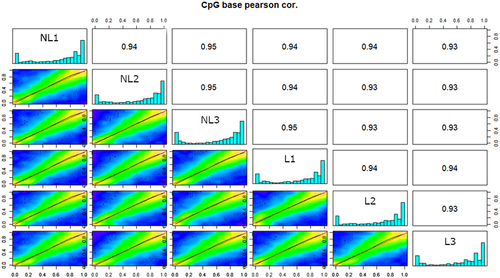
A bimodal U-shaped distribution skewed towards 0% and 100% was observed for the methylation frequency. The diagonal of depicts these profiles, showing a tendency towards a 100% or 0% methylation frequency, with intermediate frequencies not being prevalent. The methylation profiles of the six samples were similar. The methylation pattern showed strong agreement between samples (upper triangle ). However, samples from NL calves showed slightly greater agreement between their methylation profiles (0.94 < r < 0.95) than did those from L calves (r = 0.93).
Figure 1. Correlations between the methylation profiles of the six samples analysed. The upper triangle represents the pearson correlation coefficient between the methylation frequencies of the samples by pair. The histogram on the diagonal illustrates the methylation frequency distribution of the marks throughout the genome. The lower triangle depicts a set of scatterplots showing the pairwise percentages of methylation in all samples, where the red line in the plot is from the linear regression fit and the green line is from the polynomial regression fit.
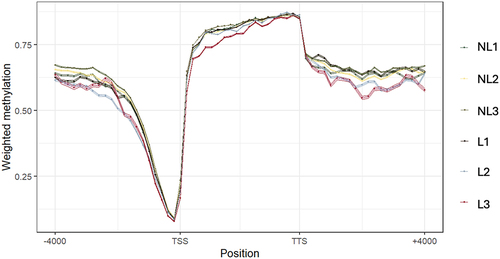
The methylation frequency in these regions was estimated for each of the 17,416 genes in the annotation file. It can be observed () that the methylation frequency decreased at positions closer to the TSS to allow gene expression. The values increased in the in-body gene region (from the TSS to the TTS) and decreased to approximately 60% from the TTS.
Figure 2. Genomic regions were split into 60 windows for each gene annotated in the cow genome to compare the methylation in different genic coordinates. The methylation profiles of the marks detected in each sample were −4,000 bp from the TSS and +4,000 bp from the TTS. The lines and dots represent the mean methylation, and the width of the bands represents the maximum and minimum values of the confidence intervals.
Differential methylation analyses
A total of 50,277 DMCs were detected showing a bimodal distribution in their delta values. This bimodality occurred as the delta values approached −1 or 1, reflecting whether the control group (nonlactating dams) exhibited a lower or higher estimated methylation mean compared to calves born from lactating cows. A delta value of −1 indicates complete unmethylation in the daughters of nonlactating heifers (NL samples) and complete methylation in calves gestated by lactating cows (L samples). Specifically, a hypomethylation pattern was observed in 54% of the DMCs in calves born from nonlactating heifers, while 46% of the DMCs displayed hypermethylation (). Overall, the within-chromosome distributions followed those of the genome-wide distribution, with the exception of chromosomes 24 and 28, which were hypermethylated in the nonlactating group, and chromosomes 8, 19, 25 and 29, which showed a greater proportion of hypomethylated sites (Supplementary Figure S1).
Figure 3. Distribution of the difference in methylation frequency for the DMCs and DMRs between the two study groups. The red vertical lines represent the delta value = 0.2 (minimum difference between the estimated means of each group).
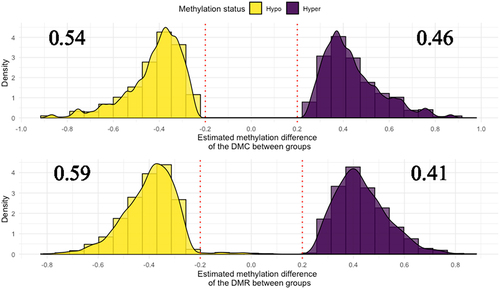
In terms of DMRs, 2,281 were detected with FDRs lower than 0.05 and a delta of 0.2 (). On average, 59% of the regions were hypomethylated in the nonlactating group, and the remaining 41% were hypermethylated. At the chromosome level, chromosomes 20 and 24 seemed to be hypermethylated compared to those in the lactating group. Chromosomes 1, 8, 10 13, 14, 18, 19 23 and 29 appeared to be hypomethylated (Supplementary Figure S2).
A total of 4,704 genes were found to be associated with hypermethylated DMC; 4,658 with hypomethylated DMC; 859 with hypermethylated DMR and 1,119 with hypomethylated DMR. A Venn diagram () was generated to depict the overlap of the annotated genes. The four DMC and DMR groups shared 168 genes, but a total of 1,609 genes were associated with both hypermethylated and hypomethylated regions simultaneously. We found 1,784 genes associated with hypermethylated DMCs and 1,584 associated with hypomethylated DMCs.
Figure 4. Venn diagram depicting the overlap of the genes associated with each DMC/DMR.
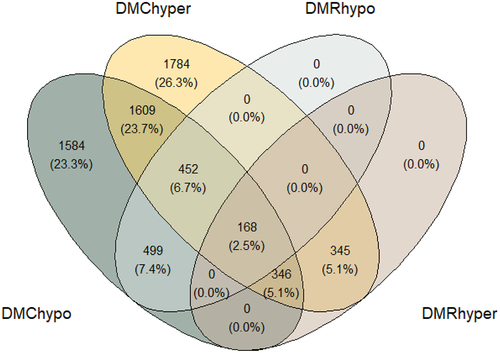
Twenty permutations were drawn to cover the whole set of possible combinations for the six samples (Supplementary Figure S3). The scenario where each animal was correctly assigned to its group, and its mirror image (with groups interchanged) had the lowest percentage (2.5%) of overlapping genes for DMR/DMC hypermethylation and hypomethylation. The total of overlapping genes was 168 (ranging from 175 to 283). Regarding hypo- and hypermethylated DMCs, both combinations also had the lowest percentage of overlapping with 23.7% (1609 genes), with a range of permutations from 1637 to 1920 in the permutation analyses. The Venn diagram depicts an overlap of the genes associated with different methylation statuses (DMC/DMR hypomethylated and DMC/DMR hypermethylated), which is due to the process of annotating the genomic positions to the closest gene. Two positions close to each other with different methylation statuses can be annotated to the closest gene by ChIPSeeker. A cytosine or region cannot be both hypo- and hypermethylated at the same time, but a gene can be identified by two proximal regions, one hypo- and the other hypermethylated. The permutation analysis supported the results from the association analyses, as permuted combinations increased the percentage of overlap between the four groups. As overlap can be interpreted as noise, the noise is increased for the permuted groups. For the same reason, the removal of overlapping genes is recommended in the quest for potential biomarkers.
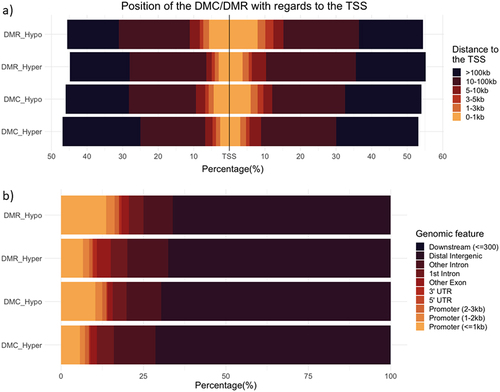
After annotating DMCs and DMRs, we observed that a greater proportion of hypomethylated cytosines/regions in the nonlactating heifer group appeared in promoter regions (). However, hypermethylated regions were more common in distal intergenic regions. Hypomethylated promoter regions in the nonlactating group may suggest an association with greater transcriptional activity of those genes compared to calves born to lactating cows.
Figure 5. Distribution of the genetic features associated with each DMC/DMR depending on their status. Image a) depicts the distance of the mark to the transcription start site. b) represents the genetic feature with which the mark is associated.
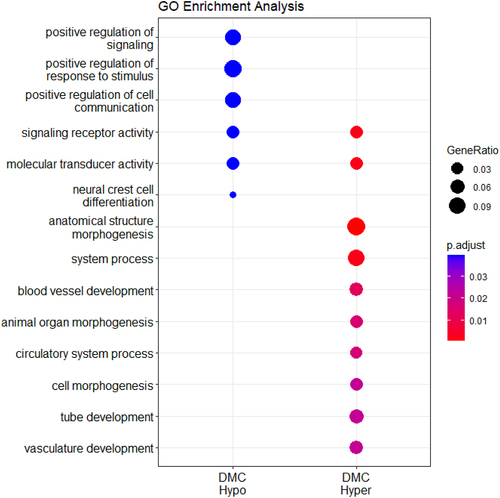
The enrichment analysis of the genes associated with the set of DMCs showed that hypermethylated DMCs in NL calves were associated with biological processes involving anatomical structure, organ and cell morphogenesis and blood vessel and vasculature development. On the other hand, hypomethylated DMCs in NL calves were associated with genes involved in the positive regulation of stimuli, signals and communication as well as neural crest cell differentiation ().
Figure 6. Enrichment analysis performed on the genes associated with the DMR and DMC regions using clusterProfiler and calves gestated by nonlactating cows as a reference group. The size of the dots represents the “GeneRatio,” defined as k/n, where k is the number of genes in our dataset that are annotated to the GO term and n is the total number of unique genes in the dataset.
Comethylation network
A total of 4,367,996 genetic windows, each spanning 500 base pairs, were identified by pycoMeth. Among those 19,722 regions were present in all the 6 samples, but this number decreased to 3,006 after filtering the methylation frequency for |llr| ≥ 3.5. This list served as the input for the PCIT algorithm, resulting in the estimation of 4,516,515 correlations, with 181,547 (4.01%) being statistically significant. To simplify the network, an additional file was created to retain the nodes with a correlation ≥0.7 (in absolute value). The enrichment analysis of the genes associated to these regions are shown in Supplementary Table 2. The enrichment analysis revealed a spectrum of enriched Gene Ontology (GO) terms. Noteworthy findings include the prevalence of terms associated with developmental processes, such as ‘multicellular organism development,’ ‘anatomical structure development,’ and ‘system development.’ Additionally, terms related to cellular components and molecular functions, such as ‘cytoplasm’ and ‘protein binding,’ were also found. The identification of terms related to both positive and negative regulation of biological processes highlights the regulatory networks governing developmental pathways. Also, the enrichment of terms such as ‘neurogenesis,’ ‘nervous system development,’ and ‘generation of neurons’ suggests a particular emphasis on neurodevelopmental processes. Furthermore, the presence of terms related to cell–cell communication and signalling underscores the importance of intercellular interactions in coordinating developmental events.
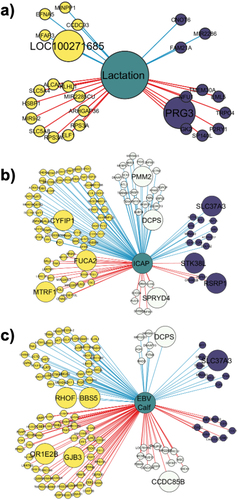
Supplementary figure S4 depicts the whole comethylation network. shows the first neighbours of lactation status of the dam (), ICAP () and the calves’ milk EBV (). The calf EBVs for milk were associated with 124 regions, 114 regions were associated with ICAP, and 27 were associated with lactation status. The enriched genes found in the lactation status network were ALCAM, ELF1 and P2RY1, in the ICAP network were PAK1, SYT1, MYC, ATP6V0D2, COL1A2 and HAS2 and in the milk EBV network were KCNK1, MET, CIBAR1, PAK1, INHBA, SLF1, CHRM3 and CIBAR1.
Figure 7. Comethylation network between the regions and first neighbours of a) lactation status and b) body capacity index (ICAP) c) milk EBV of the calf. Yellow nodes represent genes associated with hypomethylated DMRs, and purple nodes represent those genes associated with hypermethylated DMRs. The white nodes are regions not detected as DMRs by DSS. The blue lines represent positive correlations, while the red lines indicate negative correlations. Larger nodes were regions that were annotated against promoter regions (−3,000 to 3,000 bp from the TSS).
Discussion
The study of the methylome in livestock populations could improve the accuracy of the prediction of phenotypes of interest by explaining alterations in gene expression. In this work, we proposed a comethylation network approach to determine how dam milk production impacts the methylation pattern of offspring. We also propose a relationship between the methylation status of the animal and its breeding values for body conformation and milk yield. This approach provides specific information at the molecular level, proposing new markers associated with traits of relevance in the livestock field. This information could be implemented in future genetic evaluation following a quantitative approach to add valuable information to breeding programmes.
The proportion of methylation marks was similar among the six samples. A large proportion of the sites were close to complete methylation or unmethylation. This methylation pattern has already been reported in humans [Citation41,Citation42] and other animals [Citation43] epigenetic studies where a U-shaped distribution was observed in the methylation frequency of the CpGs throughout the genome. The strong correlation between the methylation profiles of the six samples (Pearson correlation = 0.93–0.95) suggest that there is a population-specific methylation, which may reduce the inter-sample variability and hamper the detection of DMCs/DMRs.
The methylation frequency profile followed a similar distribution to that of other superior eukaryotes. A sudden drop closer to the TSS and promoter regions to avoid gene repression can be observed and an increase in methylation frequency up to 80% appears in the gene body regions [Citation44], as gene-body methylation is associated with increased gene transcription, and methylation in promoter regions is associated with gene silencing, which is necessary for the correct establishment of different cell lines [Citation45–47].
We found differences in the distribution of the marks that were hypo- or hypermethylated in calves gestated by nonlactating heifers. Calves gestated by non-lactating cows present a larger proportion of hypomethylated DMCs and DMRs than L calves. Hypomethylated positions in the calves born from nonlactating cows seem to be closer to the TSS in a larger proportion than hypermethylated positions, meaning that these genes are most likely to be more highly expressed in the calves born from nonlactating heifers than in the calves born from lactating cows, although transcriptomic analyses would be necessary to validate this finding.
Previous publications have hypothesized that the productive level of mothers could impact the future performance of their daughters. Individuals whose initial stages of foetal development occurred without maternal lactation produced 52 kg more milk during their first lactation and lived 16 days longer than the average cow born to mothers who conceived while lactating [Citation7]. There were differences between the methylation pattern in blood samples of calves born to nonlactating Holstein heifers and lactating dams appeared when their feed was supplemented with methyl donors [Citation48]. Bach et al. found no differences between the global methylation profile of calves born to non-lactating heifers and born to lactating cows. Regardless of this, they found 11 CpGs at promoter regions and 112 at gene region hypermethylated in calves gestated by heifers and 14 CpGs in promoter regions and 71 CpGs in gene regions hypomethylated in these animals. In our study, we identified 50,277 DMCs and 2,281 DMRs with a FDR of less than 0.05 and a delta greater than 0.2. Interestingly, 54% of the DMCs were hypomethylated in calves born from nonlactating cows. This proportion increased to 59% when considering the DMRs. These findings suggest a trend towards hypomethylation in the nonlactating group, which could have implications for gene expression and subsequent developmental processes. This hypomethylation pattern was observed across almost all chromosomes, indicating a widespread epigenetic alteration. However, exceptions were noted on chromosomes 20, 24, and 28. Specifically, chromosome 28 exhibited hypermethylation at DMCs for NL calves, chromosome 20 showed hypermethylation at DMRs, and chromosome 24 displayed hypermethylation at both DMCs and DMRs (Supplementary Figure S1). Our results aligned with the ones in the mentioned study, as we propose new DMC and DMRs associated to the effect of gestation and lactation and indicate that there are indeed differences in the methylation profile of calves gestated by non-lactating heifers and those gestated by lactating dams.
Our research revealed that genes linked to differentially methylated cytosines between NL and L animals showed significant enrichment for processes such as morphogenesis of anatomical structures, organ and cell morphogenesis, and vasculature development, particularly in cases of hypermethylated DMCs in NL calves. These processes are crucial in embryonic development, as they orchestrate the spatial and structural rearrangement of tissues necessary for precise organ formation [Citation49]. Conversely, hypomethylated genes in NL were predominantly associated with the positive regulation of signalling pathways, response to stimuli, and cell communication. These findings highlight substantial differences in the methylation profiles between calves born to nonlactating cows and those born to lactating cows. The detected DMCs appear to be intricately linked to key developmental processes, which could have significant implications during early life stages and potentially influence adult physiology. Previous research demonstrated that metabolic deficits can adversely affect embryo development [Citation50], and differences in the productivity of cows born to nonlactating versus lactating cows have been observed [Citation7] with NL producing more during longer lifetime. This suggests that variations in the methylation profiles of calves gestated by primiparous and multiparous cows may directly influence gene expression during embryogenesis. Identifying and modulating these stressors could be crucial for optimizing gestation conditions and ensuring proper embryonic development, but determination of the effects of this hypo/hypermethylation on gene expression needs to be determine first to act accordingly. By understanding and potentially correcting these epigenetic modifications, we can aim to secure the expected gene expression patterns, ultimately improving developmental outcomes and the productive life of the offspring.
One key novelty in our study was the use of a comethylation network that allowed us to identify key clusters reflecting the 3-way dynamics of methylation status, enriched biological process, and phenotype. Despite the limited sample size, which does not provide large statistical power and where large correlations are likely to appear by chance, the information theory approach embedded in the PCIT algorithm resulted in 4.01% of the 4,516,515 correlations being deemed significant. Importantly, the enriched network genes were associated with different developmental processes. This finding aligns with the previously discussed enrichment of the genes associated to the DMCs found between the two groups of animals.
The construction of a network opposed to the use of an Epigenome-wide association study (EWAS) or any other statistical method was based on the small sample size of this study. EWAS, as well as GWAS, needs a large consortium-based approach to reach a large number of individuals to obtain a robust statistical power [Citation51]. Most of available EWAS publication relied on data obtained by Illumina’s arrays, biased for coding and promoter regions [Citation52]. Using a network approach based on the PCIT algorithm poses an alternative to EWAS to characterize genetic networks associated with epigenetic information. Co-methylation networks generate a novel approach of deciphering epigenetic interaction of different genomic regions and productive traits [Citation53].
Furthermore, our comethylation networks allowed us to visualize not only the correlation between methylated regions but also their interaction with traits of interest in animal husbandry, like EBVs or phenotypes or indexes. Networks with the direct neighbours of these traits are a visual guide for understanding whether a methylation marker affects the phenotype positively or negatively. In addition, separating the regions into hypo- or hypermethylated regions provides more information on the mechanism of the interaction. In the networks, the way the methylation is affected by the phenotype differs for each trait. The lactation status of the dam can only unilaterally affect the methylation profile of the gestating calf because the embryo’s methylation profile does not interact with the maternal phenotype. But the maternal uterine maternal phenotype determines the environment in which the embryo is developing. Conversely, for the calf’s genetic values, there could be a two-way interaction since the calf’s phenotype is determined by its genotype, which can be influenced by methylation marks. An increase in the phenotype of either the mother or the calf affects the methylation status of a given region if there is a positive correlation with that trait. For instance, PRG3 appears to be hypermethylated in its promoter region in calves gestated by nonlactating heifers and has a negative correlation with lactation. This means that lactation is associated with a decrease in the methylation frequency of this gene in calves. PRG3 is involved in the activation of granulocytes and the biosynthesis of histamines and has a strong relationship with the inflammatory response in pathological processes [Citation54,Citation55]. If this methylation is not reversed during adulthood, calves gestated by nonlactating heifers might present a greater methylation frequency and thus lower gene expression of this gene than calves gestated by lactating cows. The gene LOC100271685 belongs to the membrane-spanning 4-domain protein subfamily and was hypomethylated in its promoter region in calves gestated by nonlactating heifers. These proteins have been described in humans as being associated with the regulation of calcium influx in B-cell antigen receptors and involved in the signalling of different immune response processes [Citation56]. RHOF was hypomethylated in calves gestated by nonlactating heifers and showed a positive correlation with calf milk EBV. This gene is involved in the amino acid transport and synthesis of proteins in milk and is strongly correlated with milk quality [Citation57,Citation58]. The higher the milk EBV of the calf, the less methylated this gene appeared. A larger breeding value allows for a decreased methylation profile in regions associated with this gene, if happening in the promoter, this event would allow for a higher gene expression in NL calves. The ICAP of calves was positively correlated with the methylation status of the SLC37A3 gene, which is associated with cow fertility and osteogenesis [Citation59]. Calves with a larger ICAP showed more methylation in adjacent regions to this gene, translating into a decreased gene expression and worsened fertility and bone structure. The KLHL1 gene was the only gene that appeared in the three networks and was described as being involved in milk yield and milk quality in dairy cattle [Citation60].
The enrichment analysis of the network revealed a variety of Gene Ontology (GO) terms linked to processes, such as muscular, nervous, and system development. Terms like ‘multicellular organism development,’ ‘system development,’ and ‘anatomical structure development’ highlight the coordination of complex biological systems and anatomical structures in multicellular organisms. Additionally, ‘cytoplasm,’ ‘protein binding,’ and ‘cell junction’ terms suggest underlying cellular and molecular mechanisms. There is a noted emphasis on nervous system development with terms like ‘neurogenesis’ and ‘generation of neurons.’ The importance of intercellular communication and signalling pathways is also highlighted. Lactation imposes metabolic stress on the gestated calves, impacting their methylation profiles during development. According to González et at [Citation7]. these differences impacted the productive life of the calves in their adulthood. Further studies are necessary to determine if these differences persist throughout the animals’ lifetimes or if they dissipate and if they could be linked to the phenotypic differences previously observed.
We found genes associated with each of the studied traits that were also enriched in the differential methylation analysis. ALCAM was hypomethylated in calves gestated by nonlactating heifers, with a negative correlation with the lactation status of the dam. This gene is involved in neural and branching organ development and haematopoiesis [Citation61]. Calves gestated by lactating cows will have an increased methylation status of regions associated with this gene, leading to decreased gene expression and a modification in the expected behaviour of these processes, which is partly explained by the mother’s phenotype. Molecular analysis are necessary to understand the way methylation affects the expression of these genes. Nonetheless, if methylation is associated with gene silencing, NL calves would have a more proper embryo development, as L calves organ development is being impacted by these inhibitions. These comethylation networks also provide insight into how the phenotypes of calves are correlated with their own methylation profiles. The methylation of INHBA was negatively correlated with the EBV for milk so calves with larger milk EBV have lower methylation in CpGs close to this gene. This gene is associated with growth traits and feed efficiency in cattle [Citation62] and is highly expressed in animals with decreased residual feed intake [Citation63], one of the selection objectives in dairy cattle [Citation64]. Calves with a higher EBV will have lower methylation frequency in this genic region, allowing an increased expression of INHBA, and thus an increased growth and better residual feed intake than animals with a lower EBV. We found regions positively correlated with ICAP associated with the gene COL1A2, a gene involved in collagen synthesis that is underexpressed in cows with a high marbling score [Citation65] and in double-muscled animals [Citation66].
Further studies with larger sample sizes are necessary to confirm that methylation marks in blood could be used as biomarkers to detect metabolic stress in calves using their dam phenotypes. The limited sample size of our study reduces its statistical power, indicating that our findings should be validated in a larger population for greater reliability. Consequently, the findings derived from the PCIT algorithm must be interpreted with caution. In order to deal with the limitation of a small sample size, we performed permutation analyses. This study introduces a novel methodology for investigating methylation marks and their associations with phenotypes, rather than aiming to identify new biomarkers. Future research should focus on the functional validation of these epigenetic changes at the phenotypic level. This involves conducting transcriptomic and gene expression studies to confirm the impact of these changes on various traits. Such validation is crucial for understanding the broader implications of our findings and their potential influence on breeding selection schemes. Verifying the effects of these epigenetic modifications would enhance the accuracy of candidate positions, which would allow new strategies to include epigenetic information in breeding programmes, ultimately improving desirable traits in the population. Interpreting these networks becomes challenging when extending beyond the scrutiny of individual genes at the molecular level. The adoption of a quantitative methodology would help to enhance the understanding and application of these findings. Including methylation information in breeding programmes requires new equations and models that need to be developed to account for the effect of potential methylation biomarkers on phenotypes of interest in animal production. Confounding effects also need to be considered. Nutritional factors could be considered in future studies, as the feed rations of heifers and cows are different, which could be a potential confounding factor. The number of lactations could also impact the methylome, even though in our work, all lactating cows were ~4 yrs old and overcame their second lactation.
Conclusions
We demonstrated the presence of both DMCs and DMRs in calves gestated by heifers and lactating cows. The PCIT algorithm enabled the construction of a comethylation network that directly links the calves’ ICAP and milk EBV with their methylome. This comethylation network approach linked the dam’s lactation status with the methylation profile of the calves. Genes with differential methylation in L and NL calves were enriched in the following GO terms: vasculature and blood vessel development, cell and organ morphogenesis and different processes of signalling and cell communication. The methylation profile of regions close to these genes would alter the expected expression of genes associated with growth, embryo development and milk yield. Despite the limited sample size, our results suggest that the foetal and early development of calves is affected by the lactation status of the dam, and this may have important implications at rearing. Further research is necessary to integrate this information into traditional breeding models following a quantitative approach and to determine if the differentially methylated cytosines persist during the adult life of the animals.
List of abbreviations
| 5Mc | = | 5-methylcytosine. |
| DMC | = | Differentially methylated cytosine. |
| DMG | = | Differentially methylated gene. |
| DMR | = | Differentially methylated region. |
| EBV | = | Estimated Breeding Value. |
| EWAS | = | Epigenome-wide association study. |
| FDR | = | False discovery ratio. |
| GO | = | Gene Ontology. |
| ICAP | = | body capacity index. |
| Llr | = | log-likelihood ratio. |
| miRNA | = | microRNA. |
| ncRNA | = | noncoding RNA. |
| ONT | = | Oxford Nanopore Technologies. |
| PCIT | = | Partial correlation and information theory algorithm. |
| piRNA | = | piwi-interacting RNA. |
| siRNA | = | small interference RNA. |
| TF | = | Transcription Factor. |
| TSS | = | Transcription start site. |
| TTS | = | Transcription termination site. |
Authors’ contributions
ALC and LTN base called the data. ALC performed the analyses and wrote the first version of the manuscript. AR, OGR, PAA and LTN supervised the analyses and reviewed and edited the paper. All authors conceived the study and designed the experiments. OGR and AR contributed to the acquisition of funding and resources. All the authors have read and approved the final manuscript.
Availability of data and materials
The datasets generated and/or analysed during the current study are available in the National Center for Biotechnology Information (NCBI) repository under the accession number PRJNA981322.
Competing interests
The authors declare that they have no competing interests.
Ethics approval
The Ethics Committee of the Instituto Nacional de Investigación y Tecnología Agraría y Alimentaria (INIA) waived the need for ethics approval and the need to obtain consent for the collection, analysis and publication of the retrospectively obtained and anonymized data for this noninterventional study with reference CEEA-PH-2021-08. All methods were carried out in accordance with relevant guidelines and regulations from the European Union and were reported in accordance with the ARRIVE guidelines.
-) SupplementaryMaterial.docx
Download MS Word (2.3 MB)Acknowledgments
The authors acknowledge the ideas and help of Juliana Afonso and Laercio R. Porto-Neto during the experimental design of the analyses. A. Lopez-Catalina’s research stay at CSIRO was funded by his predoctoral fellowship from the Instituto Nacional de Investigación y Tecnología Agraria y Alimentaria (FPI-SGIT2018-03). The data were also analysed using the CESGA Supercomputing Infrastructure (Galicia, Spain).
Disclosure statement
No potential conflict of interest was reported by the author(s).
Supplementary material
Supplemental data for this article can be accessed online at https://doi.org/10.1080/15592294.2024.2381856
Additional information
Funding
References
- Bouquet A, Juga J. Integrating genomic selection into dairy cattle breeding programmes: a review. Animal. 2013;7(5):705–18. doi: 10.1017/S1751731112002248
- Schefers JM, Weige KA. Genomic selection in dairy cattle: integration of DNA testing into breeding programs. Anim Front. 2012;2(1):4–9. doi: 10.2527/af.2011-0032
- Hayes BJ, Bowman PJ, Chamberlain AJ, et al. Invited review: genomic selection in dairy cattle: progress and challenges. J Dairy Sci. 2009;92(2):433–443. doi: 10.3168/jds.2008-1646
- González-Recio O. Epigenetics: a new challenge in the post-genomic era of livestock [internet]. Front Genet Front. 2012 Jan;2:2012 p. 106. Available from: http://journal.frontiersin.org/article/10.3389/fgene.2011.00106/abstract
- Jensen P. Behaviour epigenetics – the connection between environment, stress and welfare. Appl Anim Behaviour Sci. 2014;157:1–7. doi: 10.1016/j.applanim.2014.02.009
- Hunter RG. Epigenetic effects of stress and corticosteroids in the brain. Front Cell Neurosci. 2012;6:1–20. doi: 10.3389/fncel.2012.00018
- González-Recio O, Ugarte E, Bach A, et al. Trans-generational effect of maternal lactation during pregnancy: a holstein cow Model. PLOS ONE. 2012;7(12):e51816. doi: 10.1371/journal.pone.0051816
- Tremblay R, Dufort I, Sirard MA. Metabolic stress induces modifications in the epigenetic program of preimplantation bovine embryos. Mol Reprod Dev. 2018;85(2):117–127. doi: 10.1002/mrd.22941
- Ospelt C. A brief history of epigenetics. Immunol Lett. 2022;249:1–4. doi: 10.1016/j.imlet.2022.08.001
- Miranda TB, Jones PA. DNA methylation: the nuts and bolts of repression. J Cell Physiol. 2007;213(2):384–390. doi: 10.1002/jcp.21224
- Jjingo D, Conley AB, Yi SV, et al. On the presence and role of human gene-body DNA methylation. Oncotarget. 2012;3:462–474. doi: 10.18632/oncotarget.497
- Curradi M, Izzo A, Badaracco G, et al. Molecular mechanisms of gene silencing mediated by DNA methylation. Mol Cell Biol. 2002;22(9):3157–3173. doi: 10.1128/MCB.22.9.3157-3173.2002
- Kelsey G, Feil R. New insights into establishment and maintenance of DNA methylation imprints in mammals. Phil Trans R Soc B [Internet]. 2013 [cited 2023 Feb 17];368(1609):20110336. Available from: https://royalsocietypublishing.org/doi/10.1098/rstb.2011.0336
- Muyle AM, Seymour DK, Lv Y, et al. Gene body methylation in plants: mechanisms, functions, and important implications for understanding evolutionary processes. Genome Biol Evol [Internet]. 2022 [cited 2023 Feb 17];(4). Available from: https://academic.oup.com/gbe/article/14/4/evac038/6550137
- Zilberman D. An evolutionary case for functional gene body methylation in plants and animals. Genome Biol. 2017;18(1):1–3. doi: 10.1186/s13059-017-1230-2
- Rodriguez-Osorio N, Dogan S, Memili E. Epigenetics of mammalian gamete and embryo development. In: Livestock Epigenetics [Internet]. John Wiley & Sons, Ltd; 2012 [cited 2024 May 8]. p. 3–25. Available from https://onlinelibrary.wiley.com/doi/10.1002/9781119949930.ch1
- Brosnan CA, Voinnet O. The long and the short of noncoding RNAs. Curr Opin Cell Biol. 2009;21(3):416–425. doi: 10.1016/j.ceb.2009.04.001
- Ng K, Pullirsch D, Leeb M, et al. Xist and the order of silencing. EMBO Rep. 2007;8(1):34–39. doi: 10.1038/sj.embor.7400871
- Iwasaki YW, Siomi MC, Siomi H. PIWI-Interacting RNA: its biogenesis and functions. Annu Rev Biochem. 2015;84(1):405–433. doi: 10.1146/annurev-biochem-060614-034258
- Ball MP, Li JB, Gao Y, et al. Targeted and genome-scale strategies reveal gene-body methylation signatures in human cells. Nat Biotechnol. 2009;27(4):361–368. doi: 10.1038/nbt.1533
- Rauch TA, Wu X, Zhong X, et al. A human B cell methylome at 100−base pair resolution. Proc Natl Acad Sci USA. 2009;106:671–678. doi: 10.1073/pnas.0812399106
- Mccarthy MI, Hirschhorn JN. Genome-wide association studies: potential next steps on a genetic journey. Available from: https://academic.oup.com/hmg/article/17/R2/R156/2527230
- Deamer D, Akeson M, Branton D. Three decades of nanopore sequencing. Nat Biotechnol. 2016;34(5):518–524. doi: 10.1038/nbt.3423
- Simpson JT, Workman RE, Zuzarte PC, et al. Detecting DNA cytosine methylation using nanopore sequencing. Nat Methods. 2017;14(4):407–410. doi: 10.1038/nmeth.4184
- Reverter A, Chan EKF. Combining partial correlation and an information theory approach to the reversed engineering of gene co-expression networks. Bioinformatics. 2008;24(21):2491–2497. doi: 10.1093/bioinformatics/btn482
- Guppy basecaller software [Internet]. [cited 2023 Feb 17]. Available from: https://community.nanoporetech.com/docs/prepare/library_prep_protocols/Guppy-protocol/v/gpb_2003_v1_revao_14dec2018/linux-guppy
- De Coster W, D’Hert S, Schultz DT, et al. NanoPack: visualizing and processing long-read sequencing data. Bioinformatics. 2018;34(15):2666–2669. doi: 10.1093/bioinformatics/bty149
- Li H, Birol I. Minimap2: pairwise alignment for nucleotide sequences. Bioinformatics. 2018;34(18):3094–3100. doi: 10.1093/bioinformatics/bty191
- Li H, Handsaker B, Wysoker A, et al. The sequence Alignment/Map format and SAMtools. Bioinformatics. 2009;25(16):2078. doi: 10.1093/bioinformatics/btp352
- Gamaarachchi H, Lam CW, Jayatilaka G, et al. GPU accelerated adaptive banded event alignment for rapid comparative nanopore signal analysis. BMC Bioinformatics. 2020;21(1):1–13. doi: 10.1186/s12859-020-03697-x
- Akalin A, Kormaksson M, Li S, et al. MethylKit: a comprehensive R package for the analysis of genome-wide DNA methylation profiles. Genome Biol. 2012;13(10):1–9. doi: 10.1186/gb-2012-13-10-r87
- R Core Team. R: a language and environment for statistical computing. [Internet]. 2021 [cited 2021 Nov 15]. Available from: https://www.R-project.org/
- Park Y, Wu H. Differential methylation analysis for BS-seq data under general experimental design. Bioinformatics. 2016;32(10):1446–1453. doi: 10.1093/bioinformatics/btw026
- Porto-Neto LR, Kijas JW, Reverter A. The extent of linkage disequilibrium in beef cattle breeds using high-density SNP genotypes. Genet Sel Evol. 2014;46(1):1–5. doi: 10.1186/1297-9686-46-22
- Yu G, Wang LG, He QY. ChIPseeker: an R/Bioconductor package for ChIP peak annotation, comparison and visualization. Bioinformatics. 2015;31(14):2382–2383. doi: 10.1093/bioinformatics/btv145
- Carlson M. Org.Bt.eg.db: Genome Wide Annotation For Bovine. R Package Version 3.8.2 [Internet]. 2019 [cited 2023 Mar 7]. Available from: https://bioconductor.org/packages/release/data/annotation/html/org.Bt.eg.db.html
- Wu T, Hu E, Xu S, et al. clusterProfiler 4.0: a universal enrichment tool for interpreting omics data. The Innov. 2021;2(3):100141. doi: 10.1016/j.xinn.2021.100141
- Raudvere U, Kolberg L, Kuzmin I, et al. g: Profiler: a web server for functional enrichment analysis and conversions of gene lists (2019 update). Nucleic Acids Res. 2019;47:W191–8. doi: 10.1093/nar/gkz369
- Snajder R, Leger A, Stegle O, et al. pycoMeth: a toolbox for differential methylation testing from nanopore methylation calls. Genome Biol. 2023;24:83. doi: 10.1186/s13059-023-02917-w
- Shannon P, Markiel A, Ozier O, et al. Cytoscape: a software environment for integrated models of biomolecular interaction networks. Genome Res. 2003;13(11):2498–2504. doi: 10.1101/gr.1239303
- Mao Y, Huang P, Wang Y, et al. Genome-wide methylation and expression analyses reveal the epigenetic landscape of immune-related diseases for tobacco smoking. Clin Epigenetics. 2021;13(1):1–14. doi: 10.1186/s13148-021-01208-0
- Bell CG, Teschendorff AE, Rakyan VK, et al. Genome-wide DNA methylation analysis for diabetic nephropathy in type 1 diabetes mellitus. BMC Med Genomics. 2010;3(1):1–11. doi: 10.1186/1755-8794-3-33
- Liu S, Tengstedt ANB, Jacobsen MW, et al. Genome-wide methylation in the panmictic European eel (Anguilla anguilla). Mol Ecol. 2022;31(16):4286–4306. doi: 10.1111/mec.16586
- Zemach A, Ie M, Silva P, et al. Genome-wide evolutionary analysis of eukaryotic DNA methylation. Science. 2010;328(5980):916–919. doi: 10.1126/science.1186366
- Greenberg MVC, Bourc’his D. The diverse roles of DNA methylation in mammalian development and disease. Nat Rev Mol Cell Biol. 2019;20(10):590–607. doi: 10.1038/s41580-019-0159-6
- Bender CM, Gonzalgo ML, Gonzales FA, et al. Roles of cell Division and gene transcription in the methylation of CpG islands. Mol Cell Biol. 1999;19(10):6690. doi: 10.1128/MCB.19.10.6690
- Lewis JD, Meehan RR, Henzel WJ, et al. Purification, sequence, and cellular localization of a novel chromosomal protein that binds to methylated DNA. Cell. 1992;69(6):905–914. doi: 10.1016/0092-8674(92)90610-O
- Bach A, Aris A, Guasch I, et al. Consequences of supplying methyl donors during pregnancy on the methylome of the offspring from lactating and non-lactating dairy cattle. PLOS ONE. 2017; Available from 12(12):e0189581. doi: 10.1371/journal.pone.0189581
- Scarpa E, Mayor R. Collective cell migration in development. J Cell Biol. 2016;212(2):143–155. doi: 10.1083/jcb.201508047
- Chaput C, Sirard MA. Embryonic response to high beta-hydroxybutyrate (BHB) levels in postpartum dairy cows. Domest Anim Endocrinol. 2020;72:106431. doi: 10.1016/j.domaniend.2019.106431
- Jm F. Epigenome-wide association studies (EWAS): past, present, and future. In: Verma M, editor. Cancer epigenetics: risk assessment, diagnosis, treatment, and prognosis [internet]. New York (NY): Springer; 2015 [cited 2024 May 16]. p. 51–63. Available from doi: 10.1007/978-1-4939-1804-1_3
- Bultmann S, Stricker SH. Entering the post-epigenomic age: back to epigenetics. Open Biol. 2018;8(3):180013. doi: 10.1098/rsob.180013
- Marina H, Reverter A, Gutiérrez-Gil B, et al. Gene networks driving genetic variation in milk and cheese-making traits of Spanish Assaf Sheep. Genes (Basel). 2020;11(7):715. doi: 10.3390/genes11070715
- Plager DA, Loegering DA, Weiler DA, et al. A novel and highly divergent homolog of human eosinophil granule Major basic Protein*. J Biol Chem. 1999;274(20):14464–14473. doi: 10.1074/jbc.274.20.14464
- Gray AL, Pun N, Ridley AJL, et al. Role of extracellular matrix proteoglycans in immune cell recruitment. Int J Exp Pathol. 2022;103(2):34–43. doi: 10.1111/iep.12428
- Zuccolo J, Bau J, Childs SJ, et al. Phylogenetic analysis of the MS4A and TMEM176 gene families. PLOS ONE. 2010;5(2):e9369. doi: 10.1371/journal.pone.0009369
- Wang X, Zhang L, Jin J, et al. Comparative transcriptome analysis to investigate the potential role of miRNAs in milk protein/fat quality. Sci Rep. 2018;8(1):6250. doi: 10.1038/s41598-018-24727-y
- Dai W, Zou Y, White RR, et al. Transcriptomic profiles of the bovine mammary gland during lactation and the dry period. Funct Integr Genomics. 2018;18(2):125–140. doi: 10.1007/s10142-017-0580-x
- Mohammadi A, Alijani S, Rafat SA, et al. Genome-wide association study and pathway analysis for female fertility traits in Iranian holstein cattle. Ann Of Anim Sci. 2020;20(3):825–851. doi: 10.2478/aoas-2020-0031
- Sun HZ, Plastow G, Guan LL. Invited review: advances and challenges in application of feedomics to improve dairy cow production and health. J Dairy Sci. 2019;102(7):5853–5870. doi: 10.3168/jds.2018-16126
- Swart GWM. Activated leukocyte cell adhesion molecule (CD166/ALCAM): developmental and mechanistic aspects of cell clustering and cell migration. Eur J Cell Biol. 2002;81(6):313–321. doi: 10.1078/0171-9335-00256
- Pierce CF, Speidel SE, Coleman SJ, et al. Genome-wide association studies of beef cow terrain-use traits using Bayesian multiple-SNP regression. Livest Sci. 2020;232:103900. doi: 10.1016/j.livsci.2019.103900
- Chen Y, Gondro C, Quinn K, et al. Global gene expression profiling reveals genes expressed differentially in cattle with high and low residual feed intake. Anim Genet. 2011;42(5):475–490. doi: 10.1111/j.1365-2052.2011.02182.x
- Stephansen RB, Martin P, Manzanilla-Pech CIV, et al. Novel genetic parameters for genetic residual feed intake in dairy cattle using time series data from multiple parities and countries in North America and Europe. J Dairy Sci. 2023;106(12):9078–9094. doi: 10.3168/jds.2023-23330
- Chen D, Li W, Du M, et al. Adipogenesis, fibrogenesis and myogenesis related gene expression in longissimus muscle of high and low marbling beef cattle. Livest Sci. 2019;229:188–193. doi: 10.1016/j.livsci.2019.09.032
- Zhang Y-Y, Zan L-S, Wang H-B, et al. Differentially expressed genes in skeletal muscle tissues from castrated Qinchuan cattle males compared with those from intact males. Livest Sci. 2011;135(1):76–83. doi: 10.1016/j.livsci.2010.06.070