
Abstract
Dynamic reorganization of photosystems I and II is suggested to occur in chloroplast thylakoid membranes to maintain the efficiency of photosynthesis under fluctuating light conditions. To directly observe the process in action, live-cell imaging techniques are necessary. Using live-cell imaging, we have shown that the fine thylakoid structures in the moss Physcomitrella patens are flexible in time. However, the spatiotemporal resolution of a conventional confocal microscopy limits more precise visualization of entire thylakoid structures and understanding of the structural dynamics. Here, we discuss the issues related to observing chlorophyll fluorescence at multiple spatiotemporal scales in vivo and in vitro.
Light energy excites chlorophylls (Chls) embedded in light-harvesting complex (LHC) proteins in chloroplast thylakoid membranes. The excited Chls return to the ground state through fluorescence emission, energy transfer to neighboring pigments, charge separation at the reaction center of the two photosystems (PSI and PSII), and non-photochemical quenching.Citation1 To understand what happens inside chloroplasts, the properties and behavior of Chl fluorescence have been studied extensively both in vivo and in vitro. However, considering that we monitor Chl fluorescence at multiple spatiotemporal scales (such as on the order of ps vs. min, of nm vs. μm, or of molecular vs. cellular levels), how is it possible to elucidate what really happens inside a chloroplast?
The peripheral LHC of PSII (LHCII) typically forms a trimer containing 42 Chls.Citation2 LHCII is the most abundant protein in thylakoid membranes of vascular plants and green algae, and single-particle averaging suggests the formation of a variety of protein supercomplexes of LHCII with PSII.Citation3 Each PSII monomer contains 35 Chls.Citation4 PSI usually forms a protein supercomplex with its LHC (LHCI), with 173 Chls in the supercomplex.Citation5 Results of fractionation using differential centrifugation indicate lateral heterogeneity of PSII and PSI—the former is localized mainly in the stacked, appressed membrane domain, i.e., grana, and the latter is predominantly present in the single-layer, stroma-exposed membrane domain, i.e, stroma lamellae.Citation6 Recent cryo-electron tomography has revealed the 3-dimensional (3D) structure of thylakoid membranes, showing a helical configuration with a distinctive junctions between grana and stroma lamellae.Citation7 Thus, there are a variety of protein complexes and supercomplexes containing different numbers of Chl molecules in the complicated structures and arrangements of thylakoid membranes inside a chloroplast.
In our previous study, we visualized thylakoid structures in live protonema cells of the moss Physcomitrella patens by observing Chl fluorescence using conventional confocal laser scanning microscopy in combination with 3D deconvolution.Citation8 illustrates the spatiotemporal scale for Chl fluorescence observation using conventional confocal microscopy. Considering that it takes 1.61 μs to obtain the information in one pixel (0.14 × 0.14 μm; ), excitation energy transfer among all proteins in that pixel can easily occur within the time scale of image acquisition.Citation9 In addition, the acquisition time for one plane is about 800 ms, which is enough time for charge separation at PSII following electron transfer to influence the redox conditions of the PQ pool in thylakoid membranesCitation10 (). To reconstruct 3D live images, the acquisition time needs to be as short as possible. As an example (), the acquisition time for one 3D image is about 4.3 s when recording 5 different planes seque9tially. Thus, the reconstructed 3D image contains information from 5 planes with different time axes on the order of a second (). In this case, the change in fluorescence intensity during acquisition would generate loss and/or gain of observed structures that might cause artifactual structures in the reconstructed 3D images. To evaluate such potential effects in the reconstructed 3D image, we performed the following 2 analyses: a) comparison between the raw images and the reconstructed 3D images; and b) mathematical correction of the difference in time axis between each planeCitation8 (). The latter analysis is based on the assumption that the changes in the fluorescence intensity and the direction of movement are not random.
Figure 1. An example observation condition using conventional confocal laser scanning microscopy according to our previous study.Citation8 (A) Pixel size and time required to measure fluorescence intensity. (B) Plane size and the time required to measure fluorescence intensity. (C) Z-steps and the total time required to measure a 3D image. (D) Time required to move back to the initial position to start measuring the next 3D image. (E) An image of chloroplasts in P. patens protonema cell. Because of the unique characteristics of Chl fluorescence, we need to understand the relationships between events in each spatiotemporal scale. The schematic drawing of observation conditions is reproduced with permission.Citation24
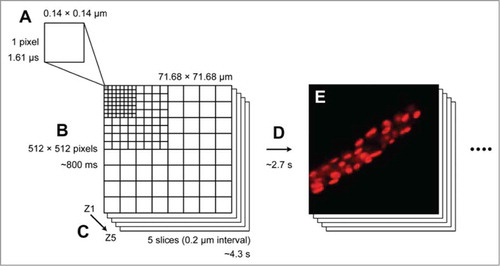
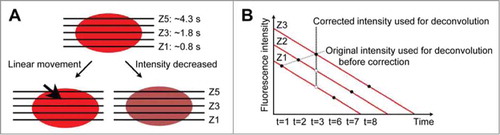
Figure 2. A schematic drawing of the mathematical correction of time axes between different z-planes. (A) An object emits Chl fluorescence, and images of different z-planes were acquired sequentially from Z1 to Z5. During the observation, the object might move to different position, or the fluorescence intensity might increase/decrease. Such changes would cause a change in fluorescence intensity during the time required to capture a 3D image. (B) Assuming that the change in fluorescence intensity is not random (in this case, a decreasing signal is shown as an example), the observed fluorescence intensity at each z-plane reflects the intensity of different time axes (closed dots at different time points). Based on this assumption, we could mathematically adjust the fluorescence intensity at each z-plane to the one at the same time axis (open dots at the same time point). By performing 3D deconvolution analysis with the corrected intensity, we could eliminate a possible artifactual observation of thylakoid structures. Please refer to Supplementary Information of our previous study for the details of the mathematical correction.Citation8
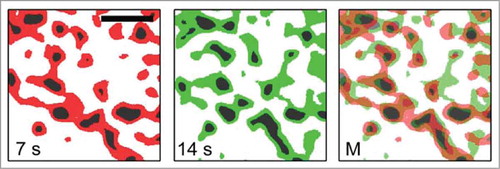
Under the microscopy conditions shown in , 3D images were acquired sequentially, with about 7-s intervals between each 3D image. The 3D time-lapse imaging could differentiate objects or structures as mobile or immobile. In general, the degree of mobility observed depends upon the spatiotemporal scale of the particular method of observation used for the object or phenomenon of interest. Under our microscopy conditions, any objects or structures that showed similar characteristics in sequential images could be considered structurally immobile, at least over 7-s intervals. Based on their shape and size, we characterized the immobile structures as granaCitation8 (). We found that grana were structurally stable, but they also showed variability in shape because of the fluidity of biological lipid bilayers. In addition, we observed distinct thread-like structures that appeared to be interconnected between the grana, which we propose to be stroma lamellaeCitation8 (). Interestingly, the location of (or fluorescence intensity that represented) stroma lamellae was not stable during the 7-s interval relative to that of grana. Thus, stroma lamellae could be considered generally as structurally mobile, at least at the spatiotemporal scale used in these observations.
Figure 3. Structural modification of thylakoid structures observed using conventional confocal microscopy. The time required to observe a 3D image was about 7 s as described in . The subsequent 3D observation at 14 s showed changes in the position and intensity of Chl fluorescence. The area in black represents grana. The area shown in red or green represents stroma lamellae. The merged image is also shown to compare the differences arising during the 7 s interval. Scale bar, 2 μm. The figure is reproduced with permission.Citation8
To understand what underlies the apparent mobility of these stroma lamellae, we need to consider the behavior of proteins or phenomenon that could occur in the structures at the different spatiotemporal scales. At the molecular level, the observed changes in fluorescence intensity in each pixel could be due to the change in energy transfer efficiency. It is generally accepted that the contribution to Chl fluorescence of emission from PSI is very low at room temperature;Citation11 instead, the rate of charge separation at PSI might affect the change in observed Chl fluorescence. At the diffraction-limited scale (i.e., ∼0.2 μm), thylakoid membrane proteins move with diffusion coefficients from ∼0.9 to ∼2.1 μm−2 s−1, as we previously measured using fluorescence correlation spectroscopy (FCS), which resolves single-molecule level protein diffusion.Citation12 The rate of protein diffusion observed with FCS represents high mobility, but that could be limited to within a narrow space because membrane proteins are highly crowded in thylakoid membranes.Citation13 However, such high local protein diffusion could easily affect the rate of energy transfer due to the association and dissociation of protein supercomplexes. In the case of the stroma lamellae, protein interaction between LHCII and PSI is suggested to occur during state transitions,Citation14-Citation16 which would change the observed Chl fluorescence. In addition, it is possible that the illumination during microscopy induced non-photochemical quenching that involves protein reorganization.Citation17 Thus, the observed dynamics of stroma lamellae could be due to changes in fluorescence lifetime caused by protein interactions at the molecular level.
At the structural level, thylakoid membrane proteins are not generally considered to be as highly mobile as observed in fluorescence recovery after photobleaching measurementsCitation18 because this technique is not sensitive enough to track the single-molecule level of protein diffusion, especially when measuring Chl fluorescence that generates too much difference in fluorescence intensity after photobleaching to detect low fluorescence signals during highly mobile single-molecule diffusion.Citation19,20 In addition, because thylakoid membranes are crowded with membrane proteins, the rate of protein diffusion observed at the structural level should be very low. This means that the observed dynamics at the structural level could represent the structure itself more than the behavior of proteins. Therefore, the observed dynamics of stroma lamellae could represent the structural dynamics of stroma lamella itself. Moreover, because the time resolution under these microscopy conditions is not high enough to track the membrane dynamics (which occur on the order of milliseconds),Citation21 we cannot exclude the possibility that the observed dynamics of stroma lamellae reflect the fission and fusion of thylakoid membranes as previously proposed.Citation22
Chl fluorescence has been extensively studied at multiple spatiotemporal scales. Because of its spectroscopic properties and its abundance within chloroplasts, the behavioral aspects of Chl fluorescence can appear different at different spatiotemporal scales—i.e., it is hard to describe a common mechanism for the structural dynamics observed in a chloroplast by live-cell imaging, the fluorescence kinetics observed in plant tissues by PAM fluorometry, and the spectral dynamics observed in purified proteins by time-resolved spectroscopy. In principle, these data should lead us to a common explanation for what really happens inside a chloroplast. It is thus essential to interrelate the results and observations obtained from each spatiotemporal scale. Live-cell imaging is one way to generate a common model, but much advancement is still needed to visualize the details of events inside a chloroplast, and we have accordingly undertaken the next-level approach of super-resolution confocal microscopy.Citation23
Disclosure of Potential Conflicts of Interest
No potential conflicts of interest were disclosed.
Acknowledgments
M.I. designed the study, performed experiments, analyzed the data, and wrote the paper; M.Y. performed the mathematical correction and analyzed data; and A.N. supervised the study.
Funding
This work was supported by JST PRESTO, JSPS KAKENHI Grant Number 21870047, and grants from the RIKEN Center for Advanced Photonics, Extreme Photonics Research Project.
Related Research Data
References
- Krause GH, WeisE. Chlorophyll fluorescence and photosynthesis: the basics. Annu Rev Plant Physiol Plant Mol Biol 1991; 42:313-49; http://dx.doi.org/10.1146/annurev.pp.42.060191.001525
- Standfuss J, Terwisscha van Scheltinga AC, Lamborghini M, Kuhlbrandt W. Mechanisms of photoprotection and nonphotochemical quenching in pea light-harvesting complex at 2.5 A resolution. EMBO J 2005; 24:919-28; PMID:15719016; http://dx.doi.org/10.1038/sj.emboj.7600585
- Dekker JP, Boekema EJ. Supramolecular organization of thylakoid membrane proteins in green plants. Biochim Biophys Acta 2005; 1706:12-39; PMID:15620363; http://dx.doi.org/10.1016/j.bbabio.2004.09.009
- Umena Y, Kawakami K, Shen JR, Kamiya N. Crystal structure of oxygen-evolving photosystem II at a resolution of 1.9 A. Nature 2011; 473:55-60; PMID:21499260; http://dx.doi.org/10.1038/nature09913
- Amunts A, Toporik H, Borovikova A, Nelson N. Structure determination and improved model of plant photosystem I. J Biol Chem 2010; 285:3478-86; PMID:19923216; http://dx.doi.org/10.1074/jbc.M109.072645
- Andersson B, Anderson JM. Lateral heterogeneity in the distribution of chlorophyll-protein complexes of the thylakoid membranes of spinach chloroplasts. Biochim Biophys Acta 1980; 593:427-40; PMID:7236643; http://dx.doi.org/10.1016/0005-2728(80)90078-X
- Austin JR 2nd, Staehelin LA. Three-dimensional architecture of grana and stroma thylakoids of higher plants as determined by electron tomography. Plant Physiol (2011); 155, 1601-1611; PMID:21224341; http://dx.doi.org/10.1104/pp.110.170647
- Iwai M, Yokono M, Nakano A. Visualizing structural dynamics of thylakoid membranes. Sci Rep 2014; 4:3768; PMID: 24442007; http://dx.doi.org/10.1038/srep03768
- Mimuro M. et al. Excitation energy flow in chlorosome antennas of green photosynthetic bacteria. J Phys Chem 1989; 93:7503-9; http://dx.doi.org/10.1021/j100358a047
- Strasser RJ, Srivastava A,Govindjee . Polyphasic chlorophyll-alpha fluorescence transient in plants and cyanobacteria. Photochem Photobiol 1995; 61:32-42; http://dx.doi.org/10.1111/j.1751-1097.1995.tb09240.x
- Wendler J, Holzwarth AR. State transitions in the green alga Scenedesmus obliquus probed by time-resolved chlorophyll fluorescence spectroscopy and global data analysis. Biophys J 1987; 52:717-28; PMID:19431709; http://dx.doi.org/10.1016/S0006-3495(87)83266-6
- Iwai M, Pack CG, Takenaka Y, Sako Y, Nakano A. Photosystem II antenna phosphorylation-dependent protein diffusion determined by fluorescence correlation spectroscopy. Sci Rep 2013; 3:2833; PMID:24088948; http://dx.doi.org/10.1038/srep02833
- Kirchhoff H. Significance of protein crowding, order and mobility for photosynthetic membrane functions. Biochem Soc Trans 2008; 36:967-70; PMID:18793171; http://dx.doi.org/10.1042/BST0360967
- Allen JF, Forsberg J. Molecular recognition in thylakoid structure and function. Trends Plant Sci 2001; 6:317-26; PMID:11435171; http://dx.doi.org/10.1016/S1360-1385(01)02010-6
- Wollman FA. State transitions reveal the dynamics and flexibility of the photosynthetic apparatus. EMBO J 2001; 20:3623-30; PMID:11447103; http://dx.doi.org/10.1093/emboj/20.14.3623
- Minagawa J. State transitions—the molecular remodeling of photosynthetic supercomplexes that controls energy flow in the chloroplast. Biochim. Biophys. Acta 2011; 1807:897-905; PMID:21108925; http://dx.doi.org/10.1016/j.bbabio.2010.11.005
- Johnson MP. Goral TK, Duffy CD, Brain AP, Mullineaux CW, Ruban AV. Photoprotective energy dissipation involves the reorganization of photosystem II light-harvesting complexes in the grana membranes of spinach chloroplasts. Plant Cell 2011; 23:1468-79; PMID:21498680; http://dx.doi.org/10.1105/tpc.110.081646
- Goral TK. Johnson MP, Brain AP, Kirchhoff H, Ruban AV, Mullineaux CW. Visualizing the mobility and distribution of chlorophyll proteins in higher plant thylakoid membranes: effects of photoinhibition and protein phosphorylation. Plant J 2010; 62:948-59; PMID:20230505
- Feder TJ, Brust-Mascher I, Slattery JP, Baird B, Webb WW. Constrained diffusion or immobile fraction on cell surfaces: a new interpretation. Biophys J 1996; 70:2767-73; PMID:8744314; http://dx.doi.org/10.1016/S0006-3495(96)79846-6
- Verkman AS. Solute and macromolecule diffusion in cellular aqueous compartments. Trends Biochem Sci 2002; 27:27-33; PMID:11796221; http://dx.doi.org/10.1016/S0968-0004(01)02003-5
- Cevc G, Richardsen H. Lipid vesicles and membrane fusion. Advd Drug Deliver Rev 1999; 38:207-32; http://dx.doi.org/10.1016/S0169-409X(99)00030-7
- Chuartzman SG, Nevo R, Shimoni E, Charuvi D, Kiss V, Ohad I, Brumfeld V, Reich Z. Thylakoid membrane remodeling during state transitions in Arabidopsis. Plant Cell 2008; 20:1029-39; PMID:18398051; http://dx.doi.org/10.1105/tpc.107.055830
- Kurokawa K, Ishii M, Suda Y, Ichihara A, Nakano A. Live cell visualization of Golgi membrane dynamics by super-resolution confocal live imaging microscopy. Methods Cell Biol 2013; 118:235-42; PMID:24295310; http://dx.doi.org/10.1016/B978-0-12-417164-0.00014-8
- Iwai M. Imaging chlorophyll fluorescence at multiple spatiotemporal scales. News Lett Jap Soc Photosynth Res 2013; 23:118-24;