
 ?Mathematical formulae have been encoded as MathML and are displayed in this HTML version using MathJax in order to improve their display. Uncheck the box to turn MathJax off. This feature requires Javascript. Click on a formula to zoom.
ABSTRACT
Nutritional rich pigeonpea (Cajanus cajan [L.]), a perennial shrub member of family Fabaceae is the sixth most important grain legume of the world. Continuous rise of temperature and current global climate scenario limits plant growth and performance but photosynthetic machineries are adversely affected. The aim of this study was the analysis of tissue specific photosynthetic pigments and photosynthetic electron transport rate under elevated temperature. Two different stages of both leaf (young and mature), and pod (young and mature) were chosen, and photosynthetic pigment and J-I-P tests were measured. Leaves and pods were detached and incubated in normal temperature (25°C) for 24 h in two different condition one light irradiance (100 µmol m−2 s−1) and another darkness as control, and treated with high temperature 45°C for 24 h and repeated previous measurements were taken. Tissue specific photosynthetic pigments variation were observed; J-I-P parameters clearly revealed that elevated temperature has greater influence on photosystem II (PSII) electron transport than photosystem I (PSI), and significant changes were observed in pods than leaves. Young tissues were adversely affected by elevated temperature. In addition, the J-I-P tests and energy pipeline model indicated that PSI electron transport rate of leaves and pods appeared to be more thermo-tolerance than those in PSII. Only a minor drop in pigments pool and photosynthetic performance was observed after 24 h of darkness. O-J-I-P transients can be used as a sensitive, nondestructive method for measuring heat stress damage and a special tool for investigating action sites of high temperature stress. Findings of this study will contribute to basic understanding of photosynthetic performance, and to screen potential thermo-tolerant genotypes of pigeonpea to sustain in either current scenario of climate change or/and erratic future climatic conditions.
1. Introduction
Pigeonpea (Cajanus cajan [L.] Millspaugh), a perennial shrub member of family Fabaceae is the sixth most important grain legume of the world.Citation1 Origin of Centre of pigeonpea is India,Citation2 from where it is believed to have distributed to other tropical and subtropical counties and in Africa continents before 2000 BC.Citation3 In pacific region especially in Fiji it was introduced by the indentured Indian labourers in the 1880s to make dhal soup and for green vegetables, and grown in dry zone where less precipitation was recorded.Citation4
Table 1. Definition of energy fluxes and fluorescence transients parameters were used in the OJIP-test. These parameters are used to analyse the ‘fast’ (<1 s) chlorophyll a fluorescence transient.Citation41
Nutritional rich pigeonpea seeds contain high proteins (18.8%), starch (53%), fats (2.3%), crude fibres (6.6%) and minerals (250 mg/100g).Citation5 Current global scenario of climate change shows continuous increase of temperature; hence crops growing in different agro-ecological regions would be more often exposed to heat stress conditions. The reproductive stage of crop is more sensitive to high temperature, 1°C increase in maximum temperature would reduce pigeonpea yield by 20.8%, and 1°C rise in minimum temperature suggests a 4% loss in yield.Citation6 High temperature limits plant growth and performance but photosynthetic apparatus is adversely affected because photosystems are often inhibited before other cells are impaired.Citation7 Oxygenic photosynthesis converts light energy absorbed from sun to chemical energy using two different photosystems (PSII and PSI) and carbon fixing enzymes.Citation8 Furthermore light energy absorbed by photosynthetic pigments i.e. chlorophyll a, and chlorophyll b has two fates (1) light loss by internal conversion as heat and (2) as fluorescence or light emission. Carotenoids are another group of photosynthetic pigment, composed by carotene and xanthophyll and play a key role in photosynthesis. Being essential part of antenna, carotenoids harvest light energy from sun to produce photosynthates.Citation9,Citation10 Apart from photosynthesis carotenoids play an essential role in protection of reaction centres of photosystems by dissipating of excess light energy. In addition, carotenoids are also involved in tolerance mechanism against oxidative stress caused by different abiotic factors.Citation11,Citation12 Elevated temperature alters two major metabolic activities viz., photosynthesis and respiration, which shorten life span, and leads to reduction in production and productivity of crops.Citation13 Depletion of photosynthesis during elevated temperature limits availability of energy required for induction of reproductive structures and gamete formation.Citation14 Photosynthetic apparatus is the most sensitive component to evaluate degree of damage in elevated temperature.Citation15 Chlorophyll a fluorescence has been used as highly sensitive signature of photosynthesis,Citation16 provides authentic information of relationship of structure and function of photosynthetic apparatus.Citation17 Exposure of light leads to rise in chlorophyll a fluorescence that is polyphasic, plotting a fluorescence transient as function of logarithmic time provides information to identify many fluorescence levels in terms of O-J-I-P.Citation18 Different O-J-I-P levels of chlorophyll fluorescence is based on ‘Theory of Energy Fluxes of Biomembrane’, it has been used as a proxy to analyse photosynthetic machineries under several abiotic stresses. In high temperature O-J-I-P transients are highly sensitive.Citation19–Citation21 Nomenclature as O-J-I-P of specific points in induction curve is termed by recorded chlorophyll a fluorescence signals. Here ‘O’ is for origin (minimal fluorescence Fo), J and I for two different inflections (Fj and Fi) and ‘P’ for peak (maximum fluorescence Fp or Fm).Citation22,Citation23 In O-J-I-P transients OJ part of curve corresponds to gradual reduction of primary electron acceptor quinone (QA) of PSII, JI region represents to the reduction of secondary electron acceptors i.e. quinone (QB), plastoquinone (PQ), cytochrome (Cyt b6f), and plastocynin (PC), and IP part typically attributes to reduction of electron transporters of PSI ferredoxin (fd), intermediate acceptors and NADP.Citation24 Elevated temperature inhibits water splitting site/oxygen evolving complex (OEC) and block the electron movement from OEC to tyrosine.Citation25 In such situation an additional K level peak observed in O-J-I-P curve at 200 to 350 µs that shows a disruption in water splitting/OEC site.Citation26 Therefore, O-J-I-P transients are used as a specific tool for phenotyping and plant performance, with determination of structural and functional relationship of photosynthetic apparatus.Citation27–Citation31 The idea behind this study was to observe the transients of chlorophyll a fluorescence at short interval from 10 µs to 1 s to evaluate PSII efficiency and electron movement in electron transport chain of oxidative photosynthesis. Thus, within short time periods, it is easy to evaluate photosynthetic performance under variable climatic conditions.Citation27 Many findings based on OJIP transients in leaf under elevated temperature have been publishedCitation32–Citation34 but in fruits these O-J-I-P parameters are limited to apple and tomato.Citation30,Citation35,Citation36 The O-J-I-P transients revealed that tolerance of PSII to elevated temperature was greater in leaf than the fruits of apple.Citation35,Citation36 Chlorophyll a fluorescence O-J-I-P parameters were used to assess PSII activities of tomato leaf and fruits against both high and low temperature stress and changes were greater in fruits than in the leaf.Citation30 Pigeonpea pods are photosynthetically active, because of green, chlorophyll and other photosynthetic pigments present from immature stage until ripening. Furthermore, photosynthetic activities are different between leaves and pods. However to our knowledge the effect of heat on photosynthetic apparatus of leaf and pods of pigeon pea and their differences have not been elucidated. Therefore it is highly crucial to study the photosynthetic performance of pigeon pea in the current and future erratic and unpredicted climatic conditions particularly elevated temperature. The aim of this study was to determine photosynthetic efficiency and investigate whether O-J-I-P parameters can be used as reliable indictors of elevated temperature in pigeon pea leaves and pods.
2. Materials and methods
2.1 Plant materials
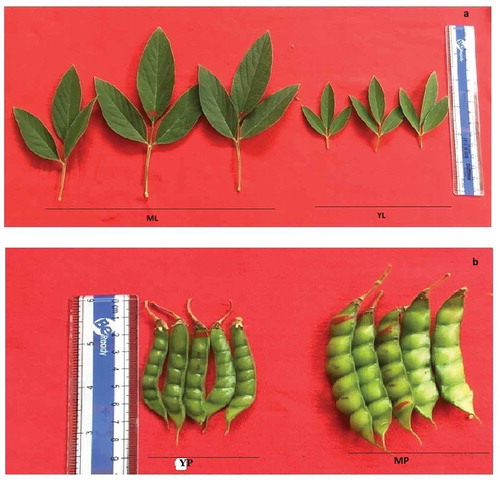
Pigeon pea seeds were grown at Natabua, Fiji Islands at latitude 17°38ʹ35.8ʺS, 177°25ʹ53.31ʺE and of elevated altitude of 672 ft from mean sea level, with agronomical packages and practices. Measurements were recorded after anthesis and pod formation. Two different stages of leaf (young and mature) and pod (young and mature) were selected for observations ().
Figure 1. Experimental pigeonpea samples two leaf stages YL (young leaves) and ML (mature leaves) (a), and two different stages of pod YP (young pods) and MP (mature pods) (b) were used for study.
2.2. Normal and elevated temperature treatment
Different stages of both leaves and pods were detached from plant, wrapped with wet paper towel and incubated at normal (25°C) and elevated temperature (45°C) for 24 h in both light irradiance (100 µmol m−2 s−1) and darkness in an incubator (SPX-150B BOD incubator). Each experiment was carried out in three replication (n = 10).
2.3 Chlorophyll determination
Different stages of both leaves and pods were used for chlorophyll estimation. Chlorophyll was extracted with 80% acetone and the extracts were analysed with UV-visible spectrophotometer (BIOMATE-3S Thermo-scientific) and recorded the absorbance of the chlorophyll extract in 100 mL aliquot with a spectrophotometer set at 645 and 663 nm. Acetone (80%) solvent was used as a blank. The amount of chlorophyll present in the extract was determined according to the following equations as per Arnon.Citation37
where, A = Absorbance of chlorophyll extract at the specific indicated wavelength, V = Final volume of the solution, W = g. of tissue extracted
2.4 Estimation of carotenoid
The amount of carotenoids was estimated according to Kirk and Allen.Citation38 The same chlorophyll extract was measured at 480 nm and determined the carotenoids content using following equation
where, A = Absorbance at respective wave length.
2.5 Measurement of O-J-I-P transients
Chlorophyll a fluorescence transients (O-J-I-P) were measured by Plant Efficiency Analyzer (PEA, Hansatech UK). Detached leaves and pods were kept at normal (25°C) and elevated temperature (45°C) for 24 h in both light irradiance (100 µmol m−2 s−1) and darkness in incubator. Treated leaves and pods were examined for O-J-I-P transients. The clips were placed on different stages of both the leaves and pods for 20 min prior to the measurements to provide dark adaptation. After that, samples were illuminated with continuous red light (wavelength in peak 650 nm, spectral line half-width 22 nm). The light was provided by an array of three light-emitting diodes. The light pulse intensity used was 3500 µmol m−2 s−1 and the duration of the light pulse was 1 s. The fluorescence signal was recorded with a maximum frequency of 105 points s−1 (each 10 µs) within 0–0.3 ms, after which the frequency of recording gradually decreased collecting a total of 118 points within 1 s.
The measured data were used for the calculation according to the JIP-test equations.Citation27,Citation35,Citation36,Citation39,Citation40 The following fluorescence intensity values from the original measurements were used: minimal intensity at 20 µs, when all PSII reaction centres (RCs) are open (the O step); intensity at 300 µs used for calculation of the initial slope (Mo), defined as the net ratio of RC closure; the intensity at 2 ms (the J step); the intensity at 30 ms (the I step); and the maximal intensity when all PSII RCs are closed (the P step = FM). The biophysical parameters derived from the OJIP transients were calculated, and the following parameters, which refer to time zero (onset of fluorescence induction) were used. (1) Flux ratio of PSII: φP0, the maximum quantum yield of primary photochemistry; ψ0, the probability that a trapped exciton moves an electron into the electron transport chain beyond QA; φE0, the quantum yield of electron transport (2) Flux ratios of PSI: δR0, the efficiency with which an electron can move from the reduced intersystem electron acceptors to the PSI end electron acceptors; φR0, the quantum yield of electron transport from QA to the PSI end electron acceptors (3) Specific energy fluxes per RC; absorption (ABS/RC); electron transport (ET0/RC); trapping (TR0/RC); dissipation (DI0/RC); and reduction of end acceptors at the PSI electron acceptor side (RE0/RC). (4) Phenomenological energy fluxes per excited cross section (CSM, subscript M refer to time FM): absorption (ABS/CSM = FM); electron transport (ET0/CSM); trapping (TR0/CSM); dissipation (DI0/CSM); and density of RCs (RC/CSM). (5) Performance index (PIabs) on an absorption basis and total PI (PItotal) measuring the performance up to the PSI end electron acceptors.Citation30 A description of the used OJIP test parameters is given in .Citation41
2.6 Statistical analysis
The reported data of chlorophyll fluorescence parameters and photosynthetic pigments i.e. chlorophyll a, b, total chlorophylls and total carotenoids content represent the standard error of mean in percentage with 5% value. Statistical analysis was performed using analysis of variance (ANOVA) followed by Tukey HSD test (α = 0.05) and student t-test using MS-Excel 2010.
3 Results
3.1 Photosynthetic pigments
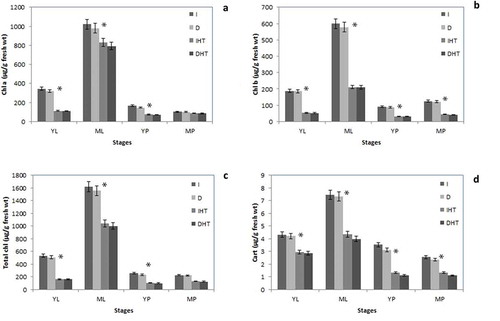
In this study different stages of leaves and pods showed vide variations in chl a, chl b, total chlorophyll and carotenoids (). Level of chl a, b and carotenoids were significantly higher in leaves than those in pods. Mature leaves showed maximum pigments (~3 folds) higher than young leaves. Among different age of young pods 10% higher pigments than in mature pods. After 24 h of darkness only a minor drop (~10%) decreased in cell pigment pool while elevated temperature at 45°C photosynthetic pigments are dramatically declined in both leaves and pods. Significant decline in chlorophyll content after elevated temperature was monitored in young leaves (~60%), mature leaves (40%), young pods (~50%) and mature pods (~30%). About 50%, 45%, 40% and 40% carotenoids concentration was reduced in mature pods, young pods, mature leaves and young leaves, respectively.
Figure 2. Tissue specific photosynthetic pigments of pigeonpea under normal temperature (I, D) and elevated temperature (heat stress) (IHT and DHT): Chlorophyll a (a), chlorophyll b (b), total chlorophyll (c) and carotenoids (d) contents in different stages of leaf and pod. Each value is the mean of replicates (n = 10) with standard error of mean in percentage with 5% value. Significant differences at p < 0.05 are indicated by asterisks (student t-test).
Abbreviation: I: irradiance; D: darkness; IHT: high temperature under irradiance; DHT: high temperature under darkness; YL: young leaves; ML: mature leaves; YP: young pods and MP: mature pods
3.2 O-J-I-P transients
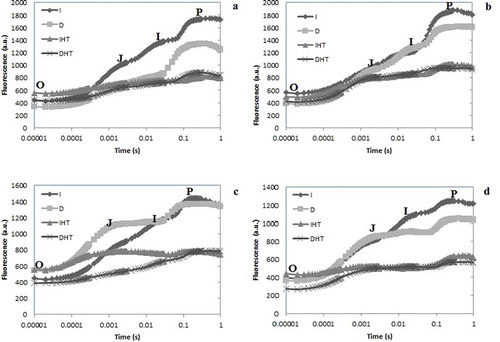
Upon illumination of dark adapted tissues i.e. leaves and pods the chlorophyll a fluorescence emission shows O-J-I-P transient curves starting from Fo to Fm via two intermediate steps Fj and Fi (). Each step exhibited a different response to darkness and heat stress. After exposure of elevated temperature 45°C in both young and mature leaves the O-J-I steps were significantly higher and P step was lower than in control (,b)). Young leaves showed much decline in P step than mature leaves. In both young and mature pods, sharp decline of P step was reported under elevated temperature ((c,d)). After exposure of elevated temperature for 24 h, the stress induced changes were greater in pods than leaves but nonsignificant changes were observed after incubation at normal temperature in both conditions light and dark.
Figure 3. Chlorophyll a fluorescence OJIP transient curves in pigeonpea leaves and pods after 24 hrs of incubation in normal temperature (25°C) as control, and high temperature 45°C for 24 h (HT), OJIP transient curves in young leaves (a), mature leaves (b), young pods (c) and mature pods (d). Here O is for origin (minimal fluorescence Fo), J and I for two different inflections (Fj and Fi) and P for peak (maximum fluorescence Fp or Fm). Abbreviation: I: irradiance; D: darkness; IHT: high temperature under irradiance; DHT: high temperature under darkness.
3.3 Quantum yields and efficiency
Maximum quantum yield of primary PSII photochemistry (φPo = Fv/Fm) is used as a chlorophyll fluorescence indicator of heat stress. In this study, in pods and leaves Fv/Fm was lower in elevated temperature than in control ()). In both young and mature leaves a significant decrease of Fv/Fm observed after 45°C, it was an average 0.80 in control condition while after elevated temperature reduced up to 40% and 30%, respectively. In young and mature pods ~35% and ~50% decline of Fv/Fm was reported. Darkness showed a moderate drop in quantum yield of PSII as compare to light irradiance.
Figure 4. Maximum quantum yield of primary PSII photochemistry (ϕPo = Fv/Fm) (a), and the efficiency with which an electron can move from PQH2 to PSI end electron acceptor (δRo) (b) in different stages of leaf and pod of pigeonpea after 24 h of incubation in normal temperature (25°C) and high temperature 45°C for 24 h (HT). Each value is the mean of replicates (n = 10) with standard error of mean in percentage with 5% value. Significant differences at p < 0.05 are indicated by asterisks (Tukey’s test).
Abbreviation: I: irradiance; D: darkness; IHT: high temperature under irradiance; DHT: high temperature under darkness; YL: young leaves; ML: mature leaves; YP: young pods and MP: mature pods
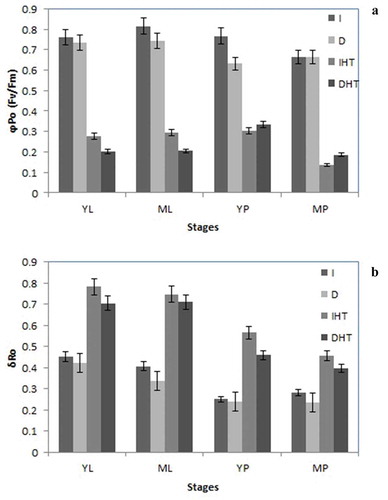
Efficiency with which an electron from PQH2 is transferred to PSI, energy flux of PSI (δRo) was enhanced in both leaves and pods under elevated temperature. Significant increase of δRo ~35%, ~33% and ~25% in young leaf, young and mature pods, respectively ()). Nonsignificant enhancement of δRo was observed under dark condition as compare to light irradiance in both types of tissue. It means under elevated temperature electron transport from reduced intersystem electron acceptor to PSI, which might be activation of dark reaction. Mature leaves showed slight increase in energy flux of PSI.
3.4 Spider chart for J-I-P test parameters
A multi-parametric spider plot with quantification of 15 J-I-P test parameters were recorded in to analyse structural and functional relationship of photosynthetic apparatus of different tissue i.e. leaves and pods under both control and elevated temperature (). Significant differences were observed in almost all specific energy flux ratio of PSII, parameter of PSI and fluorescence parameter Fv/Fo, either in different stages of leaves or pods. Exposure of elevated temperature for 24 h, quantum yield efficiency viz., φPo, ψEo and φEo was significantly declined whereas δRo increased in both leaves and pods than in control. Fluorescence parameters Fo/Fm and Mo, energy flux viz., ABS/RC and DIo/RC were significantly increased in both tissues under elevated temperature than control but darkness under normal temperature showed slight changes as compare to light irradiance.
Figure 5. A spider plot of 16 selected JIP parameters form chlorophyll a fluorescence in pigeonpea young leaves (a), mature leaves (b), young pods (c), and mature pods (d) after 24 h of incubation in normal temperature (25°C) as control, and high temperature 45°C for 24 h (HT), asterisks showed significant differences at p < 0.05 by multiple comparison (Tukey’s test).
Abbreviation: I: irradiance; D: darkness; IHT: high temperature under irradiance; DHT: high temperature under darkness; YL: young leaves; ML: mature leaves; YP: young pods and MP: mature pods.
3.5 Energy pipeline model (membrane and leaf and pod)
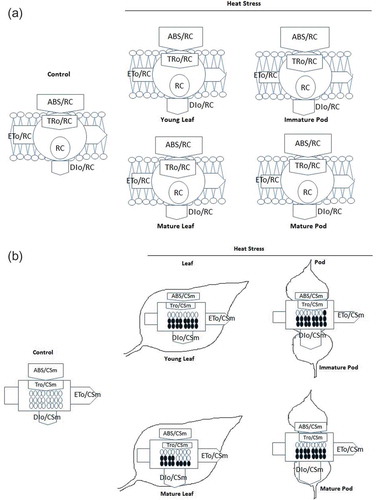
For more insight into elevated temperature induced changes in photosynthetic apparatus, energy pipeline models (membrane and leaf and pod) were constructed (,b)). In the membrane model, ABS/RC and TRo/RC were slightly high in both tissues than control. DIo/RC was about two to three folds higher under elevated temperature in both leaf and pods, respectively ()). In contrast, in the leaf and pod model, ABS/CSm and TRo/CSm, ETo/CSm and RC/CSm were 0.3 to 0.5 fold lower under elevated temperature than in control in all stages of leaf and pod, however DIo/CSm was significantly increased in both tissues ()).
Figure 6. (a) Pipeline model of specific fluxes (membrane model) per reaction centre (RC) in different stages of leaf and pod of pigeonpea exposed after heat stress at 45°C for 24h. ABS/RC: absorption flux per RC, TRo/RC: trapped energy flux per RC (t = 0), ETo/RC: electron transport flux per RC (t = 0) and DIo/RC dissipated energy flux per RC (t = 0). Each relative values represented by the size of proper parameters in arrow. (b) Pipeline model of phenomenological fluxes (leaf and fruit) per excited cross section (CSm) in different stages of leaf and pod of pigeonpea exposed after heat stress at 45°C for 24h. Black filled circle denotes inactivation reaction centres (RC); unfilled circle active reaction center; ABS/CSm: absorption flux per excited cross section, TRo/CSm: trapped energy flux per excited cross section, ETo/CSm: electron transport flux per excited cross section and DIo/CSm: dissipated energy flux per excited cross section. Each relative values represented by the size of proper parameters in arrow.
3.6 Performance index
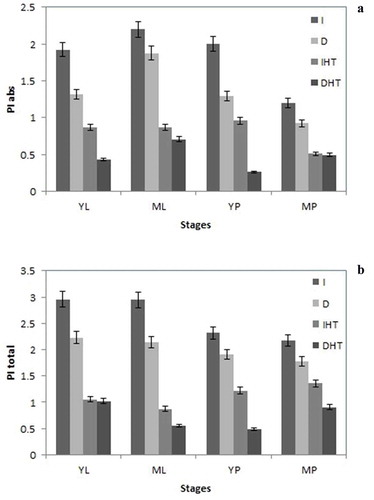
Performance indices were proposed by Tsimill-Michael and Strasser (2008)Citation42. These PIs are described as combined information on the performance of PSII and reduction of intersystem electron acceptors (PIABS) and reduction of PSI end acceptors (PITOTAL). In our study under elevated temperature PIABS was lower than that in control, in both pods and leaves ()). Young leaves showed higher PIABS than mature leaves mature pods showed minimum PIABS among in all different stages of both tissues i.e. leaves and pods. In this study a significant decline of PIABS ~60%, 50% was reported in young and mature leaves, respectively, under elevated temperature. A similar trend was reported in both young and mature pods. PItotal showed significant increase in all stages of leaves and pods ()). About 20–30% increase in PItotal was calculated in all different stages of leaf and pod. Tissue specific moderate drop was observed in darkness as compare to light irradiance under normal temperature.
Figure 7. Performance index PIabs (a), and PItotal (b) in different stages of leaf and pod of pigeonpea after 24 h of incubation in normal temperature (25°C) as control, and high temperature 45°C for 24 h (HT). Each value is the mean of replicates (n = 10) with standard error of mean in percentage with 5% value. Significant differences at p < 0.05 are indicated by asterisks (Tukey’s test).
Abbreviation: I: irradiance; D: darkness; IHT: high temperature under irradiance; DHT: high temperature under darkness; YL: young leaves; ML: mature leaves; YP: young pods and MP: mature pods
4. Discussion
Chlorophyll and carotenoids degradation was found in both leaf and pod; however, young leaves and young pods exhibited more advanced degradation of pigments under elevated temperature as compare to mature tissues. High temperature exposure caused reduction in biosynthesis of chlorophyll by deactivation of various enzymes.Citation43 Under elevated temperature reduced accumulation of photosynthetic pigments might be due to down regulate biosynthesis of chlorophyll and carotenoids or upregulate degradation or combined effect of both. One of enzymes 5-aminolevulinate dehydratase activities used in chlorophyll biosynthesis significantly decreased in wheat,Citation44 and about 60% reduction of this enzyme were reported in cucumber under high temperature.Citation45 Developing leaves showed sharp decline of chl a and b in elevated temperature.Citation46 In heat tolerant cultivation of tomato and sugarcane as increased chl a/b ratio and considerable deceased of chl/car ratio was noted. It shows that changing pigment ratio has also an important role in heat tolerance varieties.Citation47
Increased Fo after exposure of high temperature reveals physical separation of the PSII RCs from their associated pigment antennae leads to block energy transfer to the PSII traps.Citation48 Effect of elevated temperature on photosynthetic electron transport, the decrease in fluorescence at P step might be due to inhibition of electron flow either donor or acceptor side of the PSII. Damage in PSII donor side leads to appearance of additional ‘K’ peak in O-J-I-P curve at (~300 µs).Citation27,Citation35,Citation36 However, in this finding no ‘K’ peak appeared under elevated temperature to either leaves or pods. It means donor side of PSII was not affected by high temperature. Similarly no well-expressed ‘K’ peak in O-J-I-P curve was observed in tomato, common bean and rice.Citation30,Citation34,Citation49 Several J-I-P tests were calculated to observe damage in acceptor side of PSII. These tests might be identified many functions viz., energy absorption, energy trapping and electron transport.Citation27 This finding revealed that after exposure of elevated temperature in both tissues, significant increase in net rate of RC closure, as indicated by Mo, suggested that the reduction of QA to QĀ was higher under elevated temperature than in control. This finding is supported by previous results that net rate of RC closure was increased for tomato leaf and fruits, pea leaf, wheat, rice and apple peel after exposure of high temperature.Citation21,Citation27,Citation30,Citation35,Citation36,Citation50
Elevated temperature exposure decreased maximum quantum yield for primary PSII photochemistry (φPo = Fv/Fm) suggested that high temperature decreases the rate of primary charge separation and disassemble some minor antenna from PSII RCs, resulting certainly rise of energy dissipation as heat.Citation51 Under heat stress Fv/Fm ratio strongly depressed which means precipitates suppression of electron transport chain.Citation52 In previous studies Fv/Fm has been used as proxy for maximal quantum yield of PSII photochemistry under influence of high temperature stress.Citation18,Citation21,Citation53 Above 40°C a significant decrease in Fv/Fm was reported in crofton weed leaf,Citation51 in barley,Citation54,Citation55 in both leaf and fruit of tomatoCitation30 and oak species.Citation56 In elm seedling, when subjected to heat stress the young leaves exhibit lower Fv/Fm than mature leaves.Citation57 High temperature increases the probability that an electron is transported from reduced intersystem electron acceptor to final electron acceptor of PSI (δRo). Higher δRo shows resulting in a bigger pool size of end electron acceptor at PSI, which might be due to thermal activation of dark reaction. Experimental evidences showed that elevated temperature enhances energy flux of PSI i.e. δRo in both leaves and pods. It means under elevated temperature an electron is transported from the reduced intersystem electron acceptor to final electron acceptor of PSI, which might be due to thermal activation of dark reaction. Our findings were supported by previous study in bean plant.Citation34 In apple, barley and tomato PSI was less damaged than PSII under high temperature stress.Citation30,Citation51,Citation58 In this study, in all stages of leaf and pods, the energy flux φEo, ψEo, φPo of PSII were lower under elevated temperature than in control, whereas energy flux δRo of PSI was higher. Thus it is suggested that in both leaf and pod of pigeonpea, PSI appear to be more heat tolerant than PSII.
Energy pipeline model implicated several parameters of PSII under elevated temperature. For example specific flux per RC in membrane model enhanced ABS/RC, TRo/RC and DIo/RC in both tissues indicate that average absorption (ABS/RC) and trapping (TRo/RC) per active RC increases owing to the inactivation of some RCs, and that the ratio of total dissipation to the amount of active RCs (DIo/RC) increases because of high dissipation of inactive RCs. Similar findings were reported in pea leaves,Citation27 apple peelCitation35,Citation36 and in both fruits and leaves of tomato.Citation30 In contrast phenomenological fluxes per CSm decreased ABS/CSm reflects an increased density of inactive reaction centres in response to heat stress. Thus, reduced TR/CSM and ET0/CSM indicates that active RCs are converted into inactive RCs, reducing the efficiency of trapping and a decline in PSII activity. Similar findings were reported in spinach leavesCitation59 and in tomato leaf and fruit.Citation30
In the study declined in performance index PIabs with elevated temperature indicates that high temperature causes a significant decrease of overall photosynthetic activity. PIABS is produced by combination of three components RC/ABS(density of active RC per chlorophyll absorption), φPo and ψEo.Citation40,Citation60 Many studies had revealed at response of Performance index to high temperature, a drastic decrease in PIABS (56%) occurred in crofton weed leaves when exposed to 42°C or above,Citation51 and similar trends in tomato leaves and fruits.Citation30 PIABS decreased at 45°C for 2 h in beans,Citation34 consistent with wheat,Citation21 barleyCitation58 and sorghum.Citation61 Thus, PIABS could be used as a proxy of heat induced plant damage.Citation51
Enhanced PItotal after exposure of elevated temperature in both tissues allow the extending the study of photosynthetic electron transport activity beyond PSII, involving changing in intersystem electron transport and PSI processes.Citation34 This finding is supported with similar trend of increased in PItotal observed in tomato leaf and fruit.Citation30
5. Conclusion
Our findings revealed tissue specific photosynthetic pigments and performance in pigeonpea. For the first time elevated temperature induced changes in O-J-I-P transients showed tissue specific differences. PSI was more tolerant to elevated temperature in leaves than pods. Furthermore, PSII electron transport chain and quantum efficiency was more sensitive in elevated temperature than PSI. Only a minor drop in cell pigments pool and photosynthetic performance was observed after 24 h darkness as compare light irradiance. Results expressed that in pigeonpea, O-J-I-P transients can be used a sensitive, nondestructive method for measuring heat stress damage and a special tool for investigating performance of PSI and PSII. However, in this study detached leaves and pods were used for high temperature treatment, therefore further study may be required to clear understanding of O-J-I-P transients and plant performance under in-vivo condition. Our findings contribute to basic knowledge of the tissue specific photosynthetic pigments and application of O-J-I-P transients in pigeonpea research. Outcomes of this study will be used to screen potential thermo-tolerant genotypes of pigeonpea to sustain in either current scenario of climate change or/and erratic future climatic conditions that leads to contribute in food and nutrition security of growing population. This finding also contributes to basic knowledge of application of O-J-I-P transients and is the first step in building J-I-P database for pigeonpea.
Abbreviations
| F0 | = | minimum fluorescence from dark-adapted leaf (PSII RCs open) |
| Fm | = | maximum fluorescence from dark adapted leaf (PS II centres closed) |
| Fv/Fm | = | maximum quantum yield of PSII photochemistry |
| LED | = | light emitting diode |
| PQ | = | plastoquinone |
| PSI | = | photosystem I |
| PSII | = | photosystem II |
| QA | = | primary PSII quinone electron acceptor |
| QB | = | secondary PSII quinone electron acceptor |
| RC | = | reaction centre |
| OEC | = | oxygen evolving complex |
| PI | = | Performance Index |
| Chl a | = | chlorophyll a |
| Chl b | = | chlorophyll b |
| ABS | = | absorbance |
| CS | = | cross-section |
| RC | = | reaction centre |
| OEC | = | oxygen evolving complex |
| PEA | = | plant efficiency analyzer |
| Car | = | carotenoids |
| fd | = | ferredoxin |
| Cyt | = | cytochrome |
| NADP | = | Nicotinamide adenine dinucleotide phosphate |
| ft | = | feet |
| nm | = | nanometer |
| µs | = | micro second |
| s | = | second |
| h | = | hours |
| HSD | = | honestly significant difference |
| °C | = | degree Celsius |
| IP | = | immature pods |
| MP | = | mature pods |
| YL | = | young leaves and ML, mature leaves |
Disclosure of Potential Conflicts of Interest
No potential conflicts of interest were disclosed.
Acknowledgments
The work was supported by Fiji National University. I thank Prof Rajendra Prasad and Mrs. Prasad for pigeonpea growth and management, Mr Mahendra Singh, Department of Language and Literature for editing and proof reading, Special thanks to Dr Subhash Yadav, Department of Statistics, BBAU, Lucknow, India for data analysis. I also thank to Ms Sujeshni and Dr Kapil Dave for assistance during experimentation.
References
- FAOSTAT, Food and Agriculture Organization of the United Nations (FAO). 2015. [accessed 2015 Jan 6]. http://www.faostat.fao.org/faostat/collections?version=ext&hasbulk0&subset=agriculture
- Saxena R. K, von Wettberg E, Upadhyaya HD, Sanchez V, Songok S, Saxena KB, Kimurto P, Varshney RK. Genetic diversity and demographic history of Cajanus spp. illustrated from genome-wide SNPs. Public Lib of Sci ONE. 2014;9:e88568. doi:10.1371/journal.pone.0088568.
- Songok S, Ferguson M, Muigai AW, Silim S. Genetic diversity in pigeonpea [Cajanus cajan (L.) Millsp.] landraces as revealed by simple sequence repeat markers. Af J Biotechnol. 2010;9:3231–3241.
- Prasad M. 1999. Pulses in the Pacific, new agriculturist reporting agriculture for 21st century. Suffolk (UK): WREN media Ltd. http://www.new-ag.info/99-5/focuson/focuson5.html.
- Saxena KB, Kumar RV. Quality nutrition through pigeonpea-a review. Health. 2010;2:1335–1344. doi:10.4236/health.2010.211199.
- Mishra S, Singh RK, Kalia A, Panigrahy SR. Impact of climate change on pigeon pea. Econ Affairs. 2017;62(3):455–457. doi:10.5958/0976-4666.2017.00057.2.
- Haldimann P, Feller U. Inhibition of photosynthesis by high temperature in oak (Quercus pubescens) leaves grown under natural conditions closely correlates with a reversible heat-dependent reduction of the activation state of ribulose-1, 5-bisphosphate carboxylase/oxygenase. Plant Cell Environ. 2004;27:1169–1183. doi:10.1111/j.1365-3040.2004.01222.x.
- Govindjee SD, Björn L-O. Evolution of the Z-scheme of hotosynthesis: a perspective. Photosynthetic Res. 2017;133:5–15. doi:10.1007/s11120-016-0333-z.
- Holt NE, Zigmantas D, Valkunas L, Li XP, Niyogi KK, Fleming GR. Carotenoid cation formation and the regulation of photosynthetic light harvesting. Science. 2005;307:433–436. doi:10.1126/science.1105833.
- Zakar T, Laczko-Dobos H, Toth TN, Gombos Z. Carotenoids assist in cyanobacterial photosystem II assembly and function. Frontie Plant Sci. 2016;7:295.
- Bouvier F, Isner JC, Dogbo O, Camara B. Oxidative tailoring of carotenoids: a prospect towards novel functions in plants. Trends Plant Sci. 2005;10:187–194. doi:10.1016/j.tplants.2005.02.007.
- Campos MD, Nogales A, Cardoso HG, Campos C, Grzebelus D, Velada I, Arnholdt-Schmitt B. Carrot plastid terminal oxidase gene (dcptox) responds early to chilling and harbors intronic pre-mirnas related to plant disease defense. Plant Gene. 2016;7:21–25. doi:10.1016/j.plgene.2016.07.002.
- Barnabás B, Jäger K, Fehér A. The effect of drought and heat stress on reproductive processes in cereals. Plant Cell Environ. 2008;31:11–38. doi:10.1111/j.1365-3040.2007.01727.
- Sumesh K, Sharma-Natu P, Ghildiyal M. Starch synthase activity and heat shock protein in relation to thermal tolerance of developing wheat grains. Biologia Plant. 2008;52:749–753. doi:10.1007/s10535-008-0145-x.
- Rachmilevitch S, DaCosta M, Huang B. Physiological and biochemical indicators for stress tolerance, Plant–environment interactions. 3rd ed. Boca Raton (FL): CRC Press; 2006. p. 321–356.
- Govindjee. Chlorophyll a fluorescence: a bit of basics and history. In: Papageorgiou GC, Govindjee editors. Chlorophyll a fluorescence: a signature of photosynthesis, advances in photosynthesis and respiration. Vol. 19. Dordrecht (The Netherland): Springer; 2004. p. 1–41.
- Papageorgiou GC, Govindjee, editors. Chlorophyll a fluorescence: a signature of photosynthesis. In: Advances in photosynthesis and respiration. Vol. 19. Dordrecht (The Netherland): Springer; 2004. p. 820.
- Govindjee. Sixty-three years since Kautsky: chlorophyll a fluorescence. Aust J Plant Physiol. 1995;22:131–160.
- Strasser RJ. Donor side capacity of photosystem II probed by chlorophyll a fluorescence transients. Photosynthetic Res. 1997;52:147–155. doi:10.1023/A:1005896029778.
- Tóth SZ, Schansker G, Győző Garab RJ, Strasser. Photosynthetic electron transport activity in heat-treated barley leaves: the role of internal alternative electron donors to photosystem II. Biochimica Et Biophysica Acta (BBA). 2007;1767(4):295–305. doi:10.1016/j.bbabio.2007.02.019.
- Mathur S, Jajoo A, Mehta P. Analysis of elevated temperature induced inhibition of photosystem II using chlorophyll a fluorescence induction kinetics in wheat leaves (Triticum aestivum). Plant Biolo. 2011;13:1–6. doi:10.1111/j.1438-8677.2009.00319.x.
- Stirbet A, Govindjee. Chlorophyll a fluorescence induction: a personal perspective of the thermal phase, the J-I-P rise. Photosynthetic Res. 2012;113:15–61.
- Stirbet A, Riznichenko GY, Rubin AB. Modeling chlorophyll a fluorescence transient: relation to photosynthesis. Biochemistry-Moscow. 2014;79:291–323. doi:10.1134/S0006297914040014.
- Kalaji H, Jajoo A, Oukarroum A, Brestic M, Zivcak M, Samborska I, Cetner M, Goltsev V, Ladle R, Dąbrowski P, et al. The use of chlorophyll fluorescence kinetics analysis to study the performance of photosynthetic machinery in plants. In Ahmad P, Editor. Emerging technologies and management of crop stress tolerance. The Netherland: Elsevier; 2014. p. 347-384. doi:10.1016/B978-0-12-800875-1.00015-6.
- Guha A, Sengupta D, Reddy AR. Polyphasic chlorophyll a fluorescence kinetics and leaf protein analyses to track dynamics of photosynthetic performance in mulberry during progressive drought. J Photochem Photobiol B. 2013;119:71–83. doi:10.1016/j.jphotobiol.2012.12.006.
- Guisse´ B, Srivastava A, Strasser RJ. Effects of high temperature and water stress on the polyphasic chlorophyll a fluorescence transient of potato leaves. In: Mathis P, editor. Photosynthesis: from light to biosphere. Dordrecht (The Netherland): Kluwer Academic Publishers; 1995. p. 913–916 pp.
- Strasser RJ, Tsimilli-Michael M, Srivastava A. The fluorescence transient as a tool to characterize and screen photosynthetic samples. In: Yunus M, Pathre U, Mohanty P, editors. Probing photosynthesis: mechanisms, regulation and adaptation. London (UK): Taylor & Francis; 2000. p. 443–480.
- Strasser RJ, Tsimilli-Michael M, Srivastava A. Analysis of the chlorophyll a fluorescence transient. In: Papadogeorgiou GC, Govindjee, editors. Chlorophyll a fluorescence: a signature of photosynthesis. Dordrecht, (The Netherlands): Springer; 2004. p. 321–362.
- Strauss AJ, Krüger GHJ, Strasser RJ. Ranking of dark chilling tolerance in soybean genotypes probed by the chlorophyll a fluorescence transient O-J-I-P. Environ Exp Bot. 2006;56:147–157. doi:10.1016/j.envexpbot.2005.01.011.
- Zushi K, Kajiwara S, Matsuzoe N. Chlorophyll a fluorescence OJIP transient as a tool to characterize and evaluate response to heat and chilling stress in tomato leaf and fruit. Sci Hortic (Amsterdam). 2012;148:39–46. doi:10.1016/j.scienta.2012.09.022.
- Zushi K, Matsuzoe N. Using of chlorophyll a fluorescence OJIP transients for sensing salt stress in the leaves and fruits of tomato. Sci Hortic (Amsterdam). 2017;219:216–221. doi:10.1016/j.scienta.2017.03.016.
- Wahid A, Gelani S, Ashraf M, Foolad MR. Heat tolerance in plants: an overview. Environ Exp Bot. 2007;61:199–223. doi:10.1016/j.envexpbot.2007.05.011.
- Ogweno JO, Song X-S, Hu W-H, Shi K, Zhou Y-H, Yu J-Q. Detached leaves of tomato differ in their photosynthetic physiological response to moderate high and low temperature stress. Sci Hortic (Amsterdam). 2009;123:17–22. doi:10.1016/j.scienta.2009.07.011.
- Stefanov D, Petkova V, Denev ID. Screening for heat tolerance in common bean (Phaseolus vulgaris L.) lines and cultivars using JIP-test. Sci Hortic. 2011;128(1):1–6. doi:10.1016/j.scienta.2010.12.003.
- Chen LS, Cheng L. Photosystem 2 is more tolerant to high temperature in apple (Malus domestica Borkh.) leaves than in fruit peel. Photosynthetica. 2009;47:112–120. doi:10.1007/s11099-009-0017-4.
- Chen L-S, Li P, Cheng L. Comparison of thermotolerance of sun-exposed peel and shaded peel of ‘Fuji’ apple. Environ Exp Bot. 2009;66:110–116. doi:10.1016/j.envexpbot.2008.12.017.
- Arnon DI. Copper enzymes in isolated chloroplasts. Polyphenoloxidase in Beta Vulgaris. Plant Physiol. 1949;24:1–15. doi:10.1104/pp.24.1.1.
- Kirk JTO, Allen RL. Dependence of chloroplast pigments synthesis on protein synthetic effects on actilione. Biochem Biophys Res J Can. 1965;27:523–530. doi:10.1016/0006-291X(65)90516-4.
- Strasser RJ, Tsimilli-Michael M, Qiang S, Goltsev V. Simultaneous in vivo recording of prompt and delayed fluorescence and 820-nm reflection changes during drying and after rehydration of the resurrection plant. Haberlea Rhodopensis Biochimica and Biophysics Acta. 2010;1797:1313–1326. doi:10.1016/j.bbabio.2010.03.008.
- Strasser RJ, Tsimilli-Michael M, Srivastava A. Analysis of the chlorophyll a fluorescence transient. In: Papageorgiou GC, Govindjee editors. Chlorophyll a fluorescence: a signature of photosynthesis, advances in photosynthesis and respiration. Vol. 19. Dordrecht (The Netherland): Springer; 2004. p. 321–362.
- Stirbet AL, Kromdijk D, Govindjee J. Chlorophyll a fluorescence induction: can just a one-second measurement be used to quantify abiotic stress responses? Photosynthetica. 2018:1–19. doi:10.1007/s11099-018-0770-3.
- Tsimilli-Michael M, Strasser RJ. Invivo assesment of plants vitality: application in detecting and evaluating the impact of mycorrhization on host plant. In: Varma A, editor. Mycorrhiza: state of the art. Genetics and Molecular Biology, Eco-function, Biotechnology, Eco-physiology, structure and Systematics 3rd 2008. Dordrecht (The Netherland): Springer; 2008. p. 679–703.
- Dutta S, Mohanty S, Tripathy BC. Role of temperature stress on chloroplast biogenesis and protein import in pea. Plant Physiol. 2009;150:1050–1061. doi:10.1104/pp.109.137265.
- Mohanty S, Baishna BG, Tripathy C. Light and dark modulation of chlorophyll biosynthetic genes in response to temperature. Planta. 2006;224:692–699. doi:10.1007/s00425-006-0248-6.
- Tewari AK, Tripathy BC. Temperature-stress-induced impairment of chlorophyll biosynthetic reactions in cucumber and wheat. Plant Physiol. 1998;117:851–858. doi:10.1104/pp.117.3.851.
- Karim MA, Fracheboud Y, Stamp P. Photosynthetic activity of developing leaves mays is less affected by heat stress than that of developed leaves. Physiol Plant. 1999;105:685–693. doi:10.1034/j.1399-3054.1999.105413.x.
- Fahad S, Bajwa AA, Nazir U, Anjum SA, Farooq A, Zohaib A, Sadia S, Nasim W, Adkins S, Saud S, et al. Crop production under drought and heat stress: plant responses and management options. Frontie Plant Sci. 2017;8:1147. doi:10.3389/fpls.2017.01147.
- Cheng LP, Gao L, Jiang H, Peng T. Heterogeneous behavior of PSII in soybean (Glycine max) leaves with identical PSII photochemistry efficiency under different high temperature treatments. J Plant Physiol. 2009;166(15):1607–1615. doi:10.1016/j.jplph.2009.04.013.
- Xiao EJ, Qu Y, Mi M, Zhu H. Cyclic electron flow may provide some protection against PSII photoinhibition in rice (Oryza sativa L.) leaves under heat stress. J Plant Physiol. 2017;211:138–146. doi:10.1016/j.jplph.2017.01.007.
- Jain N, Singh GP, Pandey R, Ramya P,S, Nivedita PK, Prabhu KV. Chlorophyll fluorescence kinetics and response of wheat (Triticum aestivum L.) under high temperature stress. Indian J Exp Biol. 2018;56:194–201.
- Chen S, Yang J, Zhang M, Strasser RJ, Qiang S. Classification and characteristics of heat tolerance in Ageratina adenophora populations using fast chlorophyll a fluorescence rise O-J-I-P. Environ Exp Bot. 2016;122(1):126–140. doi:10.1016/j.envexpbot.2015.09.011.
- Xiaoli W, Tang Y, Chaosu L, Chun W, Huang G. Chlorophyll Fluorescence and Yield Responses of Winter Wheat to Waterlogging at Different Growth Stages. Plant Prod Sci. 2015;18(3):284–294. doi:10.1626/pps.18.284.
- Sharma P, Jha AB, Dubey RS, Pessarakli M. Reactive oxygen species, oxidative damage, and antioxidative defense mechanism in plants under stressful conditions. J Bot. 2012;2012;26 pages. Article ID 217037. Doi:10.1155/2012/217037
- Tóth SZ, Schansker G, Kissimon J, Kovács L, Garab G, Strasser RJ. Biophysical studies of photosystem II-related recovery processes after a heat pulse in barley seedlings (Hordeum vulgare L.). J Plant Physiol. 2005;162:181–194. doi:10.1016/j.jplph.2004.06.010.
- Jedmowski C, Ashoub A, Bru¨Ggemann W. Reactions of Egyptian landraces of Hordeum vulgare and Sorghum bicolor to drought stress, evaluated by the OJIP fluorescence transient analysis. Acta Physiologiae Plant. 2013;35(2):345–354. doi:10.1007/s11738-012-1077-9.
- Bussotti KD, Gottardini F, Pollastrini E, Mori M, Tani J, Papini C, Ferrini A, Fini F. Photosynthetic and morphological responses of oak species to temperature and [CO2] increased to levels predicted for 2050. Urban For Urban Greening. 2018;31:26–37. doi:10.1016/j.ufug.2018.01.012.
- Jiang CD, Jiang GM, Li WX, Biswas LH, Li YG. Increased photosynthetic activities and thermostability of photosystem II with leaf development of elm seedlings (Ulmus pumila) probed by the fast fluorescence rise OJIP. Environ Exp Bot. 2006;58:261–268. doi:10.1016/j.envexpbot.2005.09.007.
- Jedmowski C, Brüggemann W. Imaging of fast chlorophyll fluorescence induction curve (OJIP) parameters, applied in a screening study with wild barley (Hordeum spontaneum) genotypes under heat stress. J Photochem Photobiol B: Biol. 2015;151:153–160. doi:10.1016/j.jphotobiol.2015.07.020.
- Tongra T, Mehta P, Mathur S, Agrawal D, Bharti S, Los DA, Allakhverdiev SI, Jajoo A. Computational analysis of fluorescence induction curves in intact spinach leaves treated at different pH. Bio-Systems. 2011;103:158–163. doi:10.1016/j.biosystems.2010.07.019.
- Neonaki DG, Navakoudis C, Kotzabasis K. Salt stress impact on the molecular structure and function of the photosynthetic apparatus—the protective role of polyamines. Biochimica Et Biophysica Acta (BBA). 2007;1767(4):272–280. doi:10.1016/j.bbabio.2007.02.020.
- Yan K, Chen P, Shao H, Zhao J, Zhang S, Lihua, Xu, Gang, Junna S. Responses of photosynthesis and photosystem II to higher temperature and salt stress in sorghum. J Agron Crop Sci. 2012:198. doi:10.1111/j.1439-037X.2011.00498.x.