
ABSTRACT
Silicon is known to promote plant growth as well as stress tolerance of plants. The current study was undertaken to assess the growth promoting effect of silicon on date palm seedling development as well as its ability to abate some of the negative effects of salinity. In this study, date palm seedlings were treated with silicon and sodium chloride salts, and the effect of these salts on some physiological parameters of the plants was determined. In addition, a global nontargeted metabolomics analysis was performed for the leaf and root tissues using liquid chromatography-mass spectrometry (LC-MS). The results showed that under non-stress conditions, silicon treatment enhanced the growth of the date palm seedlings, however, under salinity, silicon slightly mitigates the negative effects of salt stress on the date palm seedlings although it enhances the potassium accumulation under this condition. The global metabolomics analysis has identified a total of 1,101 significant differentially accumulated (p, q ≤ 0.05) metabolites in leaves and roots under silicon, salinity or their combination. A differential pairwise metabolic profile comparison revealed the accumulation of distinct metabolites in response to silicon and salinity treatments such as antioxidant compounds pyridoxine, cepharanthine, allithiamine, myristic acid and boldine; osmoregulators such as mucic acid; along with the accumulation of detoxification intermediates such as S-D-lactoylglutathione, beta-cyano-L-alanine and gamma-glutamyl-conjugates. In addition, histochemical analyses revealed that application of silicon significantly (p ≤ 0.05) enhanced the formation of the Casparian strip. Identification of the differentially accumulated metabolites could offer an insight into how silicon is able to promote growth and salinity tolerance in date palms.
1. Introduction
Salinization is estimated to affect more than 20% of total cultivated land and 33% of irrigated land worldwide, and this trend is increasing at a rate of 10% annually, which may result in a 30% land loss over the next 25 years, and up to 50% by the year 2050.Citation1 Coincidentally, some of the date palm cultivation areas are in heavily salt-affected areas.Citation2
Silicon is the second most abundant element in the earth’s crust, constituting about 28% of the total elements present,Citation3 in the form of silicate minerals and various forms of silicon dioxide.Citation4 Plants take up silicon from the soil in the form of uncharged bioavailable monomeric H4SiO4 or its ionized form Si(OH)3O−, which mainly occurs when the pH value is more than 9.Citation5 The concentration of silicon in plant tissues varies from one species to another. For example, Oryza sativa and Hordeum vulgare accumulate more silicon than Helianthus annuus, Benincasa hispida and Lycopersicon esculentumCitation6,Citation7 and so far silicon toxicity has not been reported.Citation8 The soil where date palms grow is mainly composed of quartz sand, which is 80% silica, a plant bio-inactive form that is not readily available for plant uptake.
Despite the fact that silicon is not an essential element required for plant growth and development, for the last two centuries the use of silicon fertilizers has been reported to play an important role in agriculture.Citation9 Silicon ions are thought to enhance several beneficial traits in plants grown under normal conditions or abiotic stress conditions such as drought, salinity, cold, heat, heavy metals, or even under biotic stress caused by insect pests and other pathogens.Citation10,Citation11 For instance, in tomato, silicon promoted flowering and fruit set,Citation12 enhanced salt and drought tolerance and provided protection against disease-causing pathogens.Citation13
Generally, silicon is assumed to help plants via the enhancement of the structure of their organs through the formation of polymerized silicates in the plant tissuesCitation14 and via the modulation of gene expression.Citation10 In addition, silicates are able to mitigate the effects of salinity by increasing the antioxidant enzymatic activity.Citation15 In some plant species, silicates may enhance the formation of Casparian bands in the epidermis and endodermis, which act as a barrier preventing the non-selective accumulation of salts into the stele via the apoplastic pathway.Citation16
In date palm, metabolite profiles were previously carried out to identify early signs of heat and drought,Citation17 and also to assess the quality and the nutrient value of the fruits.Citation18-Citation20 The present study aimed at analyzing the beneficial effects of silicon in date palm under control conditions, salt stress or their combination, and to identify the associated metabolites in the respective treatments. The date palm seedlings were exposed to NaCl, silicon and their combination, and changes in physiological and histological parameters such as photosynthesis, leaf area, dry weight, sodium, and potassium concentration and Casparian strip formation were investigated. Additionally, global untargeted metabolite profiles were analyzed in order to gain an insight into the metabolic basis of salt-tolerance promoting role of silicon in date palm. The results showed that silicon triggered the production of antioxidant compounds such as boldine, allithiamine, cepharanthine, myristic acid and pyridoxine along with the accumulation of detoxification intermediates such as S-D-lactoylglutathione, beta-cyano-L-alanine, and gamma-glutamyl-conjugates. Previous studies have indicated the accumulation of few metabolites in response to salinity treatment in date palm,Citation21,Citation22 however, this is the first report that globally analyzed metabolites in the leaf and root tissues of this plant when exposed to salinity and silicon treatments.
2. Materials and methods
2.1 Plant growth conditions and silicon treatment
Date palm (Phoenix dactylifera L., cultivar Khalas) seeds were surface-sterilized with 1% commercial bleach for 5 min, followed by 70% ethanol for 10 min, after which they were rinsed and germinated on moist sterile vermiculite in a growth chamber at 37°C for about 10 days under dark, as previously described.Citation23 Once the radicle had emerged, the seedlings were transferred to pots containing potting compost, which were kept in a growth chamber and maintained at 32°C/30°C with a photoperiod of 16/8 h. The seedlings were divided into four sets of treatments; a control treatment in which the plants were irrigated with tap water having an electrical conductivity of 50 mS/m, the second set received 300 mM NaCl (salt stress), the third set received 5 mM Na2SiO3 (+Si) alone (silicon treatment) and the fourth set received both 300 mM NaCl as well as 5 mM sodium silicate (Na2SiO3) (NaCl+Si combined treatment). The NaCl and silicon treatments were administered along with the irrigation on a weekly basis for 8 weeks.
2.2 Photosynthesis-associated parameters and biomass accumulation
The net photosynthesis (A), internal CO2 concentration (ci), stomatal conductance (gs) and transpiration (E) were measured using the LCpro-SD advanced photosynthesis measuring system (ADC Bioscientific Ltd., UK). The leaf surface area was measured using the LI-COR Biosciences LI-3000A Leaf Area Meter (LI-COR Biosciences, Nebraska, USA). For the leaf and root dry mass accumulation, the plants were harvested, rinsed under running tap water to remove any soil particles and the roots and leaves were separated, dried at 70°C for 24 h in an oven, and the dry weight was recorded.
2.3 Sodium and potassium content in the plant tissues
The plant samples were cut into smaller pieces and placed in 25 ml glass vials to which 10 ml of 1M HCl was added. The vials were maintained at 200°C using a hotplate for 4 h. The samples were then filtered into volumetric flasks using Whatman 42 filter papers. The Na+ and K+ concentrations were measured following the previously described protocol,Citation24 using an SYSTRONICS Flame Photometer 128 (SYSTRONICS Ltd., Gujarat, India).
2.4 Histochemical root staining
For histochemical staining assay, date palm seedlings were hydroponically grown in a solution containing the commercial liquid fertilizer 20-05-10 NPK, along with the trace elements boron, zinc, iron, manganese, and copper, as the nutrient source, together with the treatments of NaCl (50 mM) and silicon (5 mM). For the histochemical staining of the roots, a distance of 10 cm was measured from the root tip and hands-free sections were made in this root zone using a sharp blade and stained as described previously.Citation25 The sectioned roots were stained using 0.1% (w/v) berberine chloride for 60 min., after which the excess stain was removed. Subsequently, the tissue was counterstained with 0.5% (w/v) aniline blue for 30 min. The stained root sections were then mounted in 0.1% (w/v) FeCl3 in 50% (v/v) glycerin and viewed under a fluorescent microscope (Nikon Eclipse Ni, Nikon, Tokyo, Japan) with UV illumination and excitation filter G 365, chromatic beam splitter FT 395 and barrier filter LP 420. For the comparisons of the formation of Casparian bands, three readings were taken around the endodermis from each root section and each treatment was replicated five times.
2.5 Global metabolite analysis
Samples were divided into eight different groups based on the treatments and the tissue types. The tissues of the control plants were then separated into leaves (CL) and roots (CR). The salinity treated plants were then divided into leaves (NL) and roots (NR). The Silicon treated plants were then divided into leaves (SiL) and roots (SiR) The plants in which both the salt- and silicon-treatment were further divided into leaves (NSiL) and roots (NSiR). Each group composed of three biological replicates. Each replicate included tissues from three different plants. At the end of the treatment (120-day old seedlings), the leaves and roots were harvested, flash-frozen in liquid nitrogen and freeze-dried for 48 h and used for the metabolite analysis.
The untargeted metabolite and primary data analyses were carried out at the Proteomics and Mass Spectrometry Facility, Donald Danforth Plant Science Center, Saint Louis, USA, as a service provider. Leaf and root tissues were separately ground and the metabolites were extracted in 80% methanol by vortexing for 10 min, centrifuged, and the aqueous phase was filtered using an 0.8-μm spin filter made of polyethersulfone (PES), after which they were dissolved in 10 mM NH4HCO3 in water and 10 mM NH4HCO3 in 95% acetonitrile, as solvents. One microliter of each sample was loaded and then analyzed using liquid chromatography-mass spectrometry (LC-MS), via hydrophilic interaction liquid chromatography (HILIC) on a 0.5 x 150-mm ZIC-pHILIC column and reverse-phase liquid chromatography (RPLC) on a 0.5 x 100-mm PLRP-S column. The complete system setting used in the HILIC and RPLC-LC-MS, and library searching were listed in Table S1. Briefly, LC-MS/MS was carried out on a high-resolution accurate Thermo Q-Exactive Orbitrap mass instrument (ThermoFisher Scientific, Waltham, MA). A gradient chromatographic separation and positive and negative polarity-switching ion mode were used in this analysis. Since no internal standards were used, the data were normalized using quantile normalization. Raw data files were converted to mz5 format using ProteoWizard version 3.0.9987.Citation26 Feature finding (a/k/a peak picking) was performed using Elements version 1.4.2.Citation27
The results from the LC-MS analysis were analyzed using Scaffold Elements viewer software version 2.1.1.Citation26 The log10 value of the average precursor intensity (area under the peak) of each analyte was used as the concentration value for each analyte. The metabolite groups and the metabolite clusters were filtered based on the confidence in the analyte identity value (ID score) with a threshold value of ≥ 0.7. The various metabolites within the groups were selected based either on the highest ID score or on the potential biological function in plants. Significant differences in the accumulation of metabolites among the different samples were calculated using a t-test (p, q ≤ 0.05). The significance level of multiple testing was corrected using the false discovery rate (FDR) following using the Benjamini-Hochberg procedure at a level of q ≤ 0.05.Citation28 These metabolites were then identified via the linked ChemSpider database.Citation29 After identification, the metabolites were functionally characterized by searching for the corresponding metabolite and metabolic pathways in the Human Metabolome Database (HMDB).Citation30 Mapping of the metabolites onto the corresponding pathways was carried out using the Kyoto Encyclopedia of Genes and Genomes (KEGG) database,Citation31 using the default settings. The accumulation of differential amounts of metabolites in different samples was illustrated by a heat map using PermutMatrix version 1.9.3. software,Citation32 using the log10 value of the area under the peak of each analyte, the Euclidean distance dissimilarity distance, and the multiple fragment heuristic seriation rule. A principal component analysis (PCA) was carried out in order to reveal the statistical correlations between metabolites produced in the date palm leaf and root tissues grown under different treatments, using Past 3 software.Citation33 The log10 values of the area under the peak of each analyte and the default setting of the software was used in this analysis. The presence of a specific analyte within the metabolomic profile of the samples was demonstrated by point, illustration, explanation (PIE) analysis using Venn diagrams via Venny 2.1 software.Citation34 This analysis will only show the presence or absence of specific analyte in each of the treatments, but not the differentially accumulated metabolites in the plant tissues due to the different treatments.
2.6 Statistical analysis
The results of the growth parameters under different treatments were compared and the significance verified using a one-way ANOVA t-test and using univariant analysis and Tukey’s post hoc test, in SPSS software version 21.
3. Results
3.1 Silicon enhanced plant growth under salinity
Salinity treatment at a concentration of 300 mM NaCl was the most effective salinity stress for date palm seedlings, while 5 mM Na2SiO3 was the most effective concentration on plant growth. The growth and the biomass of the date palm seedlings were greatly affected in plants exposed to salinity stress and treated with silicon ().
Figure 1. The effect of silicon and salinity on the growth of date palm seedlings (a). Growth changes in date palm seedlings grown under silicon (Si), control, silicon and saline (NaCl+Si) and saline (NaCl) conditions. These changes in the leaf area (b), leaf fresh weight (c) and root dry weight (d) of date palm seedlings subjected to silicon, salinity, and silicon combined with salinity treatments. The bars represent the means (n = 9 ± SE) and significant differences at p < .05 are marked by asterisks.
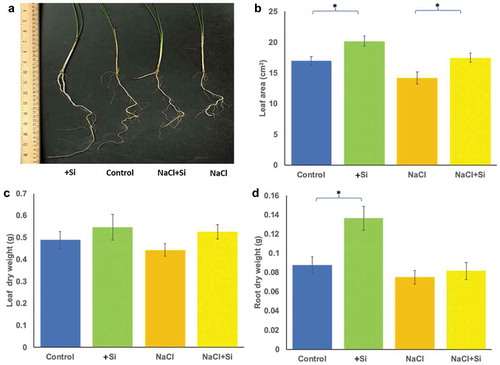
The leaf area was significantly (p < .05) increased in plants treated with silicon (+Si) alone as well as in plants treated with silicon and salinity (NaCl+Si) (). The dry mass accumulation of the leaf and root tissues was negatively affected by salinity; however, it was mildly increased in leaves treated with either silicon (+Si) or silicon combined with salt stress (). The dry mass accumulation of the root tissue was also significantly (p < .05) increased in plants treated with silicon alone (+Si) ().
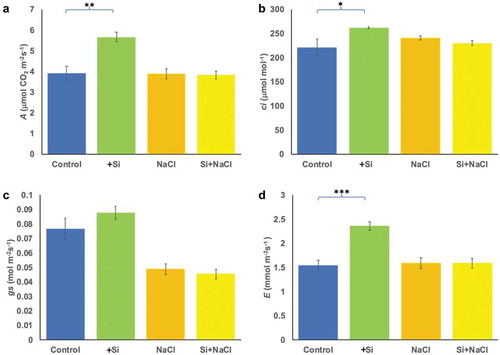
The effect of silicon treatment on the photosynthetic parameters such as the net photosynthesis
(A), internal CO2 concentration (ci), stomatal conductance (gs) and transpiration (E) was measured in leaves of plants treated with silicon with or without salt stress. Interestingly, A (p < .05) and ci (p < .001) were significantly increased in plants treated with silicon alone compared with the control conditions (). Treatment with salinity led to a slight increase in gs in silicon-treated plants. However, no significant change was observed in plants exposed to saline conditions (). The results also showed that there was a significant (p < .01) increase in E when plants were treated with silicon alone but did not show a significant effect on the plants grown under saline conditions ().
Figure 2. Changes in photosynthesis-associated parameters due to salinity and silicon treatments. The parameters include the net photosynthesis (A) (a), internal leaf CO2 concentration (ci) (b), stomatal conductance (gs) (c) and transpiration (E) (d). The values represent the means (n = 9 ± SE) and significant differences at p < .05, p < .01, p < .001 are marked by asterisks as (*), (**), and (***), respectively.
3.2 Silicon treatment enhanced K+ uptake in roots
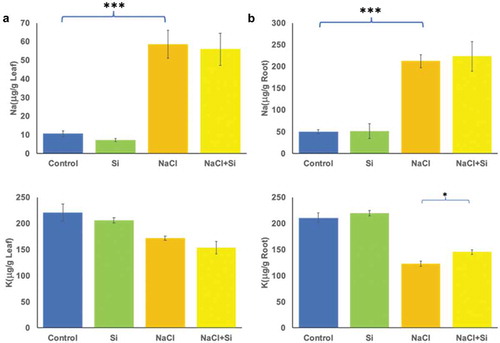
The Na+/K+ homeostasis plays an important role in salinity tolerance therefore; the concentration of these ions was measured in the leaf and root tissues exposed to different treatments. The Na+ levels in leaves and roots were significantly (p < .05) increased under salt stress. The Na+ levels were slightly decreased in leaves of plants exposed to silicon alone (). However, the Na accumulation pattern did not differ between salinity and salinity plus silicon-treated group. In general, salinity led to a significant (p < .05) negative effect on K+ accumulation in the plants. However, the combined salt and silicon treatments resulted in a significant (p < .05) increase in K+ concentration in root tissue () but a mild decrease in leaf tissue ().
Figure 3. Changes in Na+ and K+ concentrations in response to salt stress and silicon treatments in leaves (a) and roots (b). The values represent the means (n = 9 ± SE) and significant differences at p < .05, and p < .001 are marked by asterisks as (*), and (***), respectively.
3.3 Silicon enhanced the formation of casparian strips in root tissues
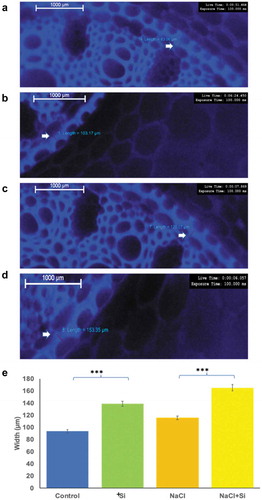
The Casparian strip plays a crucial role in the selective apoplastic bypass of salts under salinity. To assess whether the formation of Casparian strips in roots was altered under salt stress or salt stress combined with silicon treatment, histochemical staining was performed. The thickness of the Casparian strips was significantly (p < .05) increased in plants treated with silicon compared to the untreated control plants (). Similarly, it was also significantly increased in plants exposed to salt stress combined with silicon treatment compared with salt stress-treated plants ().
Figure 4. The changes in the width of the Casparian strip observed under the fluorescent microscope in roots of plants grown under different treatments. The stained root images were taken from control plants (a), salinity-treated plants (b) and silicon alone treated plants (c), and salt stress plus silicon-treated plants (d). The measurements were statistically analyzed for different samples (e). Changes in the width were measured in μm. The values represent the means (n = 15 ± SE) and significant differences at p < .001 are marked by asterisks.
3.4 Metabolic profiles of date palm
In general, the silicon treatment has decreased the negative effects of salinity on date palm seedlings (–). To gain an insight into the metabolic basis of this observation, global untargeted metabolite profiles of leaf and root tissues from the plants exposed to different treatments (control, silicon, NaCl and NaCl+silicon) were obtained. The analysis revealed a total of 1,043 significantly (p, q ≤ 0.05) accumulated metabolites. Of these, 544 and 499 metabolites were obtained using the RPLC and HILIC techniques, respectively. Only metabolites with FDR corrected p (q) ≤0.05 were included in the analysis. This analysis revealed the presence of a high number of metabolites in date palm tissues, however, the current study mainly focused on metabolites that were previously identified from other plant species.
A principal component analysis (PCA) which explained about 64% of the variance, suggested a statistical correlation between replicates within each treatment group as well as between different treatment groups. The replicates within each metabolic group were clustered together on the PCA chart plotter, suggesting a high level of homogeneity within the metabolic profiles of the replicates of each group ().
Figure 5. Principal component analysis (PCA) illustrating distances between metabolites identified from a group of three replicate samples of leaves (CL) and roots (CR) when the plants were irrigated with distilled water, leaves (NL) and roots (NR) when the plants were irrigated with 300 mM NaCl solution, leaves (SiL) and roots (SiR) when the plants were irrigated with a silicon solution only and leaves (NSiL) and roots (NSiR) when the plants were irrigated with a salt solution in the presence of silicon. The first two coordinates explained about 64% of the variance.
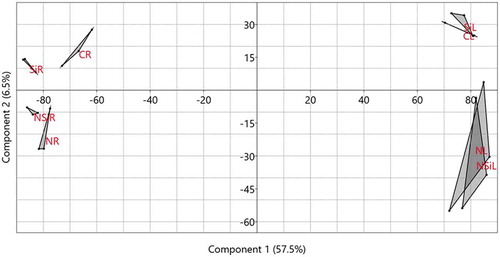
Additionally, the treatment groups were distributed on the chart plotter based on the tissue type and the treatment. While metabolic profiles identified from leaf tissues (CL, SiL, NL, and NSiL) were localized on the left-hand side of the chart, metabolic profiles from the root tissues (CR, SiR, NR, and NSiR) were localized on the right-hand side of the chart. Similarly, while the profile groups identified from control group (irrigated with water) or a silicon solution (CL, SiL, CR and SiR) were localized on the upper part of the chart, whereas most of the profiles identified from salinity-treated plants (NL, NSiL, NR and NSiR) were localized on the lower parts of the chart plotter. Interestingly, the metabolic profiles of the roots of silicon-treated (SiR) and untreated (CR) plants were clearly separated on the chart plotter. Similarly, a lesser extent separation was evident for the roots exposed to salt stress or combined salt stress and silicon treatment. However, the separation between silicon and without silicon treatments was not clear for the leaf tissues, i.e., between control and silicon-treated plants or between salt stress and combined salt stress and silicon-treated plants ().
3.5 Metabolites accumulating in the plants in response to salinity and silicon treatments
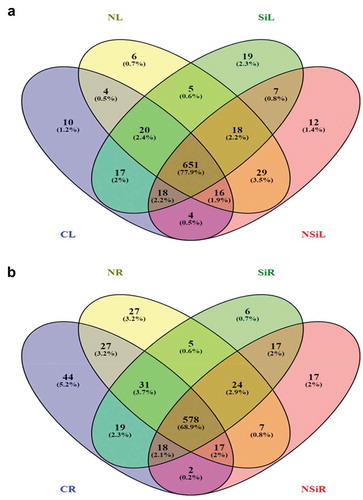
A total of 1,101 differentially accumulated metabolites were identified from leaf and root tissues in this study. Of these, 836 and 839 were identified from the leaves and roots, respectively. Among them, 345 metabolites were shared between both tissue types under different conditions tested (Supplement Table S2). Of the 836 unique metabolites identified in the leaf tissue subjected to four different treatments (control, silicon, salinity, and combination of salinity and silicon), 651 metabolites were shared between all treatments (). Similarly, 578 metabolites in roots were shared between all four conditions tested. When compared with the plants grown under control conditions, only nineteen and six metabolites were exclusively accumulated in the leaf and the roots respectively, in the silicon-treated samples. Likewise, upon the comparison between salt stress alone and salt stress combined with silicon treatment, 12 and 17 metabolites were exclusively accumulated in the leaves and roots respectively, in the plants grown under salinity combined with silicon treatment (Supplementary Table S3 and Supplementary Table S4). Interestingly, there were 47 metabolites exclusively accumulated in the leaves of plants under salinity, of which six were only detected in NaCl-treated leaves and twelve were only detected in salt stress combined with the silicon-treated leaves. However, there were 29 metabolites in the leaves common between both salt stress conditions, i.e., presence or absence of silicon ().
Figure 6. The distribution of a number of metabolites identified from leaves (a) and roots (b) of the plants grown under control, salinity, silicon or salinity combined with silicon treatment. The number of metabolites produced in leaves (CL) or roots (CR) of control plants, leaves (NL) or roots (NR) of plants treated with salinity, leaves (SiL) or roots (SiR) of plants treated with silicon alone or leaves (NSiL) or roots (NSiR) of plants treated with silicon and salinity, are illustrated in the Venn diagram.
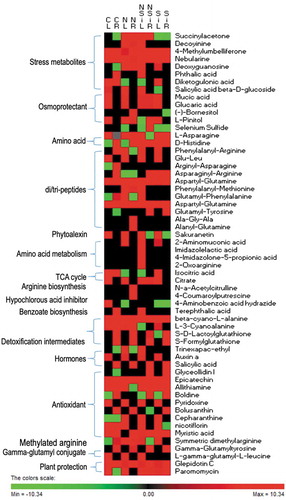
The abundances of the metabolites identified in this study were varied qualitatively and quantitatively between the tissues during different treatments. While some of them were simply present or absent (), others were present at different levels in the samples (Supplementary Figure S1 and Supplementary Table S5).
Figure 7. Heat map depicting the differential accumulation of selected metabolites and their classification in the leaves or roots of plants grown under control, salinity, silicon or salinity combined with silicon treatment. The heat map in leaves (CL) or roots (CR) of control plants, leaves (NL) or roots (NR) of plants treated with salinity, leaves (SiL) or roots (SiR) of plants treated with silicon alone or leaves (NSiL) or roots (NSiR) of plants treated with silicon and salinity. The heat map was constructed using the log10 of the mean value of three replicates of the precursor intensity (area under the peak) of three replicates of each analyte.
3.6 Differentially accumulated metabolites in leaves in response to salinity
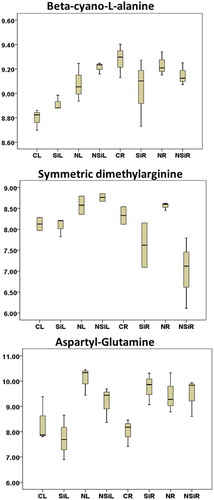
Pairwise analysis of the metabolic profiles revealed 133 differentially accumulated metabolites in the leaves of plants exposed to salt stress (Supplementary Table S6). Some of these metabolites may play important biological roles under salinity. For example, succinylacetone, a cytotoxic metabolite of tyrosine (Supplementary Figure S1), the nitric oxide inhibitor symmetric dimethylarginine (), were slightly enhanced in the leaf tissues in response to salinity treatment. Additionally, the various dipeptides including phenylalanyl-methionine, glutamyl-phenylalanine, glutamyl-tyrosine, and aspartyl-glutamine, were repressed in the leaves under salinity conditions (). The tryptophan metabolism intermediate 2-aminomuconic acid, the GMP synthase inhibitor decoyinine and the salicylic acid beta-D-glucoside, which is a storage form of salicylic acid were some other differentially accumulated metabolites (Supplementary Table S6). In addition, there were 47 metabolites that were specifically accumulated in the leaves under salinity. These include metabolites such as phosphatidylethanolamine lyso 18:2, along with the polyether compound polypropylene glycol (Supplementary Table S3).
Figure 8. Boxplot presentation of some differentially accumulated metabolites involves oxidation scavenging pathways in date palm. The x-axis on the graphs represent the treatments while the y-axis represents the log10 value of the area under the MS peaks.
3.7 Differentially accumulated metabolites in roots in response to salinity
Differential pairwise analysis of the metabolic profiles showed that there were 187 significantly (p, q ≤ 0.05) accumulated metabolites in roots in response to salinity. Some of them have known function in salinity tolerance in plants. For example, dipeptide and tripeptide metabolites ala-gly-ala and alanyl-glutamine, N-a-acetylcitrulline, an intermediate metabolite of the arginine biosynthesis,Citation35 phenolamide 4-coumaroylputrescine, hypochlorous acid inhibitor 4-aminobenzoic acid hydrazide,Citation36 4-methylumbelliferone which is a coumarin derivative which inhibits lateral root formationCitation37 and sakuranetin, which is a jasmonic acid-induced phytoalexin which enhances stress toleranceCitation38 (Supplementary Table S7). A total of 51 metabolites were specifically accumulated in roots due to salinity (, Supplementary Table S4). Among these metabolites, the abscisic acid (ABA)-oxidized metabolite 7′-hydroxyabscisic acid, the GMP synthase inhibitor decoyinine and the antioxidant dihydrolipoate, which is a reduced form of lipoic acid are some of the worth mentioning metabolites.
3.8 Differentially accumulated metabolites in leaves in response to silicon treatment alone
The pairwise analysis was carried out in order to investigate the role of silicon in plant growth enhancement. The analysis revealed the presence of 111 differentially accumulated metabolites with significant (p, q ≤ 0.05) quantities in leaf tissues of the plants grown under control conditions (Supplementary Table S8). These metabolites included the gamma-glutamyl conjugate L-gamma-glutamyl-L-leucine,Citation39 the reactive oxygen species (ROS) quencher pyridoxine, also known as vitamin B6,Citation40 the dipeptide glu-leu, asparaginyl-arginine and phenylalanyl-arginine, the antioxidant alkaloid cepharanthineCitation41 and the antimicrobial metabolites glepidotin CCitation42 and paromomycin.Citation43 The accumulation of these antimicrobial metabolites was affected due to silicon and salinity treatments (Supplementary Figure S1). Importantly, 19 metabolites were exclusively accumulated in silicon-treated leaves and these compounds were absent in leaves from control samples (). These metabolites included the antifungal aromatic anofinic acid,Citation44 the plant hormone salicylic acid and a jasmonic acid derivative, epi-4ʹ-hydroxyjasmonic acid, which was shown to be involved in mediating plants’ defense against pathogens and feeding pests.Citation45 The list also included the flavonoid ketohexosefuranoside pinnatifinoside-A and the phenolic antioxidant epicatechin 3-glucoside (Supplementary Table S4).
3.9 Differentially accumulated metabolites in roots in response to silicon treatment alone
In comparison with the silicon untreated roots, a total of 152 differentially accumulated metabolites with significant (p, q ≤ 0.05) amounts were identified in root tissues, when date palm seedlings were treated with silicon (Supplementary Table S9). These metabolites included the plant hormone salicylic acid, the salt-tolerance inducing amino acid L-asparagine, the antimicrobial and antioxidant flavonoid bolusanthin, the intermediate detoxified metabolite of formaldehyde S-formylglutathione, the gamma-glutamyl conjugate gamma-glutamyltyrosine and the dipeptides aspartyl-glutamine and arginyl-asparagine,Citation46 the cytoprotective flavonoid glycoside nicotiflorin,Citation47 antioxidant metabolites such as the flavonoid epicatechin,Citation48 the vitamin B1 allithiamine,Citation49 and the alkaloid boldine.Citation50 These metabolites showed a differential pattern of accumulation when the plants were treated with silicon under control conditions (Supplementary Figure S1). Additionally, there were six analytes that were specifically accumulated in the roots, such as the anticancer agent glucoraphaninCitation51 and the antimicrobial and antioxidant isocoumarin coriandrone-CCitation52 (Supplementary Table S4).
3.10 Differentially accumulated metabolites in leaves exposed to salinity combined with silicon treatments
Differential metabolic profile analysis revealed the presence of 58 significantly (p, q ≤ 0.05) accumulated metabolites in leaf tissues in response to salinity and silicon treatments. These included metabolites with potential biological functions in plants, such as the amino acid L-histidine which induces pathogen resistance in Arabidopsis,Citation53 along with its metabolism intermediaries imidazole lactic acidCitation54 and 4-imidazolone-5-propionic acid,Citation55 the potential chelate molybdenum 2-oxoarginine,Citation56 which is an intermediate metabolite derived from the metabolism of arginine, the antioxidant alkaloid cepharanthine,Citation57 terephthalic acid,Citation58 which is the precursor for benzoate biosynthesis and the oxidative stress inducer phthalic acidCitation59 (Supplementary Table S10). In addition, 12 metabolites were specifically accumulated in leaves in response to silicon and salinity. These included the antimicrobial metabolite rifapentineCitation60 and antioxidant diterpene glycosides in the form of hovenidulcioside B1Citation61 (, Supplementary Table S3).
3.11 Differentially accumulated metabolites in roots exposed to salinity combined with silicon treatments
The differential metabolite analysis revealed the presence of 190 significantly (p < .05) accumulated metabolites in roots when plants were treated with silicon and grown under salinity (Supplementary Table S11). The list included saturated myristic fatty acid, mucic acid, and glucaric acid, which are hexaric acids formed by the oxidation of sugars,Citation62 the two methylated derivatives of myo-inositol, (-)-bornesitoland the soluble sugar L-pinitol. These analytes were slightly induced in response to silicon treatment in the plants (Supplementary Figure S1). In addition, hydrogen cyanide detoxification intermediates S-D-lactoylglutathione,Citation63 beta-cyano-L-alanine and L-3-cyanoalanine, which was induced in the leaf tissues due to silicon treatment under control and salinity treatments (). The diketogulonic acid, which is a hydrolyzed product of dehydroascorbic acid, isocitric acid and citrate, which are metabolites of the tricarboxylic acid cycle (TCA),Citation64 the antimicrobial phytoalexin glyceollidin I,Citation65 and selenium sulfide, which may be a byproduct of the oxidation of glutathioneCitation66 were significantly accumulated (Supplementary Table S11).
There were 15 metabolites specifically detected in silicon-treated roots under salinity (, Supplementary Table S5). These metabolites included the condensed tannin cinnamtannin A2, with potential antimicrobial activity,Citation67 mucic acid, the ascorbic acid metabolite 2,3-diketo-L-gulonate and the freezing-induced glycoglycerolipid monogalactosyldiacylglycerol (MGDG 36:5).Citation68
3.12 Detoxification pathways enriched in salinity combined with silicon treatment
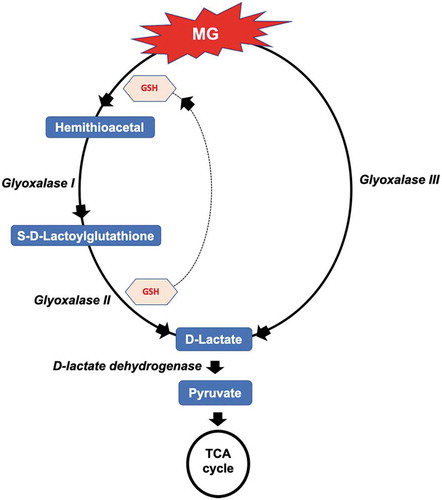
Metabolic pathway mapping of metabolites accumulated in leaf and root tissues of seedlings treated with silicon suggested that some of them could play a role in three main detoxification pathways. The detoxification pathways included the degradation of the cytotoxic dicarbonyl methylglyoxal (MG), which is a byproduct of various metabolic processes through the glyoxalase I, II and III of the glyoxalase systems. This resulted in the conversion of the glutathione-bound MG to S-D-lactoylglutathione, with the help of lactoylglutathione lyase.Citation63 S-D-lactoylglutathione is further broken down through glyoxalase II with the help of hydroxyacylglutathione hydrolase enzyme, to D-lactate (). Indeed, our results showed an increase of the S-D-lactoylglutathione in the silicon-treated plant tissues when grown under control and salinity conditions.
Figure 9. An illustration showing the involvement of metabolites isolated from silicon-treated plants grown under salinity in the methylglyoxal (MG) detoxification mechanism, via the glutathione (GSH)-dependent glyoxalase I and glyoxalase II and the glutathione (GSH)-independent glyoxalase III pathways.
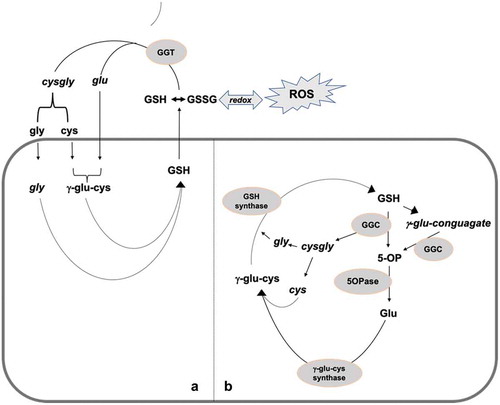
The second potential detoxification metabolic pathway could be through the gamma-glutamyl cycle and via gamma-glutamyl-cotransferase (GGCT), along with the 5-oxo-prolinase pathway.Citation46 These two pathways are involved in glutathione catabolism and amino acid recycling processes in the cell. The various gamma-glutamyl-conjugated compounds and 5-oxo-prolines found in the current study may be involved in these pathways, it was noted that there was an increase in seven out of nine gamma-glutamyl-conjugates in the leaf tissues and five out of seven in the roots under salt stress condition. There was a further increase in five and four gamma-glutamyl-conjugates in the leaf and roots respectively when silicon was supplemented under salt stress condition (Supplementary Table S12). In the detoxification and recycling pathway, the extracellular apoplastic and vacuolar oxidized-glutathione and glutathione-bound toxic metabolites are detoxified and recycled with the help of gamma-transferase (GGT), gamma-glutamyl-cotransferase (GGCT) and the 5-oxo-prolinase enzymes (). These observations suggest that silicon enhances the detoxification pathway of toxic metabolites.
Figure 10. An illustration showing the involvement of metabolites isolated from silicon-treated plants grown under salinity in glutathione degradation and recycling, via the extracellular and vacuolar gamma-glutamyl cycle (a) and cytosolic GGC and 5-Opase (b) pathways.
The third potential pathway could be the detoxification of hydrogen cyanide in plants. In this pathway, the nitrile detoxification intermediates are produced via the cyanide detoxification pathway, which involves beta-cyano-L-alanine.Citation69 This metabolite was accumulated in silicon-treated leaves in control conditions, with further enhancement under salt stress treatment. On the other hand, the accumulation of beta-cyano-L-alanine was reduced in the roots under both control and salinity conditions on silicon treatment (). This may suggest that the production of hydrogen cyanide, a by-product of the ethylene biosynthesis in the salt-treated plants was inhibited by silicon treatment. Additionally, the various metabolites identified in this study were mapped on the cyanoamino acid metabolism pathway (Figure S2).
4. Discussion
Date palm is a slow-growing and environmentally stimulating plant. However, silicon has an enhancing effect on the growth of the plant, including increasing the leaf area and the dry mass accumulation of the leaves and roots of plants, when grown under control and saline conditions. This increase could be attributed to the silicon-mediated ameliorating effect of the salt stress in date palm.
Although the accumulation of Na+ in leaves and roots was not significantly affected by silicon treatment under control or saline conditions, there was a significant (p, q ≤ 0.05) increase in the concentration of K+ which resulted in better/higher K+/Na+ ratio, which is one of the important traits contributing to the salt tolerance.Citation70
This increase in K+ accumulation in roots under salt stress could be due to the presence of silicon, which could enhance Casparian band formation in the roots. This type of enhancement was previously observed in other plant speciesCitation71 and suggests the direct involvement of silicon in the salinity tolerance of date palm.
Metabolomics analysis was carried out to better understand the metabolic basis of silicon-mediated growth enhancement as well as salt tolerance in date palm. This metabolomic analysis revealed that treatment with silicon under salinity leads to the accumulation of some antioxidant metabolites in the leaves of date palm seedlings. For example, pyridoxine, which is also known as vitamin B6, is an important antioxidant cofactor that efficiently quenches ROS under stress conditions.Citation72,Citation73 Similarly, the alkaloid cepharanthine was shown to have antioxidant and radical scavenging activity.Citation57 Alike, the alkaloid boldine has previously been reported to have a high reactivity toward free radicals and antioxidant properties.Citation74
The metabolites that were significantly accumulated in the roots of silicon-treated plants under salt stress conditions included myristic acid, which controls various redox imbalances originating from stress conditions in plants via N-myristylation, including the myristylation of SOS3 proteins, an important sodium detoxification pathway in plants.Citation75 In addition, ascorbate, a water-soluble form of vitamin C, which is a potent antioxidant that quenches ROS, was observed to be accumulated. The oxidization of ascorbate leads to the production of a reversible form of ascorbate free radical, which can be further oxidized to form dehydro-l-ascorbic acid, and further hydrolysis of dehydro-l-ascorbic acid produces 2,3-diketo-L-gulonate. All three forms have been shown to have antioxidant properties.Citation76 It was also suggested that the catabolism of ascorbic acid correlates with the rate of cell expansion,Citation77 and that the metabolites of 2,3-diketo-L-gulonate play a role in pathogen defense.Citation78
Date palm seedlings treated with silicon and grown under control conditions also accumulated plant biotic defense metabolites such as the antifungal aromatic anofinic acid,Citation79 the broad-spectrum antifungal agent glucoraphaninCitation80 and the jasmonic acid derivative epi-4ʹ-hydroxyjasmonic acid.Citation81 Previous reports showed that silicon enhances tolerance toward pathogens and pests.Citation82 In addition, the antimicrobial rifapentineCitation83 was highly accumulated in roots of plants treated with silicon under saline conditions. The upregulation of various metabolites that are associated with biotic stress tolerance in silicon-treated seedlings may also have a role in tolerating abiotic stresses such as salinity. Salicylic acid was also accumulated in the roots due to silicon treatment under control conditions. The accumulation of this metabolite, which has previously exhibited a positive effect on the root growth of other plant species,Citation84 is consistent with the phenotypic observations obtained in this study, where silicon-treated plants exhibited greater root biomass compared with the control plants ().
The metabolomic profiles in response to silicon treatment also led to the accumulation of analytes with osmoprotectant properties. For example, mucic acid, also known as galactaric acid, is a sugar acid, and acts as an osmoprotectant under drought stress conditions and can be used as a metabolite marker for stress tolerance.Citation85 In addition, methylated derivatives of myo-inositol, bornesitol and L-pinitol, which act as osmoregulators and as free radical scavengers were also accumulated.Citation86,Citation87 These osmolytes were significantly accumulated in the roots of salinity-stressed plants.
The plant membrane glycoglycerolipid monogalactosyldiacylglycerol (MGDG 36:5)Citation68 was accumulated in the silicon-treated roots under saline conditions. This metabolite is an essential component of chloroplasts membranes. Overexpression of a rice monogalactosyldiacylglycerol synthase (OsMGD) gene, a key enzyme in the biosynthesis of MGDG, improved the salt tolerance of transgenic tobacco.Citation88
The observed differential accumulation of metabolites provided an insight into the presence of some detoxification mechanisms triggered by silicon. For example, the significant (p, q ≤ 0.05) accumulation of the detoxification intermediate S-formylglutathione in the roots of silicon-treated plants may suggest that silicon enhances the degradation of formaldehyde in plants, catalyzed by alcohol dehydrogenase-3 in the presence of reduced glutathione (GSH).Citation89 In the absence of silicon, there was a significant (p, q ≤ 0.05) increase in the accumulation of the cyanide detoxification intermediates beta-cyano-L-alanine and L-3-cyanoalanine, in the salinity-treated roots. These metabolites are involved in cyanide detoxification during ethylene biosynthesis.Citation90 This observation may suggest that there is an upregulation of the synthesis of ethylene under salinity treatment. However, in the presence of silicon, these metabolites were lower, probably because ethylene production was inhibited by silicon, since it was previously reported that silicon decreases the accumulation of 1-aminocyclopropane-1-carboxylic acid (ACC), the main precursor for the biosynthesis of ethylene in plants.Citation91
The accumulation of S-D-lactoylglutathione in the silicon-treated plants under salinity suggests the presence of a detoxification mechanism for the cytotoxic MG, a byproduct of various metabolic processes.Citation68 Previous studies showed that MG acts as a signaling molecule regulating various processes of growth and development via the regulation of Ca+, K+, ROS and ABA.Citation92,Citation93 However, hyperaccumulation of MG in the cell is detrimental, leading to the generation of ROS and the formation of advanced glycation end products.Citation93 To overcome the cytotoxicity of MG, plants are equipped with a glyoxalase detoxification system to maintain MG homeostasis. MG is detoxified via two main pathways: the glutathione-dependent pathway which is catalyzed via the two enzymes glyoxalase I (lactoylglutathione lyase) and glyoxalase II (hydroxyacylgluthathione hydrolase) and the glutathione-independent pathway which is catalyzed by glyoxalase III (DJ-1)Citation63 (). The overaccumulation of the MG degradation intermediate S-D-lactoylgluthione in the silicon-treated date palm seedlings under salt stress conditions implies that the efficiency of the glyoxalase system in these plants is greater, compared with the control plants. Therefore, silicon treatment possibly enhances the rate of photosynthesis (A) and the root biomass ( and ).
The accumulation of di- and tri-amino acid molecules in the silicon-treated plants under salinity suggests the degradation and recycling of the oxidized-glutathione and glutathione-bound toxic metabolites via the gamma-glutamyl-transferase (GGT) cycle and cys-gly dipeptide.Citation46 Glutathione is an intracellular thiol molecule which is necessary for the plant growth and development.Citation94 It is a strong non-enzymatic antioxidant which plays an important role in protecting proteins from oxidative denaturation by protecting their thiol molecules under a variety of stress conditions. Therefore, the degradation and recycling of the oxidized-glutathione and glutathione-bound toxic metabolites are important, to maintain the cellular redox balance that may be challenged by various stresses. There is another potential alternative pathway, in which glutathione degrades in the cytosol, via gamma-glutamyl-cotransferase (GGCT) and 5-oxo-prolinase (5-Opase).Citation39 These two pathways exist side by side and are independent in function. The gamma-glutamyl cycle is important for extracellular glutathione recycling, whereas gamma-glutamyl-cotransferase (GGCT) and 5-oxo-prolinase (5-Opase) maintain the cytosolic glutathione homeostasis ().
It was noted that some microbial and antimicrobial metabolites were identified during the LC-MS analysis. This is not a surprise because these metabolites may be derived from the endophytic microbes colonizing date palm tissues.
5. Conclusions
The use of silicon significantly enhances some of the growth parameters along with Casparian band formation in date palm seedlings. In general, metabolic profiles revealed the enhanced accumulation of stress-induced metabolites such as antioxidants and ROS scavengers, osmolytes, detoxified cytotoxic intermediates in a silicon-dependent manner in plants grown under saline conditions. Further studies are required to functionally characterize these differentially accumulated metabolites and to verify the mechanism by which silicon enhances salt tolerance in date palm.
Availability of datasets
LC-MS processed results obtained from this study were deposited in the Metabolomics Workbench database with the accession number ST001155.
Disclosure of potential conflicts of interest
The authors declare no conflict of interest.
Missing Value
Supplemental Material
Download Zip (575.6 KB)Supplementary materials
Supplemental data for this article can be accessed on the publisher’s website.
Additional information
Funding
Related Research Data
References
- Jamil A, Riaz S, Ashraf M, Foolad M. Gene expression profiling of plants under salt stress. CRC Crit Rev Plant Sci. 2011;30:1–16. doi:10.1080/07352689.2011.605739.
- Yaish MW, Kumar PP. Salt tolerance research in date palm tree (Phoenix dactylifera L.), past, present, and future perspectives. Front Plant Sci. 2015;6:348. doi:10.3389/fpls.2015.00348.
- Imtiaz M, Rizwan MS, Mushtaq MA, Ashraf M, Shahzad SM, Yousaf B, Saeed DA, Rizwan M, Nawaz MA, Mehmood S. Silicon occurrence, uptake, transport and mechanisms of heavy metals, minerals and salinity enhanced tolerance in plants with future prospects: a review. J Environ Manage. 2016;183:521–529. doi:10.1016/j.jenvman.2016.09.009.
- Ivani R, Sanaei Nejad SH, Ghahraman B, Astaraei AR, Feizi H. Role of bulk and Nanosized SiO2 to overcome salt stress during Fenugreek germination (Trigonella foenum-graceum L.). Plant Signal Behav. 2018;13:e1044190. doi:10.1080/15592324.2015.1044190.
- Ma JF, Yamaji N. Silicon uptake and accumulation in higher plants. Trends Plant Sci. 2006;11:392–397. doi:10.1016/j.tplants.2006.06.007.
- Tubaña BS, Heckman JR. Silicon in soils and plants. In: Rodrigues F, Datnoff L, editors. Silicon and plant diseases. Springer; 2015. p. 7–51.
- Chen D, Wang S, Yin L, Deng X. How does silicon mediate plant water uptake and loss under water deficiency? Front Plant Sci. 2018;9:281. doi:10.3389/fpls.2018.00281.
- Sivanesan I, Son MS, Song JY, Jeong BR. Silicon supply through the subirrigation system affects growth of three chrysanthemum cultivars. Hort Environ Biotechnol. 2013;54:14–19. doi:10.1007/s13580-013-0120-0.
- Tubana BS, Babu T, Datnoff LE. A review of silicon in soils and plants and its role in US agriculture: history and future perspectives. Soil Sci. 2016;181:393–411.
- Debona D, Rodrigues FA, Datnoff LE. Silicon’s role in abiotic and biotic plant stresses. Annu Rev Phytopathol. 2017;55:85–107. doi:10.1146/annurev-phyto-080516-035312.
- Detmann K, Araújo W, Martins S, Fernie AR, DaMatta F. Metabolic alterations triggered by silicon nutrition: is there a signaling role for silicon? Plant Signal Behav. 2013;8:e22523. doi:10.4161/psb.22523.
- Marodin JC, Resende JT, Morales RG, Silva ML, Galvão AG, Zanin DS. Yield of tomato fruits in relation to silicon sources and rates. Hortic Bras. 2014;32:220–224. doi:10.1590/S0102-05362014000200018.
- Manivannan A, Ahn Y-K. Silicon regulates potential genes involved in major physiological processes in plants to combat stress. Front Plant Sci. 2017;8:1346. doi:10.3389/fpls.2017.01346.
- Meharg C, Meharg AA. Silicon, the silver bullet for mitigating biotic and abiotic stress, and improving grain quality, in rice? Environ Exp Bot. 2015;120:8–17. doi:10.1016/j.envexpbot.2015.07.001.
- Zhu Z, Wei G, Li J, Qian Q, Yu J. Silicon alleviates salt stress and increases antioxidant enzymes activity in leaves of salt-stressed cucumber (Cucumis sativus L.). Plant Sci. 2004;167:527–533. doi:10.1016/j.plantsci.2004.04.020.
- Fleck AT, Nye T, Repenning C, Stahl F, Zahn M, Schenk MK. Silicon enhances suberization and lignification in roots of rice (Oryza sativa). J Exp Bot. 2010;62:2001–2011. doi:10.1093/jxb/erq392.
- Safronov O, Kreuzwieser J, Haberer G, Alyousif MS, Schulze W, Al-Harbi N, Arab L, Ache P, Stempfl T, Kruse J. Detecting early signs of heat and drought stress in Phoenix dactylifera (date palm). PLoS One. 2017;12:e0177883. doi:10.1371/journal.pone.0177883.
- Hamad I, AbdElgawad H, Al Jaouni S, Zinta G, Asard H, Hassan S, Hegab M, Hagagy N, Selim S. Metabolic analysis of various date palm fruit (Phoenix dactylifera L.) cultivars from Saudi Arabia to assess their nutritional quality. Molecules. 2015;20:13620–13641. doi:10.3390/molecules200813620.
- Hadrami AE, Daayf F, Hadrami IE. Secondary metabolites of date palm. In: Date palm biotechnology. Springer Netherlands; 2011. p. 653–674. doi:10.1007/978-94-007-1318-5_31pp.
- Al-Alawi RA, Al-Mashiqri JH, Al-Nadabi JS, Al-Shihi BI, Baqi Y. Date palm tree (Phoenix dactylifera L.): natural products and therapeutic options. Front Plant Sci. 2017;8:845. doi:10.3389/fpls.2017.00845.
- Yaish MW. Proline accumulation is a general response to abiotic stress in the date palm tree (Phoenix dactylifera L.). Genet Mol Res. 2015;14:9943–9950. doi:10.4238/2015.august.19.30.
- Al Kharusi L, Al Yahyai R, Yaish MW. Antioxidant response to salinity in salt-tolerant and salt-susceptible cultivars of date palm. Agriculture. 2019;9:8. doi:10.3390/agriculture9010008.
- Al Kharusi L, Assaha DV, Al-Yahyai R, Yaish MW. Screening of date palm (Phoenix dactylifera L.) cultivars for salinity tolerance. Forests. 2017;8:136. doi:10.3390/f8040136.
- Munns R, Wallace PA, Teakle NL, Colmer TD. Measuring soluble ion concentrations (Na+, K+, Cl−) in salt-treated plants. In: Sunkar R, editor. Plant stress tolerance. Methods in Molecular Biology (Methods and Protocols). Totowa, NJ: Humana Press; 2010. p. 371–382.
- Brundrett MC, Enstone DE, Peterson CA. A berberine-aniline blue fluorescent staining procedure for suberin, lignin, and callose in plant tissue. Protoplasma. 1988;146:133–142. doi:10.1007/BF01405922.
- Chambers MC, Maclean B, Burke R, Amodei D, Ruderman DL, Neumann S, Gatto L, Fischer B, Pratt B, Egertson J. A cross-platform toolkit for mass spectrometry and proteomics. Nat Biotechnol. 2012;30:918. doi:10.1038/nbt.2377.
- Seitzer PM, Searle BC. Incorporating in-source fragment information improves metabolite identification accuracy in untargeted LC–MS data sets. J Proteome Res. 2019;18:791–796.
- Benjiamini Y, Hochberg Y. Controlling the false discovery rate: a practical and powerful approach to multiple testing. J Royal Stat Soc B. 1995;57:289–300.
- Pence HE, Williams A. ChemSpider: An online chemical information resource. J Chem Educ. 2010;87:1123–1124.
- Wishart DS, Feunang YD, Marcu A, Guo AC, Liang K, Vázquez-Fresno R, Sajed T, Johnson D, Li C, Karu N. HMDB 4.0: the human metabolome database for 2018. Nucleic Acids Res. 2017;46:D608–D617. doi:10.1093/nar/gkx1089.
- Ogata H, Goto S, Sato K, Fujibuchi W, Bono H, Kanehisa M. KEGG: Kyoto encyclopedia of genes and genomes. Nucleic Acids Res. 1999;27:29–34. doi:10.1093/nar/27.1.29.
- Caraux G, Pinloche S. PermutMatrix: a graphical environment to arrange gene expression profiles in optimal linear order. Bioinformatics. 2005;21:1280–1281. doi:10.1093/bioinformatics/bti141.
- Hammer Ø, Harper D, Ryan P. Paleontological statistics software: package for education and data analysis. Palaeontol Electronica. 2001;4:1–9.
- Oliveros JV. An interactive tool for comparing lists with venn diagrams; 2007.Available: http://bioinfogp.cnb.csic.es/tools/Venny/index.html.
- Slocum RD. Genes, enzymes and regulation of arginine biosynthesis in plants. Plant Physiol Biochem. 2005;43:729–745. doi:10.1016/j.plaphy.2005.06.007.
- Kettle AJ, GEDYE CA, WINTERBOURN CC. Mechanism of inactivation of myeloperoxidase by 4-aminobenzoic acid hydrazide. Biochem J. 1997;321:503–508. doi:10.1042/bj3210503.
- Li X, Gruber MY, Hegedus DD, Lydiate DJ, Gao M-J. Effects of a coumarin derivative, 4-methylumbelliferone, on seed germination and seedling establishment in Arabidopsis. J Chem Ecol. 2011;37:880. doi:10.1007/s10886-011-9987-3.
- Shimizu T, Lin F, Hasegawa M, Okada K, Nojiri H, Yamane H. Purification and identification of naringenin 7-O-methyltransferase, a key enzyme in the biosynthesis of the flavonoid phytoalexin sakuranetin in rice. J Biol Chem. 2012; jbc. M112. 351270. doi:10.1074/jbc.M112.351270.
- Ohkama-Ohtsu N, Oikawa A, Zhao P, Xiang C, Saito K, Oliver DJ. A γ-glutamyl transpeptidase-independent pathway of glutathione catabolism to glutamate via 5-oxoproline in Arabidopsis. Plant Physiol. 2008;148:1603–1613. doi:10.1104/pp.108.125716.
- Bilski P, Li M, Ehrenshaft M, Daub M, Chignell C. Vitamin B6 (pyridoxine) and its derivatives are efficient singlet oxygen quenchers and potential fungal antioxidants. Photochem Photobiol. 2000;71:129–134. doi:10.1562/0031-8655(2000)071<0129:sipvbp>2.0.co;2.
- Kogure K, Tsuchiya K, Abe K, Akasu M, Tamaki T, Fukuzawa K, Terada H. Direct radical scavenging by the bisbenzylisoquinoline alkaloid cepharanthine. Biochim et Biophys Acta (BBA) Gen Subj. 2003;1622:1–5. doi:10.1016/S0304-4165(03)00095-3.
- Gollapudi SR, Telikepalli H, Keshavarz-Shokri A, Vander Velde D, Mitscher LA, Glepidotin C. a minor antimicrobial bibenzyl from Glycyrrhiza lepidota. Phytochemistry. 1989;28:3556–3557. doi:10.1016/0031-9422(89)80394-2.
- Rao MRK, Anisha G. Preliminary phytochemical and GC MS study of one medicinal plant Carissa spinarum. Indo Am J Pharamaceutical Res. 2018;8:414–421.
- Olennikov DN, Kashchenko NI, Chirikova NK, Tankhaeva LM. Iridoids and flavonoids of four Siberian gentians: chemical profile and gastric stimulatory effect. Molecules. 2015;20:19172–19188. doi:10.3390/molecules201019172.
- Verma V, Ravindran P, Kumar PP. Plant hormone-mediated regulation of stress responses. BMC Plant Biol. 2016;16:86. doi:10.1186/s12870-016-0796-2.
- Masi A, Trentin AR, Agrawal GK, Rakwal R. Gamma-glutamyl cycle in plants: a bridge connecting the environment to the plant cell? Front Plant Sci. 2015;6:252. doi:10.3389/fpls.2015.00252.
- Lee KS, Park SN. Cytoprotective effects and mechanisms of quercetin, quercitrin and avicularin isolated from Lespedeza cuneata G. Don against ROS-induced cellular damage. J Ind Eng Chem. 2019;71:160–166.
- Ruijters EJ, Weseler AR, Kicken C, Haenen GR, Bast A. The flavanol (-)-epicatechin and its metabolites protect against oxidative stress in primary endothelial cells via a direct antioxidant effect. Eur J Pharmacol. 2013;715:147–153. doi:10.1016/j.ejphar.2013.05.029.
- Rapala-Kozik M. Vitamin B1 (thiamine): a cofactor for enzymes involved in the main metabolic pathways and an environmental stress protectant. Advances in botanical research. 2011;58:37–91.
- Lau YS, Tian XY, Huang Y, Murugan D, Achike FI, Mustafa MR. Boldine protects endothelial function in hyperglycemia-induced oxidative stress through an antioxidant mechanism. Biochem Pharmacol. 2013;85:367–375. doi:10.1016/j.bcp.2012.11.010.
- Augustine R, Bisht NC. Biofortification of oilseed Brassica juncea with the anti-cancer compound glucoraphanin by suppressing GSL-ALK gene family. Sci Rep. 2015;5:18005. doi:10.1038/srep18005.
- Basile A, Sorbo S, Spadaro V, Bruno M, Maggio A, Faraone N, Rosselli S. Antimicrobial and antioxidant activities of coumarins from the roots of Ferulago campestris (Apiaceae). Molecules. 2009;14:939–952. doi:10.3390/molecules14030939.
- Seo S, Nakaho K, Hong SW, Takahashi H, Shigemori H, Mitsuhara I. l-Histidine induces resistance in plants to the bacterial pathogen Ralstonia solanacearum partially through the activation of ethylene signaling. Plant Cell Physiol. 2016;57:1932–1942. doi:10.1093/pcp/pcw114.
- Stifel FB, Herman RH. Histidine metabolism. Am J Clin Nutr. 1971;24:207–217. doi:10.1093/ajcn/24.2.207.
- Sawers G. Amino acid degradation. In: eLS. John Wiley & Sons, Ltd. 2001.
- Xu S, Hu C, Hussain S, Tan Q, Wu S, Sun X. Metabolomics analysis reveals potential mechanisms of tolerance to excess molybdenum in soybean seedlings. Ecotoxicol Environ Saf. 2018;164:589–596. doi:10.1016/j.ecoenv.2018.08.062.
- Gülçin İ, Elias R, Gepdiremen A, Chea A, Topal F. Antioxidant activity of bisbenzylisoquinoline alkaloids from Stephania rotunda: cepharanthine and fangchinoline. J Enzyme Inhib Med Chem. 2010;25:44–53. doi:10.3109/14756360902932792.
- Thakur R, Jain M, Hruban L, Šantavý F. Terephthalic acid and its methyl esters from Zizyphus sativa. Planta Med. 1975;28:172–173. doi:10.1055/s-0028-1097847.
- Bai R, Ma F, Liang D, Zhao X. Phthalic acid induces oxidative stress and alters the activity of some antioxidant enzymes in roots of Malus prunifolia. J Chem Ecol. 2009;35:488–494. doi:10.1007/s10886-009-9615-7.
- Maher MC, Lim JY, Gunawan C, Cegelski L. Cell-based high-throughput screening identifies rifapentine as an inhibitor of amyloid and biofilm formation in Escherichia coli. ACS Infect Dis. 2015;1:460–468. doi:10.1021/acsinfecdis.5b00055.
- Peng H, Deng Z, Chen X, Sun Y, Zhang B, Li H. Major chemical constituents and antioxidant activities of different extracts from the peduncles of Hovenia acerba Lindl. Int J Food Prop. 2018;21:2135–2155. doi:10.1080/10942912.2018.1497059.
- Kessler G, ELIZABETH I, NEUFELD DSF, Hassid W. Metabolism of &lucuronic acid and d-galacturonic acid by phaseolus aureus seedlings; 1961;236:308–312.
- Jain M, Nagar P, Sharma A, Batth R, Aggarwal S, Kumari S, Mustafiz A. GLYI and D-LDH play key role in methylglyoxal detoxification and abiotic stress tolerance. Sci Rep. 2018;8:5451. doi:10.1038/s41598-018-23806-4.
- Popova TN, de Carvalho MÂAP. Citrate and isocitrate in plant metabolism. Biochim et Biophys Acta (BBA) Bioenerg. 1998;1364:307–325. doi:10.1016/S0005-2728(98)00008-5.
- Liu Y, Wu Z, Feng S, Yang X, Huang D. Hormesis of glyceollin I, an induced phytoalexin from soybean, on budding yeast chronological lifespan extension. Molecules. 2014;19:568–580. doi:10.3390/molecules19010568.
- Kraus RJ, Ganther HE. Reaction of cyanide with glutathione peroxidase. Biochem Biophys Res Commun. 1980;96:1116–1122. doi:10.1016/0006-291x(80)90067-4.
- Taguri T, Tanaka T, Kouno I. Antimicrobial activity of 10 different plant polyphenols against bacteria causing food-borne disease. Biol Pharm Bull. 2004;27:1965–1969. doi:10.1248/bpb.27.1965.
- Welti R, Li W, Li M, Sang Y, Biesiada H, Zhou H-E, Rajashekar C, Williams TD, Wang X. Profiling membrane lipids in plant stress responses role of phospholipase Dα in freezing-induced lipid changes in Arabidopsis. J Biol Chem. 2002;277:31994–32002. doi:10.1074/jbc.M205375200.
- Yi H, Juergens M, Jez JM. Structure of soybean β-cyanoalanine synthase and the molecular basis for cyanide detoxification in plants. Plant Cell. 2012; tpc. 112.098954. doi:10.1105/tpc.112.098954.
- Chinnusamy V, Jagendorf A, Zhu J-K. Understanding and improving salt tolerance in plants. Crop Sci. 2005;45:437–448. doi:10.2135/cropsci2005.0437.
- Fleck AT, Schulze S, Hinrichs M, Specht A, Waßmann F, Schreiber L, Schenk MK. Silicon promotes exodermal Casparian band formation in Si-accumulating and Si-excluding species by forming phenol complexes. PLoS One. 2015;10:e0138555. doi:10.1371/journal.pone.0138555.
- Raschke M, Boycheva S, Crèvecoeur M, Nunes-Nesi A, Witt S, Fernie AR, Amrhein N, Fitzpatrick TB. Enhanced levels of vitamin B6 increase aerial organ size and positively affect stress tolerance in Arabidopsis. Plant J. 2011;66:414–432. doi:doi:10.1111/j.1365-313X.2011.04499.x.
- Mooney S, Leuendorf J-E, Hendrickson C, Hellmann H. Vitamin B6: a long known compound of surprising complexity. Molecules. 2009;14:329–351. doi:10.3390/molecules14010329.
- Larson RA. Plant defenses against oxidative stress. Arch Insect Biochem Physiol. 1995;29:175–186. doi:10.1002/arch.940290207.
- Ishitani M, Liu J, Halfter U, Kim C-S, Shi W, Zhu J-K. SOS3 function in plant salt tolerance requires N-Myristoylation and calcium binding. Plant Cell. 2000;12:1667. doi:10.2307/3871181.
- Dewhirst RA, Fry SC. The oxidation of dehydroascorbic acid and 2, 3-diketogulonate by distinct reactive oxygen species. Biochem J. 2018;475:3451–3470. doi:10.1042/BCJ20180688.
- Parsons HT, Fry SC. Oxidation of dehydroascorbic acid and 2, 3-diketogulonate under plant apoplastic conditions. Phytochemistry. 2012;75:41–49. doi:10.1016/j.phytochem.2011.12.005.
- Kärkönen A, Dewhirst RA, Mackay CL, Fry SC. Metabolites of 2, 3-diketogulonate delay peroxidase action and induce non-enzymic H2O2 generation: potential roles in the plant cell wall. Arch Biochem Biophys. 2017;620:12–22. doi:10.1016/j.abb.2017.03.006.
- Tan R, Wolfender J-L, Ma W, Zhang L, Hostettmann K. Secoiridoids and antifungal aromatic acids from gentiana algida. Phytochemistry. 1996;41:111–116. doi:10.1016/0031-9422(95)00599-4.
- Bednarek P, Piślewska-Bednarek M, Svatoš A, Schneider B, Doubský J, Mansurova M, Humphry M, Consonni C, Panstruga R, Sanchez-Vallet A. A glucosinolate metabolism pathway in living plant cells mediates broad-spectrum antifungal defense. Science. 2009;323:101–106. doi:10.1126/science.1163732.
- Rivas-San Vicente M, Plasencia J. Salicylic acid beyond defence: its role in plant growth and development. J Exp Bot. 2011;62:3321–3338. doi:10.1093/jxb/err031.
- Alhousari F, Greger M. Silicon and mechanisms of plant resistance to insect pests. Plants. 2018;7:33. doi:10.3390/plants7020033.
- Muniyan R, Gurunathan J. Antimycobacterial activity of potential plant metabolites with emphasis on management of drug resistant Mycobacterium tuberculosis strains. Res J Biotechnol. 2017;12:12.
- Gutiérrez-Coronado MA, Trejo-López C, Larqué-Saavedra A. Effects of salicylic acid on the growth of roots and shoots in soybean. Plant Physiol Biochem. 1998;36:563–565. doi:10.1016/S0981-9428(98)80003-X.
- Perlikowski D, Czyżniejewski M, Marczak Ł, Augustyniak A, Kosmala A. Water deficit affects primary metabolism differently in two Lolium multiflorum/Festuca arundinacea introgression forms with a distinct capacity for photosynthesis and membrane regeneration. Front Plant Sci. 2016;7:1063. doi:10.3389/fpls.2016.01063.
- Bohnert HJ, Jensen RG. Strategies for engineering water-stress tolerance in plants. Trends Biotechnol. 1996;14:89–97. doi:10.1016/0167-7799(96)80929-2.
- McManus MT, Bieleski RL, Caradus JR, Barker DJ. Pinitol accumulation in mature leaves of white clover in response to a water deficit. Environ Exp Bot. 2000;43:11–18. doi:10.1016/S0098-8472(99)00041-6.
- Wang S, Uddin MI, Tanaka K, Yin L, Shi Z, Qi Y, Mano JI, Matsui K, Shimomura N, Sakaki T. Maintenance of chloroplast structure and function by overexpression of the rice MONOGALACTOSYLDIACYLGLYCEROL SYNTHASE gene leads to enhanced salt tolerance in tobacco. Plant Physiol. 2014;165:1144–1155. doi:10.1104/pp.114.238899.
- Leterrier M, Chaki M, Airaki M, Valderrama R, Palma JM, Barroso JB, Corpas FJ. Function of S-nitrosoglutathione reductase (GSNOR) in plant development and under biotic/abiotic stress. Plant Signal Behav. 2011;6:789–793. doi:10.4161/psb.6.6.15161.
- Grossmann K. A role for cyanide, derived from ethylene biosynthesis, in the development of stress symptoms. Physiol Plant. 1996;97:772–775. doi:10.1111/ppl.1996.97.issue-4.
- Yin L, Wang S, Liu P, Wang W, Cao D, Deng X, Zhang S. Silicon-mediated changes in polyamine and 1-aminocyclopropane-1-carboxylic acid are involved in silicon-induced drought resistance in Sorghum bicolor L. Plant Physiol Biochem. 2014;80:268–277. doi:10.1016/j.plaphy.2014.04.014.
- Mostofa MG, Ghosh A, Li Z-G, Siddiqui MN, Fujita M, Tran L-SP. Methylglyoxal–a signaling molecule in plant abiotic stress responses. Free Radical Biol Med. 2018;122:96–109. doi:10.1016/j.freeradbiomed.2018.03.009.
- Borysiuk K, Ostaszewska-Bugajska M, Vaultier M-N, Hasenfratz-Sauder M-P, Szal B. Enhanced formation of methylglyoxal-derived advanced glycation end products in Arabidopsis under ammonium nutrition. Front Plant Sci. 2018:9. doi:10.3389/fpls.2018.00667.
- Noctor G, Mhamdi A, Chaouch S, Han Y, Neukermans J, Marquez‐Garcia B, Queval G, Foyer CH. Glutathione in plants: an integrated overview. Plant Cell Environ. 2012;35:454–484. doi:10.1111/j.1365-3040.2011.02400.x.