
 ?Mathematical formulae have been encoded as MathML and are displayed in this HTML version using MathJax in order to improve their display. Uncheck the box to turn MathJax off. This feature requires Javascript. Click on a formula to zoom.
ABSTRACT
Iron toxicity stress causes physiological and metabolic changes in rice and other plants. To date, there is little information about the metabolite profile of rice under Fe toxicity conditions. In fact, metabolite has a contribution to the physiological condition of plants. Plant metabolomics is a study of low-molecular weight metabolites in plants under certain conditions. The objective of the research was to investigate physiological and metabolic changes in rice under Fe toxicity stress. Two-week-old seedlings of four rice varieties with various Fe toxicity tolerance levels were stressed hydroponically with 400 ppm FeSO4.7H2O for 10 d. Numerous physiological characters were observed and untargeted metabolomic analysis was carried out using gas chromatography-mass spectrophotometry (GC-MS). The results showed Fe toxicity induced physiological and metabolite variation in rice. By comparing the metabolites synthesized in Fe toxicity-stressed plants with control plants, it showed that elaidic acid, linoleic acid, and linolenic acid could be as metabolite marker candidates for rice response to Fe toxicity stress. When plants exposed to Fe toxicity stress, elaidic acid increased, whereas linoleic- and linolenic acid decreased. The alteration of fatty acid composition in the root and shoot suggests the alteration of metabolites is one of the tolerance strategies of rice to Fe toxicity stress. This finding offers an insight about the tolerance strategies of rice under Fe toxicity stress related to the maintenance process of the cell membranes during this stress. The genes underlying biosynthesis of the fatty acid could be a target of future research on responsible genes for Fe toxicity tolerance in rice.
Introduction
Rice (Oryza sativa L.) is an important staple food in Asia, particularly in Indonesia. However, the decreasing area of arable land for rice field forces Indonesian farmers to use marginal land including swampy lands to cultivate rice.1 High-soluble iron (Fe) ion that is toxic to rice is a major problem in swampy lands.Citation2–Citation4 Bronzing of the rice leaf blades is a general symptom of Fe toxicity, which has a consequence to inhibit rice growth and decrease yield.
Plant strategies to tolerate Fe toxicity stress have been explored and they involve complex processes.Citation5 Three hypotheses have been proposed regarding the plant strategies to dealing with Fe toxicity stress, i.e. increasing oxidation power in the rhizosphere to oxidize Fe2+ to Fe3+, accumulation of Fe in cells through compartmentation, and detoxification of reactive oxygen species (ROS) produced from Fe toxicity through enzymatic and non-enzymatic reactions.Citation5–Citation7 Superoxide dismutase, catalase (CAT), ascorbate peroxidase, monodehydroascorbate reductase, dehydroascorbate reductase, glutathione reductase (GR), and guaiacol peroxidase (GPX) were the antioxidative enzymes that involve in the enzymatic detoxification of ROS, while ascorbic acid, reduced glutathione reductase (GSH), α-tocopherol, carotenoids, phenolics, flavonoids, and amino acid were the antioxidant compounds that involved in non-enzymatic detoxification of ROS.Citation8 However, the strategies of rice varieties to tolerate Fe toxicity stress are still not very well understood.
Numerous reports on Fe toxicity stress in plant and/or their tolerance strategies have been published in corn,Citation9 British native fen plant species (Eriophorum angustifolium, Carex lepidocarpa, Lotus uliginosus, Lychnis flos-cuculi, etc),Citation10 Tagetes erecta,Citation11 Glyceria fluitans,Citation12 and hexaploid wheat.Citation13 In addition, numerous studies on Fe tolerance strategies in rice have also been reported.Citation6,Citation7,Citation14–Citation18 However, to the best of our knowledge, there are limited studies that explore the change of metabolite profile and their roles in response to Fe toxicity stress in rice.
Numerous previous studies investigating the physiological impacts of Fe stress in plants have been reported. However, most studies focused on the variety of tolerance strategies. Based on the leaf bronzing levels and leaf Fe concentrations, for example, plants have been classified either into includers or excluders.Citation6 However, the differences in such strategies still require clarification to reveal detailed mechanisms.
Responses of plants to stress conditions are complex and the processes require interactions among multiple metabolites. Metabolite compositions in plants are likely to vary and be altered under different physiological and environmental conditions. Metabolite compositions could also reflect different genetic backgrounds.Citation19 Metabolomics refers to studies aimed at identifying and quantifying metabolites in organisms under specific conditions.Citation20,Citation21 It has been widely applied as a tool for studying organisms exposed to varying abiotic stresses.Citation22,Citation23 Metabolomics studies could facilitate the elucidation of the biochemical outcomes of the genotypic differences of rice under Fe stress conditions. In the present study, therefore, we evaluated physiological changes in rice under Fe toxicity stress in hydroponic environment using shoot and root relative growth rate (RGR), Fe toxicity stress level on the basis of leaf bronzing score, chlorophyll content, shoot and root malondialdehyde (MDA) content, and metabolite profiling using gas chromatography-mass spectrophotometry (GC-MS). The objective of the study was to investigate the physiological and metabolic changes in rice under Fe toxicity stress. In this study, we also identified some metabolite marker candidates of rice in response to Fe toxicity stress. The finding could be useful for trait improvement in the rice breeding program, especially to Fe toxicity stress. The study is also valuable and will give a significant contribution to the development of rice sciences.
Materials and methods
Plant materials and experiment conditions
Four rice varieties, i.e. IR64, Inpara 5, Inpara 2, and Pokkali were used in the present study. Rice var. IR64 and Inpara 5 are categorized as highly sensitive to Fe toxicity stress, Inpara 2 is categorized as moderately tolerant to Fe toxicity stress, and Pokkali is categorized as tolerant to Fe toxicity stress.
The seeds were surface-sterilized with 1% (v/v) sodium hypochlorite solution for 15 min and rinsed with distilled water. The seeds were germinated in the incubator (27°C) and dark conditions. The seedlings were transferred to a container (35 × 28.5 × 12 cm3) and filled with 8 L half-strength Yoshida’s solution (pH = 4.0)Citation24 for 2 weeks and the solution was renewed every week. Two-week-old seedlings were grown on the other container (35 × 28.5 × 12 cm3) containing 8 L half-strength Yoshida’s solution (pH = 4.0). In each nutrient culture solution, 0.2% (g/v) agar was added according to Nugraha et al.,Citation25 and Turhadi,Citation26 to prevent the excessive oxidation of Fe. Two types of treatments (0 ppm as control and 400 ppm Fe in the form of FeSO4.7H2O as Fe toxicity stress condition) were applied to 2-week-old seedlings in that container for 10 d using a randomized complete design with three replications of each treatment. Each container contains 90 individuals of 2-week-old rice seedlings. The containers were then placed in a controlled place at 29–31°C and 80% relative humidity with 12-h daylight period. Seedlings were harvested at 10 d after stress treatment and kept frozen using liquid N2 and stored at −80°C until further analysis of metabolite extraction.
RGR determination
Ten days following treatment, the RGRs of plants were determined on the basis of dry weight following the formula by Mongon et al.Citation27 The dry weights of roots and shoots were determined after drying the samples at 80°C for 72 h.
Leaf bronzing score determination
Determination of leaf bronzing was conducted to investigate the stress levels in rice plants after 10 d of treatment. The symptoms were converted into a scale of 1–9 according to Turhadi,Citation26 and the standard evaluation system for rice.Citation28
Leaf chlorophyll content determination
Leaf chlorophyll was extracted following the method by Quinet et al.Citation18 Briefly, the chlorophyll pigments were extracted from leaves of treated plants (100 mg) using 10 ml of 80% (v/v) acetone. The absorbance value of the extract was read at 663 and 646 nm using a spectrophotometer. Chlorophyll contents were determined on the basis of the formula developed by Lichtenthaler.Citation29
Lipid peroxidation level determination
Lipid peroxidation levels in roots and leaves were determined by measuring MDA contents. MDA extraction was performed according to Muller et al.,Citation30 with minor modifications. Briefly, MDA was extracted from the fresh root and/shoot (0.5 g) of treated plants using 5 ml of 0.1% (g/v) trichloroacetic acid (TCA). The extracts were centrifuged at 3000 g for 25 min. After centrifugation, 2 ml of 0.5% thiobarbituric acid (TBA): 20% TCA solution was added to 3 ml extract’s supernatant. The samples were incubated in a water bath (85°C) for 30 min, and reactions were stopped at room temperature. The absorbance of the extract was read at 450, 532, and 600 nm using a spectrophotometer. MDA content was determined on the basis of the formula developed by Wang et al.Citation31
Metabolite extraction
Separated frozen root and shoot tissues were used in the metabolite extraction. The metabolites were extracted using absolute ethanol at 25°C for 5 d (1 g sample:10 ml solvent).Citation32 The extracts were then evaporated at 45°C using a turbo vap evaporator (Caliper LifeScience, USA) for 1 h.
Gas chromatography-mass spectrometry (GC-MS) analysis
The extracts (5 µl) were injected in a GC-MS (Model 7890, Agilent technologies, Palo Alto, CA, USA) equipped with an autosampler (Model 7693, Agilent Technologies, Palo Alto, CA, USA), which were connected to a Mass Selective Detector and a Chemstation Data System (Model 5975C inert MSD with Triple-Axis Detector, Agilent Technologies, Palo Alto, CA, USA). The HP ultra 2 column capillary (0.11 µm) was used in this analysis. The instrument for analysis was set as follows: injection temperature (250°C), ion source temperature (230°C), interface temperature (280°C), and quadrupole temperature (140°C). Helium was used as carrier gas with a flow rate of 1.2 ml/min. The mass spectrum was detected in a mass-to-charge range of 20–500 m/z. Metabolite identification was performed based on the Wiley W8N08.L database.
Data analysis
The obtained metabolites were identified for their group compound based on online databases, i.e. ChemSpider (http://www.chemspider.com/), Pubchem (https://pubchem.ncbi. nlm.nih.gov/), Kyoto Encyclopedia of Genes and Genomes (KEGG) Pathway Database (http://www.genome.jp/kegg/pathway.html), The Human Metabolome Database (HMDB) (http://www.hmdb.ca/), LIPID MAPS (http://www.lipidmaps.org/), and CAMEO (https://cameochemicals.noaa.gov/).
The metabolite data were analyzed using univariate and multivariate analysis using MetaboAnalyst 4.0Citation33 and SPSS version 16.0 (SPSS Inc., Chicago, IL, USA) to identify metabolite markers for Fe toxicity stress response in rice. In this research, we also used heatmap clustering analysis (HCA), principal component analysis (PCA), partial least square-discriminant analysis (PLS-DA), biplot analysis, VIP score analysis, and analysis of variance (ANOVA) to determine the most important metabolite markers that can differentiate between the two Fe toxicity treatments.Citation34 The morpho-physiological data were analyzed using ANOVA to determine the significant effect of the treatment on the morpho-physiological variables observed in this experiment. The correlation analysis was also performed using corrplot package in R-program to reveal the relationship between morpho-physiological data and metabolite marker candidates for Fe toxicity stress response in rice. The Venn diagram was produced using VENNY 2.1 (https://bioinfogp.cnb.csic.es/tools/venny/). The graphs and images were prepared using CorelDRAW X6 (Corel Corporation).
Results
Growth and physiological responses of four rice varieties under Fe stress
Following a 10-d exposure to 400 ppm of Fe, there was a reduction in both root and shoot growth rates of the four rice varieties (IR64, Inpara 5, Inpara 2, and Pokkali) compared to the control treatment. Both root and shoot growth rates of IR64 and Inpara 5 were lower than that of Inpara 2 and Pokkali (,)). The reduction of root growth of IR64, Inpara 5, Inpara 2, and Pokkali were 68%, 71%, 20%, and 48%, respectively, while the reduction of shoot growth of IR64, Inpara 5, Inpara 2, and Pokkali were 59%, 50%, 47%, and 27%, respectively. Fe stress treatment also led to the bronzing of the leaves. The leaf bronzing scores in IR64 and Inpara 5 were higher than that of Inpara 2 and Pokkali ()).
Figure 1. The effect of Fe toxicity stress on growth rate (a–b), leaf bronzing score (c), chlorophyll content (d), and malondialdehyde (MDA) (e–f) in four rice varieties. Bars represent standard error. Control = 0 ppm FeSO4.7H2O; Fe = 400 ppm FeSO4.7H2O.
Iron toxicity stress also caused a decrease in leaf chlorophyll content ()). The decreasing of chlorophyll content in IR64, Inpara 5, Inpara 2, and Pokkali were 30%, 56%, 37%, and 19%, respectively. Fe toxicity stress induced lipid peroxidation of both root and shoot, which were indicated by the increasing MDA content (,)). The increasing of root MDA content in IR64, Inpara 5, Inpara 2, and Pokkali were 102%, 71%, 38%, and 5%, respectively, while the increasing of shoot MDA content in IR64, Inpara 5, Inpara 2, and Pokkali were 264%, 120%, 29%, and 18%, respectively. In both root and shoot, rice var. Pokkali shows the least increasing level of lipid peroxidation compared to the other rice varieties.
Metabolite profiles of four rice varieties under Fe toxicity stress
In the present study, 163 metabolites were detected by untargeted metabolomic analysis using GC-MS. In the roots, 87 metabolites were detected, while in the shoots, 113 metabolites were detected. Thirty-seven metabolites were detected in both root and shoot tissues ()). The highest number of metabolites in roots (39 metabolites) were found in Inpara 2 when grown under control condition, while the most abundant metabolites in shoots (38 metabolites) were found in IR64 when treated with 400 ppm of Fe ()). Based on the metabolite group, the roots were dominated by fatty acid, hydrocarbon, and sterol (), while the shoots were dominated by fatty acid, fatty ester, and sterol ().
Figure 2. The comparison of metabolite in each vegetative organ (a) and each variety (b) under control and Fe toxicity stress. 0 ppm = control; 400 ppm = Fe toxicity stress.
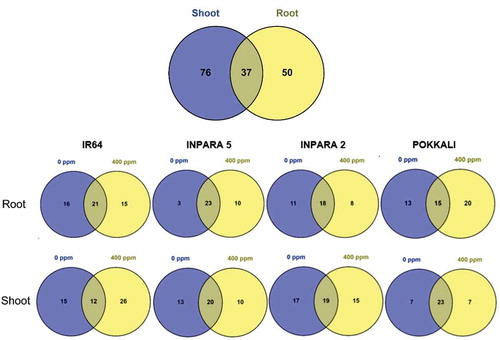
Figure 3. The comparison of metabolite composition of roots and shoots based on its compound group. The categorization based on various databases, i.e. PubChem (https://pubchem.ncbi.nlm.nih.gov/), KEGG Pathway (https://www.genome.jp/kegg/pathway.html), HMDB (http://www.hmdb.ca/), LIPID MAPS (http://lipidmaps.org/data/structure/LMSDSearch.php), CAMEO (https://cameochemicals.noaa.gov/search/simple), ChemSpider (http://www.chemspider.com/).
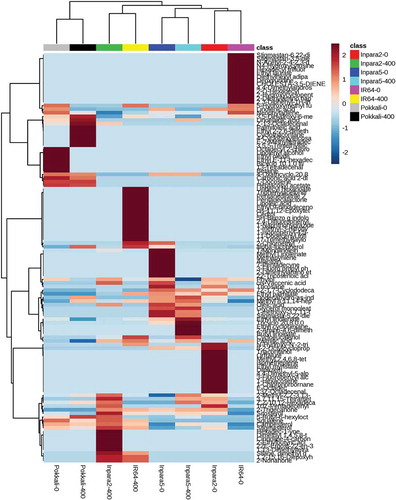
Heatmap clustering analysis of rice varieties based on root metabolites grouped the rice varieties into two main clusters (). Rice var. Inpara 5 treated with both control and Fe toxicity stresses and Pokkali under the Fe toxicity stress treatment showed in the same cluster. Other clusters consisted of IR64 and Inpara 2 treated with both control and Fe toxicity stresses (). Heatmap cluster analysis of rice varieties based on shoot metabolites also grouped the rice varieties into two main clusters (). However, rice var. Pokkali was grouped in a different cluster with other varieties in both control and Fe toxicity stress treatments ().
Figure 4. Heatmap analysis combined with hierarchical clustering analysis of metabolites in the roots of rice under control and Fe toxicity stress. Analysis using normalized data with mean-centered via http://www.metaboanalyst.ca. 0 = 0 ppm (control); 400 = 400 ppm FeSO4.7H2O.
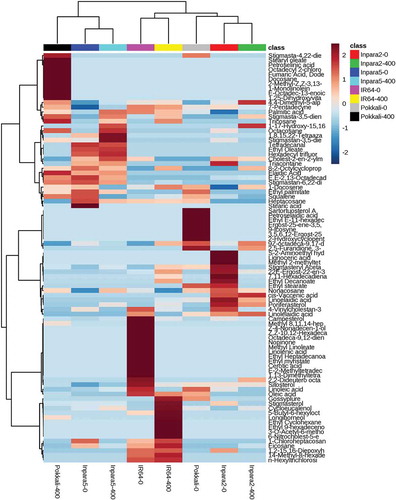
Figure 5. Heatmap analysis combined with hierarchical clustering analysis of metabolites in the shoots of rice under control and Fe toxicity stress. Analysis using normalized data with mean-centered via http://www.metaboanalyst.ca. 0 = 0 ppm (control); 400 = 400 ppm FeSO4.7H2O.
Identification of metabolite marker candidates for Fe toxicity stress response in rice
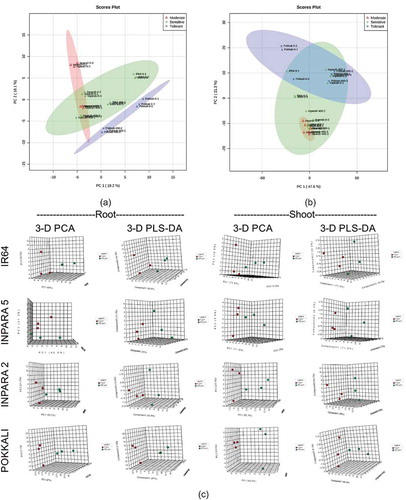
Based on the PCA on metabolite profile of the shoots, Fe tolerant variety (Pokkali) was clearly separated from Fe moderate tolerant (Inpara 2) and sensitive (IR64 and Inpara 5) varieties ()). The different grouping of rice varieties was found when we analyzed root metabolites using the PCA. The root metabolite compositions of all rice varieties were similar ()). Further analysis using PCA and PLS-DA analysis in each variety showed clearly different metabolite profiles between control and Fe toxicity stress-treated plants ()). We used a number of parameters in this study, such as predictive capability of model (Q2), correlation coefficient of model (R2), and model reproducibility (Q2/R2) () to show the PLS-DA model feasibility to differentiate between control and Fe toxicity treatments. The Q2 value showed 0.42–0.95 in the metabolite profile of roots and 0.95–0.98 in the metabolite profile of shoots (). The R2 value showed 0.91–1.00 in the metabolite profile of roots and 1.00 in the metabolite profile of shoots (). The results also showed the Q2/R2 value in line with Q2 value. Generally, all the models showed a Q2/R2 value of more than 0.5, except the roots of Inpara 5 ().
Table 1. Partial least-squares discriminant analysis (PLS-DA) parameter as distinguishing between control and Fe toxicity stress condition in four rice varieties based on their metabolite profile.
Figure 6. The difference of tolerance level of rice based on their metabolite profile in shoot (a), root (b), and each variety (c). The analyses were performed by principal component analysis (PCA) and partial least squares-discriminant analysis (PLS-DA). 0 ppm = control; 400 ppm = Fe toxicity stress.
Biplot and VIP score analyses were done to select the metabolites that can be used to distinguish between control and Fe toxicity-stressed rice varieties. A certain number of root and shoot metabolites ranging from 3 to 16 metabolites are able to differentiate rice response between control and Fe toxicity stresses. Interestingly, rice var. Pokkali has the least (3 metabolites) and the most (16 metabolites) number of differentiating metabolites in its root and shoot, respectively (Figure S1 to S4). Among the differentiating metabolites, the most frequent metabolites that were found in both root and shoot are palmitic acid, elaidic acid, linoleic acid, and linolenic acid.
The selected differentiating metabolites based on each biplot- and VIP score were then screened using ANOVA to obtain the most important metabolites that are significantly affected by Fe toxicity treatment and rice varieties (). Based on the ANOVA analysis, 10 metabolites in root and 12 metabolites in shoot were significantly affected (p-value < .05) by Fe toxicity stress and rice varieties, except for palmitic acid in root ().
Table 2. The significant level of each selected metabolites to the given treatments.
Fatty acid biosynthesis and linoleic acid metabolism in root that involve elaidic acid, palmitic acid, and linoleic acid showed significant (p-value < .05) (), while alpha-linolenic acid metabolism in shoot that involves linolenic acid also showed significant (p-value < .05) detected in this research ().
Table 3. Pathway analysis between tissues and rice varieties based on the selected metabolites to the given treatments.
Elaidic acid showed a high concentration in rice var. Inpara 5 and Pokkali when they were stressed with Fe toxicity ()), while linoleic acid and linolenic acid decreased significantly in all rice varieties when they were stressed with Fe toxicity, except for linoleic acid in Inpara 5 (,)). Based on the results, we propose elaidic acid and linoleic acid in root tissue and linolenic acid in shoot tissue as metabolite marker candidates for Fe toxicity stress response in rice.
Figure 7. The comparison of elaidic acid in root (a), linoleic acid in root (b), and linolenic acid in shoot (c) between control and Fe toxicity stress. 0 ppm = control; 400 ppm = Fe toxicity stress. Bars represent standard error.
The correlation between morpho-physiological responses and metabolite marker candidates of Fe toxicity stress in rice
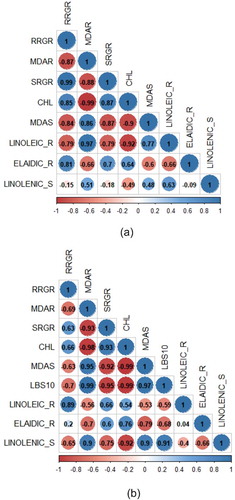
The proposed metabolite marker candidates were analyzed for the correlation with morpho-physiological data from all rice varieties of each stress treatment. The elaidic acid was positively correlated with leaf chlorophyll content (r = 0.64), root RGR (r = 0.81), shoot RGR (r = 0.70) in control condition ()) as well as with leaf chlorophyll content (r = 0.76) and shoot RGR (r = 0.60) under Fe toxicity stress ()). In relation to MDA content in root and shoot under Fe toxicity, the linoleic acid was negatively correlated with root MDA ()), while linolenic acid was positively correlated with shoot MDA ()).
Figure 8. The correlation analysis between morpho-physiological responses and fatty acid (elaidic-, linoleic-, and linolenic acid) concentration in control (a) and Fe toxicity stress (b). RRGR = root growth rate; MDAR = MDA concentration in root; SRGR = shoot growth rate; CHL = chlorophyll; MDAS = MDA concentration in shoot; LBS10 = leaf bronzing score 10 d after treatment; LINOLEIC_R = linoleic acid concentration in root; ELAIDIC_R = elaidic acid concentration in root; LINOLENIC_S = linolenic acid concentration in shoot.
Discussion
High levels of Fe in agricultural soils, particularly in swampy lands, have adversely affected crop growth and productivity. Previous studies consider rice vars. IR64 and Inpara 5 as sensitive varieties to Fe toxicity stress,Citation35,Citation36 Inpara 2 is categorized as a moderate tolerant variety to Fe toxicity stress,Citation36 while Pokkali is categorized as a tolerant variety.Citation17,Citation35–Citation37 Fe toxicity stress disturbs metabolisms in plant, which is manifested as the formation of leaf bronzing that causes a reduction in plant growth and yield.Citation6,Citation27,Citation36,Citation38
The bronzing symptom begins at the tips of the oldest leaves and spreads throughout the leaves.Citation17,Citation36 Bronzing is a complex process attributed to the presence of brown pigment (melanin) and chlorophyll degradation associated with senescence.Citation39 The brown pigment that is produced in bronzing is associated with oxidized phenol compounds. This process involves the polyphenol oxidase enzyme.Citation40 The bronzing severity that can be scored using a standard system represents the stress level of Fe toxicity stress. In this research, the bronzing score is shown in ). The LBS10 had a strong negative correlation with chlorophyll content ()). A decrease in chlorophyll content under Fe toxicity stress treatment was also observed by Quinet et al.,Citation18 in rice plants that were exposed to 300 ppm Fe for 3 d and 3 weeks. Decreasing chlorophyll content suggests a decrease in chlorophyll biosynthesis and photosynthetic rate.Citation18 The leaf chlorophyll content is also negatively correlated with MDA content ()). The increase in MDA concentration in plant tissues following Fe toxicity stress is an indicator of lipid peroxidation in the cells. Lipid peroxidation occurs due to the presence of free radicals (ROS) that arise following the plant exposure to stress.Citation41 ROS production could occur under Fe toxicity stress through two types of chemical reactions, i.e. oxidation of Fe2+ into Fe3+ and produces , and Fenton’s reactions that produce OH. when Fe2+ reacts with H2O2.Citation42
As a consequence of gene expression, metabolites are considered capable to describe the biochemical conditions of an organism due to the influence of external stimuli.Citation43 Previous studies report the Fe toxicity stress affects the activity of various genes and enzymes in rice. The activity of genes in the transcriptomic level is needed for homeostasis mechanism, transport, and survival under Fe toxicity stress conditionCitation18,Citation44–Citation46 and the regulation of gene expression will affect the metabolism in rice. Various genes in rice, e.g. Os03t0140200-01 (cytochrome p450 86b1-like), ATP synthase cf1 beta subunit (Os10t0355800-00 and Os12t0207500-00), Os08t0561700-01 (superoxide dismutase), Os04t0438300-01 (stress-response protein nst1 isoform × 2), Os09t0474300-01 (chaperone protein htpg family protein), and Os01t021240001 (drought-induced protein rdi), and several chloroplast-related genes were upregulated during Fe toxicity stress.Citation44 Under Fe toxicity stress, rice genes OsNAS1, OsNAS2, OsNAAT1, OsDMAS1, TOM1, OsYSL15, OsNRAMP1, OsIRT1, OsIRT2, and OsIRO2 were down-regulated and two Fe-storage genes (OsVIT2 and OSFER) were upregulated, which is probably to prevent Fe toxicity.Citation18,Citation46 Moreover, several genes that are involved in secondary metabolism, e.g. metabolism of secondary products derived from L-phenylalanine and L-tyrosine, metabolism of flavonoids and metabolism of porphyrins, are also upregulated after Fe toxicity stress in rice.Citation18 To the best of our knowledge, our report is the first report on a metabolomic study in rice under Fe toxicity stress. In this research, we show the metabolite profile of rice under Fe toxicity stress treatment (–). Moreover, we also show the metabolite variation in rice among tolerant, moderate, and sensitive varieties to Fe toxicity stress. The variation depends on the tolerance level of a rice variety to Fe toxicity stress.
Certain metabolites, i.e. elaidic-, linoleic-, and linolenic acid are proposed as marker candidates for Fe toxicity stress response in rice. The three metabolites were categorized as fatty acid, which are lipid-derived compounds that can be a component of the cell membrane. The finding suggests the alteration of the fatty acid concentration during Fe toxicity stress is required to maintain the membrane fluidity and its permeability. Various lipids play a role in mediating plant growth and development as a response to biotic and abiotic stresses.Citation47 Zhang et al.Citation48 showed that the nonselective cation channels (NSCCs) mediated potassium (K+) efflux could also be involved in plant tolerance to excessive Fe. ROS activates NSCCs and resulting in K+ loss from the cell. Based on our result, a variation of fatty acid might play an important role in maintaining cell membrane fluidity to maintain K+ homeostasis for rice tolerance to Fe toxicity stress. Previous research reported that there was a correlation between K+ homeostasis and primary root growth and lateral root formation of Arabidopsis thaliana under excess Fe.Citation49
Oxidative stress by Fe toxicity stress led to the formation of free radicals that damage important biomolecules, such as proteins and lipids. As a membrane component, lipids also play a role to deal with environmental stimuli. Elaidic acid, an unsaturated fatty acid, is trans-isomeric of oleic acid and has been reported as one of the membrane components.Citation17 The elaidic acid showed a high concentration in Pokkali, a rice tolerant variety to Fe toxicity stress ()). Conversely, both linoleic- and linolenic acid showed low concentration under Fe toxicity stress in almost all rice variety tested (,c)).
Several reports have shown the change in fatty acid concentration in plant tissues during stress condition. Li et al.Citation50 showed that the precursors of linoleic- and linolenic acid, i.e. palmitic-, stearic-, and oleic acid, decrease their concentration in Camellia japonica leaves during acclimatization in low temperature, while the degree of unsaturation of fatty acid increased. Low-temperature stress causes changes in fatty acid composition in many plants.Citation51,Citation52 Cadmium (Cd) and Copper (Cu) stress in the tomato (Lycopersicon esculentum Mill. cv. 63/5 F1) induced lipid biosynthesis disturbance and cell integrity lost.Citation53 Cd toxicity interfered the fatty acid biosynthesis as indicated by decreasing the concentration of linolenic acid and increasing the concentration of palmitic-, stearic-, and oleic acid in the leaves of tomato plants.Citation54 Morsy et al.Citation55 also reported that there was a decrease in unsaturated fatty acids (oleic-, linoleic-, and eicocenic acid) and an increase in saturated fatty acids (myristic- and palmitic acid) in the Zygophyllum album and Zygophyllum coccineum when growing on the soil containing pollution (Fe, Zn, Cu, and Al). Changes in the lipid component may function to maintain the integrity of cell membranes when exposed by heavy metals. Barley (Hordeum vulgare L.) plant also shows changes of lipid unsaturation level due to an increase in linolenic-, linoleic-, and oleic acid, and also a decrease in stearic acid concentration under salinity stress, which suggests the change in lipid concentration plays an important role in maintaining cell membrane fluidity during salinity stress.Citation56
The variation among fatty acid in this study indicated the changes' composition between elaidic-, linoleic-, and linolenic acid might have the benefit to develop the tolerance strategies by maintaining the cell membrane integrity in rice. Fatty acid, especially linoleic acid, also correlated with an antioxidant enzyme in mitigating Fe toxicity stress in plants. The increase in linoleic acid concentration in root is aimed to mitigate the Fe toxicity stress in rice as indicated as a negative correlation with MDA content ()). The alteration in fatty acid composition in thylakoid membranes can lower oxidative stress, improve photosynthetic rates, PS-II efficiency in tobacco (Nicotiana benthamiana) under high temperature.Citation57 The findings are expected to be useful in the genetic improvement of rice under Fe toxicity stress. However, further study is needed to elucidate the role of cell membrane in tolerance mechanisms to Fe toxicity stress condition.
Conclusions
Iron (Fe) toxicity stress induces a variation of physiological responses and metabolite profile in rice. The change in elaidic acid, linoleic acid, and linolenic acid concentration during Fe toxicity stress could be used as metabolite marker candidates of rice response to Fe toxicity stress. Thus, the fatty acid composition might determine the sensitivity of rice to Fe toxicity stress. Further study in elucidating the role of cell membrane integrity to Fe tolerance mechanisms is required.
Disclosure of potential conflicts of interest
The authors report no conflict of interest.
Acknowledgments
We thank Rina Rahayuningsih and team (LABKESDA, DKI Jakarta) for their guidance in metabolite detection using the GC-MS instrument.
Additional information
Funding
References
- Utama ZH. Rice cultivation on marginal land: tips on increasing rice production. Yogyakarta (Indonesia): Andi; 2015.
- Ritung S, Suryani E, Subardja D, Sukarman NK, Suparto H, Mulyani A, Tafakresnanto C, Sulaeman Y, Subandiono RE, Wahyunto, et al. Agricultural land resources of indonesia: area, distribution, and potential availability. Jakarta (Indonesia): IAARD Pr; 2015
- Suhartatik E, Makarim AK. Nutrient needs of rice in swampy land. JPPTP. 2009;28:1–12.
- Kirk GJD. The biogeochemistry of submerged soils. Chichester (England): J Wiley; 2004.
- Becker M, Asch F. Iron toxicity in rice: conditions and management concepts. J Plant Nutr Soil Sci. 2005;168:558–573. doi:10.1002/jpln.200520504.
- Engel K, Asch F, Becker M. Classification of rice genotypes based on their mechanisms of adaptation to iron toxicity. J Plant Nutr Soil Sci. 2012;175:871–881. doi:10.1002/jpln.201100421.
- Wu LB, Ueda Y, Lai SK, Frei M. Shoot tolerance mechanisms to iron toxicity in rice (Oryza sativa L.). Plant Cell Environ. 2016;40(4):570–584. doi:10.1111/pce.12733.
- Das K, Roychoudhury A. Reactive oxygen species (ROS) and response of antioxidants as ROS-scavengers during environmental stress in plants. Front Environ Sci. 2014;2:53. doi:10.3389/fenvs.2014.00053.
- Kovačević V, Vukadinović V, Bertić B. Excessive iron and aluminum uptake and nutritional stress in corn (Zea mays L.) plants. J Plant Nutr. 1988;11(6–11):1263–1272. doi:10.1080/01904168809363884.
- Snowden RED, Wheeler BD. Iron toxicity to fen plant species. J Ecol. 1993;81:35–46. doi:10.2307/2261222.
- Albano JP, Miller WB, Halbrooks MC. Iron toxicity stress causes bronze speckle, a specific physiological disorder of marigold (Tagetes erecta L.). J Amer Soc Hortic Sci. 1996;121(3):430–437. doi:10.21273/JASHS.121.3.430.
- Lucassen ECHET, Smolders AJP, Roelofs JGM. Increased groundwater levels cause iron toxicity in Glyceria fluitans (L.). Aquatic Bot. 2000;66:321–327. doi:10.1016/S0304-3770(99)00083-2.
- Khabaz-Saberi H, Rengel Z, Wilson R, Setter TL. Variation for tolerance to high concentration of ferrous iron (Fe2+) in Australian hexaploid wheat. Euphytica. 2010;172(2):275–283. doi:10.1007/s10681-009-0069-3.
- Tanaka A, Loe R, Navasero SA. Some mechanism involved in the development of iron toxicity symptoms in the rice plant. Soil Sci Plant Nutr. 1966;12(4):32–38. doi:10.1080/00380768.1966.10431951.
- Fang WC, Kao CH. Enhanced peroxidase activity in rice leaves in response to excess iron, copper and zinc. Plant Sci. 2000;158(1–2):71–76. doi:10.1016/S0168-9452(00)00307-1.
- Audebert A, Sahrawat KL. Mechanisms for iron toxicity tolerance in lowland rice. J Plant Nutr. 2000;23(11&12):1877–1885. doi:10.1080/01904160009382150.
- Wishart DS, Feunang DY, Marcu A, Guo AC, Liang K, Vazquez-Fresno R, Sajed T, Johnson D, C L, Karu N, et al. HMDB 4.0: the human metabolome database for 2018. Nucleic Acids Res. 2017;46:D608–D617. doi:10.1093/nar/gkx1089.
- Quinet M, Vromman D, Clippe A, Bertin P, Lequeux H, Dufey I, Lutts S, Lefèvre I. Combined transcriptomic and physiological approaches reveal strong differences between short- and long-term response of rice (Oryza sativa) to iron toxicity. Plant Cell Environ. 2012;35(10):1837–1859. doi:10.1111/j.1365-3040.2012.02521.x.
- Hill CB, Roessner U. Metabolic profiling of plants by GC-MS. In Weckwerth W, Kahl G, editors. The handbook of plant metabolomics. Weinheim (Germany): Wiley-VCH Verlag GmBH & Co; 2013; 3-23.
- Arbona V, Manzi M, de Ollas C, Gómez-Cadenas A. Metabolomics as a tool to investigate abiotic stress tolerance in plants. Int J Mol Sci. 2013;14:4885–4911. doi:10.3390/ijms14034885.
- Kusano M, Yang Z, Okazaki Y, Nakabayashi R, Fukushima A, Saito K. Using metabolomic approaches to explore chemical diversity in rice. Mol Plant. 2015;8:58–67. doi:10.1093/mp/ssu125.
- Widodo PJH, Newbigin E, Tester M, Bacic A, Roessner U. Metabolic responses to salt stress of barley (Hordeum vulgare L.) cultivars, Sahara and clipper, which differ in salinity tolerance. J Exp Bot. 2009;60(14):4089–4103. doi:10.1093/jxb/erp243.
- Barding GA, Fukao T, Béni S, Bailey-Serres J, Larive CK. Differential metabolic regulation governed by the rice SUB1A gene during submergence stress and identification of alanylglycine by 1H NMR spectroscopy. J Proteome Res. 2012;11:320–330. doi:10.1021/pr200919b.
- Yoshida S, Forno DA, Cock JH, Gomez KA. Laboratory manual for physiological studies of rice. Manila (Philippines): The International Rice Research Institute; 1976.
- Nugraha Y, Ardie SW, Ghulamahdi M, Aswidinnoor H. Nutrient culture media with agar is effective for early and rapid screening of iron toxicity tolerance in rice. J Crop Sci Biotech. 2015;19(1):61–70. doi:10.1007/s12892-015-0075-z.
- Turhadi N. 2018. Tolerance level of several rice (Oryza sativa L.) genotypes to Fe toxicity based on morpho-physiological traits. [MSc Thesis]. Bogor (Indonesia): Bogor Agricultural University.
- Mongon J, Konnerup D, Colmer TD, Rerkasem B. Responses of rice to Fe2+ in aerated and stagnant conditions: growth, root porosity and radial oxygen loss barrier. Funct Plant Biol. 2014;41:922–929. doi:10.1071/FP13359.
- International Rice Research Institute. Standard evaluation system for rice. Manila (Philippines): The International Rice Research Institute; 2013.
- Lichtenthaler HK. Chlorophylls and carotenoid: pigments of photosynthetic biomembranes. Methods Enzymol. 1987;148:350–382. doi:10.1016/0076-6879(87)48036-1.
- Müller C, Kuki NK, Pinheiro DT, de Souza LR, Silva AIS, Loureiro ME, Oliva MA, Almeida AM. Differential physiological responses in rice upon exposure to excess distinct iron forms. Plant Soil. 2015;391:123–138. doi:10.1007/s11104-015-2405-9.
- Wang YS, Ding MD, Gu XG, Wang JL, Yunli P, Gao LP, Xia T. Analysis of interfering substances in the measurement of malondialdehid content in plant leaves. Am J Biochem Biotechnol. 2013;9(3):235–242. doi:10.3844/ajbbsp.2013.235.242.
- Vargas LHG, Neto JCR, de Aquino Ribeiro JA, Ricci-Silva ME, Souza MT, Rodrigues CM, Abdelnur PV. Metabolomics analysis of oil palm (Elaeis guineensis) leaf: evaluation of sample preparation steps using UHPLC-MS/MS. Metabolomics. 2016;12(10):1–12. doi:10.1007/s11306-016-1100-z.
- Xia J, Wishart DS. Using MetaboAnalyst 3.0 for comprehensive metabolomics data analysis. Curr Protoc Bioinf. 2016;55:14.10.1–14.10.91. doi:10.1002/cpbi.11.
- Gupta P, De B. Metabolomics analysis of rice responses to salinity stress revealed elevation of serotonin, and gentisic acid levels in leaves of tolerant varieties. Plant Signaling Behav. 2017;12(7):e1335845. doi:10.1080/15592324.2017.1335845.
- Nugraha Y, Rumanti IA, Guswara A, Ardie SW, Ghulammahdi M, Aswidinnoor H. Response of selected rice varieties under excess iron condition. JPPTP. 2016;35:181–190.
- Turhadi T, Hamim H, Ghulamahdi M, Miftahudin M. Morpho-physiological responses of rice genotypes and its clustering under hydroponic Fe toxicity conditions. Asian J Agric Biol. 2018;6:495–505.
- Kabir AH, Begum MC, Haque A, Amin R, Swaraz AM, Haider SA, Paul NK, Hossain MM. Genetic variation in Fe toxicity tolerance is associated with the regulation of translocation and chelation of iron along with antioxidant defence in shoots of rice. Funct Plant Biol. 2016;43(11):1070–1081. doi:10.1071/FP16068.
- Shimizu A, Guerta CQ, Gregorio GB, Ikehashi H. Improved mass screening of tolerance to iron toxicity in rice by lowering temperature of culture solution. J. Plant Nutr. 2005;28:1481–1493. doi:10.1080/01904160500201352.
- Peng XX, Yamauchi M. Ethylene production in rice bronzing leaves induced by ferrous iron. Plant Soil. 1993;49:227–234. doi:10.1007/BF00016613.
- Taranto F, Pasqualone A, Mangini G, Tripodi P, Miazzi MM, Pavan S, Montemurro C. Polyphenol oxidases in crops: biochemical, physiological and genetic aspects. Int J Mol Sci. 2017;18(377):1–16. doi:10.3390/ijms18020377.
- Skórzyńska-Polit E. Lipid peroxidation in plant cells, its physiological role and changes under heavy metal stress. Acta Soc Bot Pol Pol Tow Bot. 2007;76(1):49–54. doi:10.5586/asbp.2007.006.
- Marschner H. Mineral nutrition of higher plants. San Diego (USA): Academic Pr; 1995.
- Jorge TF, Rodrigues JA, Caldana C, Schmidt R, van Dongen JT, Thomas-Oates J, Antonio C. Mass spectrometry-based plant metabolomics: metabolite response to abiotic stress. Mass Spectrom Rev. 2016;35:620–649. doi:10.1002/mas.21449.
- Do Amaral MN, Arge LWP, Benitez LC, Danielowski R, da Silveira Silveira SF, da Rosa Farias D, de Oliveira AC, da Maia LC, Braga EJB. Comparative transcriptomics of rice plants under cold, iron, and salt stresses. Funct Integr Genomics. 2016;16(5):567–579. doi:10.1007/s10142-016-0507-y.
- Finatto T, de Oliveira AC, Chaparro C, da Maia LC, Farias DR, Woyann LG, Mistura CC, Soares-Bresolin AP, Llauro C, Panaud O, et al. Abiotic stress and genome dynamics: specific genes and transposable elements response to iron excess in rice. Rice. 2015;8(13):1–18. doi:10.1186/s12284-015-0045-6.
- Bashir K, Hanada K, Shimizu M, Seki M, Nakanishi H, Nishizawa NK. Transcriptomic analysis of rice in response to iron deficiency and excess. Rice. 2014;7(18):1–15. doi:10.1186/s12284-014-0018-1.
- Wang X. Lipid signaling. Curr Opin Plant. 2004;7(3):329–336. doi:10.1016/j.pbi.2004.03.012.
- Zhang L, Li G, Wang M, Di D, Sun L, Kronzucker HJ, Shi W. Excess iron stress reduces root tip zone growth through nitric oxide-mediated repression of potassium homeostasis in Arabidopsis. New Phytol. 2018;219(1):259–274. doi:10.1111/nph.15157.
- Li G, Kronzucker HJ, Shi W. Root developmental adaptation to Fe toxicity: mechanisms and management. Plant Signaling Behav. 2016;11(1):e1117722. doi:10.1080/15592324.2015.1117722.
- Li Q, Lei S, Du K, Li L, Pang X, Wang Z, Wei M, Fu S, Hu L, Xu L. RNA-seq based transcriptomic analysis uncovers α-linolenic acid and jasmonic acid biosynthesis pathways respond to cold acclimation in Camellia japonica. Sci Rep. 2016;6:36463. doi:10.1038/srep36463.
- Wasternack C, Kombrink E. Jasmonates: structural requirements for lipid-derived signals active in plant stress responses and development. ACS Chem Biol. 2010;5:63–77. doi:10.1021/cb900269u.
- Upchurch RG. Fatty acid unsaturation, mobilization, and regulation in the response of plants to stress. Biotechnol Lett. 2008;30(6):967–977. doi:10.1007/s10529-008-9639-z.
- Ouariti O, Boussama N, Zarrouk M, Cherif A, Ghorbal MH. Cadmium- and copper-induced changes in tomato membrane lipids. Phytochemistry. 1997;45(7):1343–1350. doi:10.1016/S0031-9422(97)00159-3.
- Ammar WB, Nouairi I, Zarrouk M, Jemal F. The effect of Cadmium on lipid and fatty acid biosynthesis in tomato leaves. Biologia. 2008;63(1):86–93. doi:10.2478/s11756-008-0002-6.
- Morsy AA, Salama KHA, Kamel HA, Mansour MMF. Effect of heavy metals on plasma membrane lipids and antioxidant enzymes of Zygophyllum species. Eurasian J Biosci. 2012;6:1–10. doi:10.5053/ejobios.2012.6.0.1.
- Chalbi N, Hessini K, Gandour M, Mohamed SN, Smaoui A, Abdelly C, Youssef NB. Are changes in membrane lipids and fatty acid composition related to salt stress resistance in wild and cultivated barley? J Plant Nutr Soil Sci. 2013;176:138–147. doi:10.1002/jpln.201100413.
- Hiremath SS, Sajeevan RS, Nataraja KN, Chaturvedi AK, Chinnusamy V, Pal M. Silencing of fatty acid desaturase (FAD7) gene enhances membrane stability and photosynthetic efficiency under heat stress in tobacco (Nicotiana benthamiana). IJEB. 2017;55:532–541.