
ABSTRACT
Herbaceous peony (Paeonia lactiflora Pall.) is known as the flower phase. This phase is somewhat resistant to drought, but long-term drought and severe water shortage will affect its normal growth and development. In this study, physiological indices and the transcriptome of P. lactiflora were determined to clarify its physiological responses and gene expression changes under drought stress. The results showed that under drought stress, soluble sugar content, peroxidase (POD), catalase (CAT) and ascorbate peroxidase (APX) activities, and chlorophyll, carotenoid and flavonoid contents were significantly increased, and soluble protein content, superoxide dismutase (SOD), glutathione reductase (GR), dehydroascorbate reductase (DHAR), monodehydroascorbate reductase (MDHAR), ascorbic acid (AsA) and glutathione (GSH) activity first increased and then decreased after day 14. Moreover, drought stress also significantly reduced chlorophyll content, photosynthesis and chlorophyll fluorescence parameters. Transcriptomic analysis revealed that compared with the Control, 10,747 differentially expressed genes (DEGs) were upregulated and 11,835 downregulated under drought stress. These DEGs were classified into three categories and 46 functional groups by GO function classification. The 3,179 DEGs were enriched into 128 pathways by KEGG pathway enrichment. The ROS system, chlorophyll degradation and photosynthetic capacity, as well as secondary pathways of biosynthesis and sugar metabolism were included. Additionally, relevant genes expressed in some metabolic pathways were discovered. These results provide a theoretical basis for understanding the responses of P. lactiflora to drought stress.
1. Introduction
Abiotic stress is one of the main limiting factors affecting crop production and is directly related to the changes in various cell metabolic pathways.1 When exposed to abiotic stresses, plants activate regulatory pathways that respond to such stresses, helping them resist stress and survive.Citation2 Therefore, the study of plant tolerance to abiotic stresses has improved understanding of the molecular mechanisms and key pathways involved in plant resistance to environmental stress. Drought stress is an abiotic stress caused by water stress that leads to obvious inhibition of plant growth due to the lack of water in the natural environment. Currently, due to the global shortage of water resources, the study of plant drought stress has become a hot topic. Shawon et al.Citation3 found that drought stress reduced the growth parameters and antioxidant activity of cabbage and affected its normal growth. Determination of metabolic and oxidative stress characteristics in rice flag leaves under drought stress has led to the speculation that coexpression of specific antioxidant enzymes (DHAR and MDHAR) in the ascorbic acid-glutathione cycle might represent a strong tolerance mechanism to minimize grain yield loss under drought stress.Citation4 Drought stress has also been studied in crops such as sorghumCitation5 and wheat,Citation6 but relatively few studies on ornamental flowers have been conducted.
Herbaceous peony (Paeonia lactiflora Pall.) belongs to the paeoniflorinaceae and is known as the ‘king of herbal flowers’. P. lactiflora has high ornamental and garden application value because of its classical elegance and otherworldly temperament, and is a high-grade cut flower worldwide.Citation7 In addition, there have been related studies on P. lactiflora seed oil in recent years. Saldeen et al. found that P. lactiflora oil contains a large amount of tocopherol, and especially γ- tocopherol has a strong antioxidant capacity;Citation8 P. lactiflora seed oil is also rich in calcium and magnesium components,Citation9 which has a very important effect on human health;Citation10 Moreover, P. lactiflora has a high seed setting rate. Therefore, on the whole, P. lactiflora has great economic, ecological and social benefits. Drought is one of the most important factors affecting the ornamental value and popularization of P. lactiflora. Although P. lactiflora possesses fleshy roots and has certain drought resistance,Citation11 long-term drought and excessive water shortage can also affect the normal growth and ornamental value of plants. Studies such as the one reported by Zuo et al.Citation12 have shown that drought stress affects the flower size and flowering length of tree peony. However, the molecular mechanism and functional genes closely related to drought resistance have not been elucidated.
As a widely used new generation genome sequencing (NGS) technique,Citation13 RNA sequencing (RNA-Seq) can be used to capture the transcriptome of plants and to discover many differentially expressed genes (DEGs). For example, the transcriptomes of ‘Zi Fengyu’ with heat resistance and ‘Hongyan Zhenghui’ with moderate heat resistance were analyzed, and a total of 161 heat stress response genes were screened out. Among these genes, the expression of 11 key genes related to heat tolerance was significantly upregulated during plant development, and ‘Zi Fengyu’ showed a higher expression level.Citation14 RNA-Seq results of drought-sensitive lentil cultivars revealed 2,915 root DEGs under short-term drought stress, which increased to 18,327 under long-term drought stress.Citation15 Long-term drought and excessive water loss are the main factors limiting the normal growth and development of P. lactiflora, and they affect its economic, ecological and social value. In order to clarify the physiological and molecular changes of P. lactiflora, its physiological and transcriptomic analyzes were performed under drought stress. This is helpful to understand the complex molecular mechanism of P. lactiflora under drought stress, and to identify functional genes closely related to drought resistance, and alleviate the damage caused by drought stress to P. lactiflora.
2. Materials and methods
2.1. Plant materials and treatments
Five-year-old P. lactiflora ‘Da Fugui’ in potting soil (loam: peat: coarse sand, 1:1:1) with similar initial growth status was used as the material for drought stress treatment. Before treatment, plants were watered thoroughly and then divided into two groups, each group contained 36 plants. One group was used as a Control and watered at 17:00 daily, while watering was stopped and natural drought development was allowed in the other group. All samples were collected on 0, 7, 14 and 21 days after treatment. 36 P. lactiflora seedlings in the two groups were divided into four groups for four periods of measurement and sample collection, with 9 plants in each group. Firstly, three seedlings were randomly selected from nine seedlings of P. lactiflora in four periods to determine photosynthetic characteristics and chlorophyll fluorescence parameters (three repeated experiments), and then 5 leaves were taken as samples on each plant, and 9 plants were taken at the same time. Among these samples, leaves on day 21 were used for RNA-Seq analysis separately, and other leaves were used for measurements of other indices including. Finally, the sample was treated with liquid nitrogen and stored at −80°C until use.
2.2. Soluble sugar and soluble protein content
The leaves of P. lactiflora under stress for 0, 7, 14 and 21 days were tested for physiological indicators. Soluble sugar and soluble protein were determined using a reagent kit (Suzhou Comit Biotechnology Co., Ltd., Suzhou, China). Soluble protein content: 0.1 g leaves were weighed and added l mL extract was ground evenly on ice. The extracts were centrifuged at 4°C for 15 min at 8000 × g, and take the supernatant on ice for determination; Soluble sugar content: 0.1 g leaves were weighed and added l mL distilled water to grind into a homogenate, and poured into a centrifuge tube with a lid. The centrifuge tube was placed in a water bath at 95°C for 10 min. After cooling, the extracts were centrifuged at 25°C for 10 min at 8000 × g and then fix the supernatant to 10 mL. Then use a ultraviolet spectrophotometer to measure and calculate the soluble protein and soluble sugar content according to the method in the kit.
2.3. Measurement of antioxidant and ascorbic acid-glutathione (AsA-GSH) circulating system enzyme activities
The leaves of P. lactiflora under stress for 0, 7, 14 and 21 days were tested for antioxidant and ascorbic acid-glutathione (AsA-GSH) circulating system enzyme activities. When antioxidant enzyme activities were measured, firstly, 0.5 g leaves were ground to a fine powder with liquid nitrogen and extracted with ice-cold 50 mM phosphate buffer (pH 7.8). The extracts were centrifuged at 4°C for 15 min at 10,000 × g and then the resulting supernatants thereafter referred to as crude extracts, which was collected and used for enzyme activities assay.Citation16 Superoxide dismutase (SOD), peroxidase (POD) and catalase (CAT) activity were evaluated by reagent kits (Suzhou Comit Biotechnology Co., Ltd., Suzhou, China). In addition, ascorbate peroxidase (APX) was measured using a kit (Suzhou Comit Biotechnology Co., Ltd., Suzhou, China). Enzymes in the ascorbic acid-glutathione (AsA-GSH) circulation system contains glutathione reductase (GR), dehydroascorbate reductase (DHAR), monodehydroascorbate reductase (MDHAR), reduced glutathione (GSH) and ascorbic acid (AsA) activities of these enzymes were measured using the kitCitation17 (Suzhou Comit Biotechnology Co., Ltd., Suzhou, China).
2.4. Measurement of photosynthetic characteristics, pigment contents and chlorophyll fluorescence parameters
Flavonoid, chlorophyll and carotenoid content, the determination method of these three pigment contents is consistent with that of WangCitation17 0.1 g leaves were placed in 15 mL of 80% acetone, and they were extracted overnight in dark conditions, and mixed 2–3 times every 2 h until the leaves turned white. In order to measure the chlorophyll content, the extraction solution should be used to determine the absorption values A645 and A663 at wavelengths of 645 and 663 nm respectively on the ultraviolet spectrophotometer. Chlorophyll content = (20.0A645 + 8.02A663) × V/(1000 × W); The content of carotenoids requires theabsorption values A470, A645 and A663 at wavelengths of 470, 645 and 663 nm respectively on the ultraviolet spectrophotometer. Chlorophyll a (Ca) = 12.21A663-2.81A645;Chlorophyll b (Cb) = 20.13A645-5.03A663;Carotenoids content = (1000A470-3.27Ca-104Cb)/229 × V/(1000 × W). 0.02 g leaves were ground to a fine powder with liquid nitrogen and 2 mL of extraction solution was added, and extracted by shaking at 60°C for 2 h. After centrifugation at 10,000 g for 10 min at room temperature, the supernatant was obtained and the flavonoid content was determined by using a kit (Suzhou Comit Biotechnology Co., Ltd., Suzhou, China). A portable photosynthesis system (LI-6400, Li-Cor, Lincoln, NE, USA) was used to assess the photosynthetic characteristics at 8:30 am local time. The standard leaf chamber with a 2 cm × 3 cm photosynthetic photon quanta flux density (PPFD) was set at 1000 μmol·m−2·s−1 using a self-taking red and blue light-emitting diode (LED) source. The net photosynthesis rate (Pn), transpiration rate (Tr) and stomatal conduction (Gs) were also recorded in the system. Subsequently, chlorophyll fluorescence parameters were measured using a chlorophyll fluorescence spectrometer (Heinz Walz GmbH, Effeltrich, Germany) after the plants remained for 2 h in the dark. This system records the actual photosynthetic efficiency of photosystem II (Y(II)) and the maximum quantum yield of PSII (Fv/Fm, Fv/Fo). All the parameters were measured using the top leaves of 9 different plants per group on the same day.
2.5. RNA-Seq and data analysis
Because the difference in P. lactiflora was the most significant on day 21 after drought stress, total RNA was extracted from Control and 21-day drought stress treatment leaves using a MiniBEST Plant RNA Extraction Kit (TaKaRa, Japan). Eukaryotic mRNA was enriched with oligo(dT) beads, while prokaryotic mRNA was enriched by removing rRNA by Ribo-ZeroTM Magnetic Kit (Epicenter, America). The enriched mRNA was then fragmented into short fragments using fragmentation buffer and reverse-transcribed into cDNA with random primers. Second-strand cDNA was synthesized using DNA polymerase I, RNase H, dNTPs and buffer. Next, the cDNA fragments were purified with 1.8X Agencourt AMPure XP Beads, end-repaired, subjected to poly(A) addition, and ligated to Illumina sequencing adapters. The ligation products were size-selected by agarose gel electrophoresis, PCR-amplified, and sequenced using an Illumina HiSeqTM 4000 by Gene Denovo Biotechnology Co. (Guangzhou, China).
After filtering the raw reads, transcriptome de novo assembly was carried out with the short-read assembly programme Trinity.Citation18 The resulting Trinity sequences were called unigenes. Unigene annotation was performed using various bioinformatics databases, including the non-redundant protein database (Nr), non-redundant nucleotide database (NT), gene ontology database (GO), cluster of orthologous groups of proteins database (COG), Kyoto encyclopedia of genes and genomes database (KEGG), Swiss-Prot protein database (Swiss-Prot) and Interpro. Unigene expression was calculated and normalized to reads per kilobases per million reads (RPKM).Citation19 DEGs were defined based on a fold change ≥ 2.0 and adjusted P-value ≤ 0.05. Confirmed DEGs were subjected to GO functional analysis and KEGG pathway analysis.
2.6. Quantitative real-time polymerase chain reaction (qRT-PCR) verification
In order to verify the reliability of the sequenced data, genes related to drought stress response were selected for quantitative real-time polymerase chain reaction (qRT-PCR) validation, and all gene-specific primers were shown in Table S1. qRT-PCR was performed using the SYBR® Premix Ex TaqTM (Perfect Real Time) (TaKaRa, Japan) and contained 12.5 µL 2 × SYBR Premix Ex TaqTM, 2 µL cDNA solution, 2 µL mix solution of target gene primers and 8.5 µL ddH2O in a final volume of 25 µL. The amplification was carried out under the following conditions: 95°C for 30 s, 40 cycles at 95°C for 5 s, 52°C for 30 s, and 72°C for 30 s. Gene relative expression levels of target genes were calculated by the 2−ΔΔCt comparative threshold cycle (Ct) method.Citation20 The Ct values of the triplicate reactions were gathered using the Bio-Rad CFX Manager V1.6.541.1028 software (Bio-Rad, Hercules, CA, USA).
2.7. Statistical analysis
All experiments described herein were repeated three times using a completely randomized design. Primers were designed using the Primer programme (version 5.00). The results were analyzed for variance using the SAS/STAT statistical analysis package (version 6.12, SAS Institute, Cary, NC, USA).
3. Results
3.1. Soluble sugar and soluble protein content
Under drought stress, the physiological index of P. lactiflora was determined, and the results showed an increase in the soluble sugar content in leaves. Somewhat in contrast, the soluble protein content showed an increasing trend during the early stage of drought and gradually decreased after day 14. However, the contents of the two physiological indices under drought stress were higher compared with the Control in the same period ().
Figure 1. Soluble sugar and soluble protein content changes in drought-treated P. lactiflora and Control. Values represent the mean ± standard deviation (SD) and letters indicate significant differences according to Duncan’s multiple range test (P < 0.05).
3.2. Antioxidant enzyme activity
Under drought stress, the antioxidant enzyme activity in P. lactiflora leaves changed significantly, POD, CAT and APX activity continued to increase, and SOD activity showed a tendency to first rise and then decline, reaching the highest value at day 14. Compared with the Control, SOD, POD, CAT and APX activity were significantly increased in the drought-treated leaves, especially at day 21, with POD, CAT and APX activity that were 2.63, 2.77 and 5.07 times those of the Control, respectively; at day 14, SOD activity was 1.33 times that of the Control ().
Figure 2. Antioxidant enzyme activity changes in drought-treated P. lactiflora and the Control. Values represent the mean ± standard deviation (SD) and letters indicate significant differences according to Duncan’s multiple range test (P < 0.05). SOD, superoxide dismutase; POD, peroxidase; CAT, catalase; APX, ascorbate peroxidase.
3.3. Ascorbic acid-glutathione (AsA-GSH) circulating system enzyme activity
As shown in , the activity of GR, DHAR, MDHAR and content of AsA and GSH in P. lactiflora leaves first increased and then decreased under continuous drought stress. The activity and content of each enzyme in P. lactiflora exposed to drought stress reached its maximum at day 14 after treatment, increasing by 4.61%, 9.34%, 6.90%, 4.26% and 20.62%, respectively, compared with the Control. However, compared with the other four enzymes, the decreasing trend of GSH content after day 14 was relatively gradual.
Figure 3. Ascorbic acid-glutathione (AsA-GSH) circulating system enzyme activity changes in drought-treated P. lactiflora and the Control. Values represent the mean ± standard deviation (SD) and letters indicate significant differences according to Duncan’s multiple range test (P < 0.05). GR, glutathione reductase; DHAR, dehydroascorbate reductase; MDHAR, monodehydroascorbate reductase; GSH, reduced glutathione; AsA, ascorbic acid.
3.4. Photosynthesis
As shown in , the chlorophyll in leaves of P. lactiflora showed a stark downward trend under drought stress, while the change in carotenoid and flavonoid content showed an upward trend. The analysis of photosynthetic parameters showed that the net photosynthesis rate (Pn) was inhibited by drought stress compared with the Control, and the stomatic conductance (Gs) and transpiration rate (Tr) followed a similar decreasing trend in response to drought stress (). Additionally, compared with the Control, drought stress significantly decreased the chlorophyll fluorescence parameters, including the ratio of variable fluorescence to minimal fluorescence (Fv/Fo), the ratio of variable fluorescence to maximum fluorescence (Fv/Fm) and the actual photosynthetic efficiency of light system II (Y(II)), by 74.67%, 65.91% and 70.45% at day 21, respectively ().
Figure 4. Pigment content changes in drought-treated P. lactiflora and the Control. Values represent the mean ± standard deviation (SD) and letters indicate significant differences according to Duncan’s multiple range test (P < 0.05).
Figure 5. Photosynthetic characteristics and chlorophyll fluorescence parameter changes in drought-treated P. lactiflora and the Control. (a) Photosynthetic characteristics. (b) Chlorophyll fluorescence parameters. Values represent the mean ± standard deviation (SD) and letters indicate significant differences according to Duncan’s multiple range test (P < 0.05). Pn, net photosynthesis rate; Tr, transpiration rate; Gs, stomatal conduction; Fo, minimal fluorescence; Fv, variable fluorescence; Fm, maximum fluorescence; Y(II), photosynthetic efficiency of photosystem II.
3.5. Sequence analysis, transcript assembly and gene functional annotation
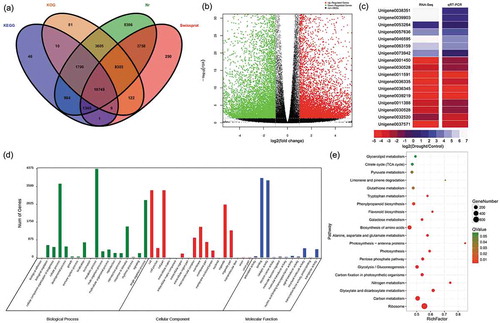
To define the response of the P. lactiflora transcriptome to drought stress, RNA samples from 21-day drought-stressed leaves and the Control were subjected to RNA-Seq. Six libraries were constructed, and an average of 55,165,914 total reads with a single read length of 150 nt, Q30 percentage of 95.95% and GC percentage of 45.07% was generated from each library (Table S2) and deposited at NCBI (SRA: SRP131648). After trimming adapters, filtering out low-quality reads and de novo assembly, 86,257 unigenes with a mean length of 815 bp and N50 of 1,396 across a total of 70,328,345 bp were obtained. A total of 39,309 unigenes were annotated successfully; 38,750 unigenes (44.92%) showed significant similarity to the Nr database, 24,577 (28.49%) to the Swiss-Prot database, 24,579 (28.50%) to the KOG database, and 14,844 (17.21%) to the KEGG database (). Subsequently, it was found that 22,582 DEGs were expressed under drought stress, of which 10,747 were upregulated and 11,835 were downregulated (). To validate these DEGs, the expression levels of 17 randomly selected genes were analyzed by qRT-PCR. The results were shown in . By comparison, the expression patterns of these genes were similar to those observed using RNA-Seq, including 7 upregulated and 10 downregulated genes.
Figure 6. Annotation of unigenes, functions and validation of DEGs (a) Venn diagram of the number of unigenes annotated in four public databases. (b) Volcano plot of DEGs. The x-axis represents the log2-transformed fold change; the y-axis represents the -log10 false discovery rate, red points represent upregulated DEGs, green points represent downregulated DEGs, and black points represent non-DEGs. (c) Correlation of gene expression results obtained using RNA-Seq and quantitative real-time polymerase chain reaction (qRT-PCR) analysis. Correlation assay performed for 18 DEGs with a log2 ratio of 21.00 or S-1.00. FDR, false discovery rate; FC, fold change. (d) Gene Ontology (GO) enrichment classification of differentially expressed genes (DEGs). (e) Pathway functional enrichment of DEGs. The x axis represents the enrichment factor, the y axis represents the pathway name, and the color indicates the q-value, with a lower q-value indicating more significant enrichment and the point size indicating the DEG number.
3.6. Differential gene expression analysis under drought stress
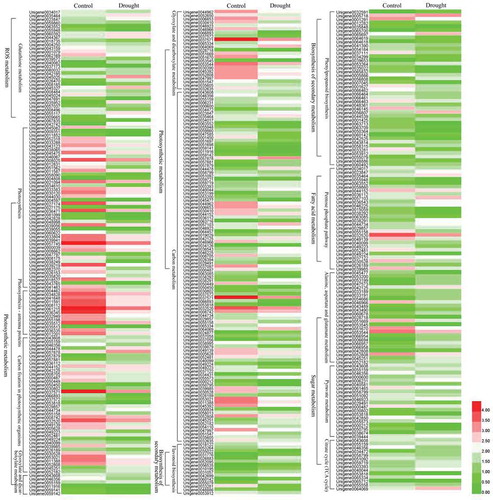
To better understand the functions of these DEGs, GO annotation was performed. All the DEGs were assigned to biological process (18), cellular component (17) and molecular functions (11) based on their functional properties (). In the large category of biological processes, the most enriched annotation results were metabolic processes with 4371 DEGs, followed by cellular process and single-organic process. Similarly, in the cell composition category, cell and cell parts involved the most differentially expressed genes, followed by the number of organelle parts assigned. Furthermore, under the molecular functional category, the largest number of DEGs was found for binding activity and catalytic activity at 3,917 and 3,803, respectively. These results suggested that metabolic processes, cellular processes, and individual organismal process pathways of P. lactiflora were the most dramatically influenced biological response processes under drought treatment. Under the broad category of ‘Biological process’, 4,371 DEGs were assigned to ‘metabolic processes’, followed by ‘cellular process’ and ‘single-organism process’, including 3,638 and 2,831 DEGs, respectively. Similarly, under the ‘cellular component’ category, 3,318 DEGs were assigned to ‘cell’ and ‘cell part’, followed by 2,609 DEGs that were assigned ‘organelle’. Further, in the ‘molecular functions’ category, 3,917 DEGs were assigned to ‘binding’ and 3,803 to ‘catalytic activity’. Moreover, all the DEGs were subjected to KEGG annotation to further characterize the transcripts, of which 3,179 DEGs were allotted to 128 KEGG pathways and only 15 pathways met the condition of a Q-value ≤ 0.01. Among these pathways, the largest number of DEGs (624) was involved in the ‘ribosome’, while the smallest number of DEGs (17) was recorded for ‘photosynthesis – antenna proteins’ (, Table S3). Additionally, drought-related pathways involving DEGs included the citrate cycle (TCA cycle), pyruvate metabolism, glutathione metabolism, phenylpropanoid biosynthesis, flavonoid biosynthesis, alanine, aspartate and glutamate metabolism, photosynthesis-antenna proteins, photosynthesis, the pentose phosphate pathway, carbon fixation in photosynthetic organisms, glyoxylate and dicarboxylate metabolism and carbon metabolism. These pathways were divided into five main categories: ROS system (glutathione metabolism); chlorophyll degradation and photosynthetic competency (photosynthesis-antenna proteins, photosynthesis, carbon fixation in photosynthetic organisms, glyoxylate and dicarboxylate metabolism, carbon metabolism); biosynthesis of secondary metabolism (phenylpropanoid biosynthesis and flavonoid biosynthesis); fatty acid metabolism (pentose phosphate pathway); sugar metabolism (citrate cycle (TCA cycle), pyruvate metabolism and alanine, aspartate and glutamate metabolism) ().
Figure 7. Heat map of the main differentially expressed gene (DEG) expression patterns involved in the reactive oxygen species (ROS) system, chlorophyll degradation and photosynthetic competency, biosynthesis of secondary metabolism, fatty acid metabolism and sugar metabolism.
3.7. Analysis of drought-responsive transcription factors
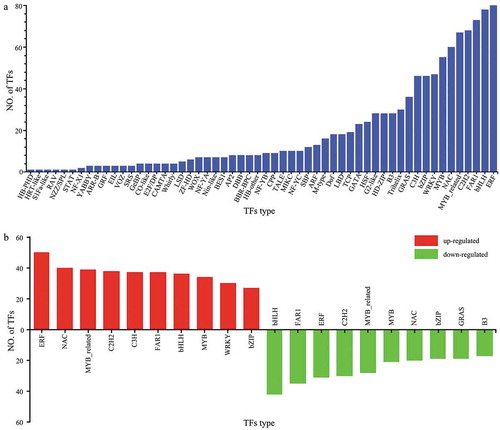
The predicted protein sequences were compared with the corresponding TF database (plant TFdb/animal TFdb), and a total of 1078 transcription factors (TFs) involved in drought stress response were identified in P. lactiflora, which belonged to 56 families (). Among them, the number of ethylene-responsive factor (ERF) (7.42%), basic helix-loop-helix protein (bHLH) (7.23%), fatty acyl-CoA reductase 1 (FAR1) (6.77%), Cys2-His2 (C2H2) (6.30%), MYB-related (6.21%), N-acetylcysteine (NAC) (5.56%), v-myb avian myeloblastosis viral oncogene homologue (MYB) (5.10%), WRKY (4.35%), and basic region/leucine zipper motif (bZIP) (4.26%) families was relatively large, and ERF was the largest TF family with 80 gene members. The expression levels of TF in P. lactiflora were different under drought stress. Compared with the Control, there were 612 upregulated TFs from 53 TF families in drought-treated P. lactiflora, a total of 464 downregulated TFs and 46 TF families, and 2 TFs with unaltered expression levels. The two TF families with the most up or downregulated genes were ERF and bHLH ().
Figure 8. Transcription factor (TF) analysis. (a) Number and types of transcription factors (TF). (b) Transcription factor (TF) changes in drought-treated P. lactiflora and the Control.
4. Discussion
Drought stress can lead to changes in plant morphology, physiology and molecular responses.Citation21 In response, plants adopt a series of physiological and metabolic responses to prevent, reduce, or repair damage, in order to maintain a normal physiological state,Citation22 including increases in antioxidant enzyme activity to scavenge ROS free radicalsCitation23 and the accumulation of solutes in the body to enhance osmoregulation in response to drought stress.Citation24 Soluble sugar and soluble protein are the main organic components of osmoregulation.Citation25 Gao et al.Citation26 and Zhang et al.Citation27 reported that drought stress increased the accumulation of soluble sugar and soluble protein content in plants, leading to osmotic regulation. Consistent findings were obtained in our present study: under drought stress, the content of soluble sugar and soluble protein in P. lactiflora leaves showed an upward trend, with higher contents compared with the Control. These results confirmed that drought stress increased the soluble sugar content in plants and thus reduced the osmotic potential and maintained the normal water demand in plants; it also increased the soluble protein content to eliminate and repair damage caused by environmental stress.Citation25 Drought stress can aggravate the production of ROS in plant cells, and excessive production and accumulation of ROS can cause damage to plants.Citation28 To protect against the damage caused by ROS accumulation, plants have evolved an effective antioxidant defense system, including antioxidant enzyme systems (such as SOD, CAT, POD and APX), ascorbic acid-glutathione (AsA-GSH) circulatory systems (such as GSH, AsA, PA, GR, DHAR and MDHAR) and non-antioxidative systems.Citation29 In this study, POD, CAT and APX activity significantly upregulated in P. lactiflora and higher than those in the Control. However, SOD showed an upward trend in the early stage of drought treatment and began to decline at day 14, consistent with previous research.Citation30,Citation31 The initial increase and then decrease in SOD activity may be a consequence of early mild drought induction of SOD synthesis, followed by increases in drought stress, destruction of the SOD synthase structure, and reduced SOD synthesis. In addition, in this study, the enzymatic activities of the enzyme increased while the amount of soluble protein decreased in day 21 with the exception of SOD, which is consistent with the physiological effect of Taraxacum mongolicum Hand-Mazz caused by drought stress.Citation32 This phenomenon may be caused by the inseparable relationship between the change of the soluble protein content value and the synthesis, denaturation and decomposition of intracellular proteins.Citation33 At 21 days, the drought stress of P. lactiflora increased to a certain extent, which disrupted the balance of plant protein decomposition and synthesis, leading to a decrease in soluble protein content.Citation34 And different plants and drought treatments have different physiological effects on plants. Furthermore, as shown by Dong et al.Citation35 and Gu et al.,Citation36 the activity of GR, MDHAR, DHAR and AsA and GSH in leaves of P. lactiflora showed an initial increase and then decrease under drought stress; however, the results differed slightly from those obtained in other plant studies.Citation37–Citation39 The emergence of the present phenomenon might be related not only to the species but also to differences in handling the environment.
The photosynthetic mechanism of plants is very sensitive to stress, and it is usually the primary site of stress.Citation40 Photosynthesis pigments and their secondary metabolites in leaves are involved in the absorption, transmission and transformation of light energy in photosynthesis, and their content directly affects the photosynthetic capacity of plants.Citation41 In this study, the chlorophyll content in leaves of P. lactiflora showed a linear downward trend under drought stress, whereas the change in carotenoid and flavonoid content showed a contrasting upward trend, consistent with the findings of Liu et al.Citation42 and Gharbi et al.Citation43 However, studies have shown that chlorophyll and carotenoid levels first rise and then fall under drought stress or significantly decrease under severe drought stress,Citation44 potentially due to the imbalance in ROS metabolism, which leads to the destruction of chlorophyll and acceleration of chlorophyll decomposition. The increase in carotenoid content in cells neutralizes the chlorophyll damage and improves leaf resistance. Drought stress also severely reduces the activity of plant photosynthesis, which is mainly caused by stomatal closure and complex non-gassing effects.Citation45 Stomata play an important role in the absorption and utilization of water, which is closely related to photosynthesis and transpiration.Citation46 In the present study, Pn, Gs and Tr were significantly reduced in leaves of P. lactiflora under drought stress, and Pn continued to decrease substantially, suggesting that the decrease in Pn in the earlier stage might be caused by stomatal closure inhibition of CO2 uptake. In contrast, with the enhancement of drought stress at a later stage, non-stomatal constraints would destroy the photosynthetic organs of plants and become the dominant factor in the Pn decline. Compared with Pn, Gs and Tr showed an abrupt decline only during the initial seven days, followed by a slow decline. This phenomenon might be due to the drought stress during the previous week causing damage to the stomatal structure of P. lactiflora leaves, such that the leaves were unable to respond positively with further increased stress. In addition, drought stress significantly affected the chlorophyll fluorescence parameters of the plant. When drought is severe or has a longer duration, the non-aperforated factor will destroy photosynthetic organs of the plant, resulting in a serious decline in photosynthesis. In contrast, chlorophyll fluorescence parameters, as an internal indication of plant adaptation to the ecological environment, can be judged according to the changes in fluorescence parameters in plant photosynthetic reactions and the degree of photosynthetic organ damage.Citation47 The results of this study showed that drought stress reduces Y(II), Fv/Fm and Fv/Fo of light system II. These results suggested that drought stress could significantly reduce the light energy conversion efficiency of PSII, resulting in an imbalance between the photochemical activity and electron transport of PSII, which eventually leads to light inhibition and damage to the active center of chloroplast PSII.Citation48 This phenomenon is in complete agreement with the findings of Yang et al.Citation49 and Lai et al.Citation50 regarding the effect of drought stress on the chlorophyll fluorescence parameters of Viburnum sargentii and Bambusa tuldoides.
The physiological and biochemical changes in osmotic regulatory substances and antioxidant enzyme activity in plants are fundamentally the result of gene expression. At present, RNA-Seq sequencing technology has become an important means to detect changes in gene transcription levels in an organism or a specific tissue or organ in a certain functional state. In the present study, the average total reading per library was 55,165,914, and the single reading length was 150 nt. Each library generated a Q30 percentage of 95.95% and a GC percentage of 45.07%. After trimming adapters, filtering out low-quality reads and de novo assembly, 86,257 unigenes with a mean length of 815 bp and N50 of 1,396 across a total of 70,328,345 bp were obtained. Wang et al.Citation51 performed a transcriptome analysis of Kochia prostrata under drought stress, resulting in a Q30 percentage of 85% and N50 of 768. In contrast, the amount and quality of data sequenced in this study was relatively high. In addition, the GC ratio for each P. lactiflora sample was between 35% and 65% at 45.07%. These data all suggest a good quality of the P. lactiflora transcriptome for use in further analyzes.Citation52
Four public databases were used to annotate 86,257 unigenes. A total of 38,750, 24,577, 24,579 and 14,844 unigenes were annotated in the Nr, Swiss-Prot, COG and KEGG database, accounting for 44.92%, 28.49%, 28.50% and 17.21%, respectively. Subsequently, the molecular regulatory mechanism of P. lactiflora under drought stress was investigated. The transcriptome sequencing results were verified by qRT-PCR and were found to be consistent, validating the sequencing method. In addition, GO annotations were performed to better understand the function of these DEGs. Its results suggested that metabolic processes, cellular processes, and individual organismal process pathways of P. lactiflora were the most dramatically influenced biological response processes under drought stress. The present GO annotation results were consistent with the transcriptome analysis results obtained for different Paeonia suffruticosa Andr. under drought stress by.Citation53 The transcriptome analysis further showed that 3,179 DEGs were located in 128 KEGG pathways, but only 20 pathways had a q-value ≤ 0.05 and only 15 a q-value ≤0.01. These pathways could be divided into five main metabolic pathways: the ROS system, chlorophyll degradation and photosynthetic competency, secondary metabolism biosynthesis, fatty acid metabolism and sugar metabolism.
The antioxidant defense system of plants under drought stress can reduce damage by controlling the excessive production of ROS, and glutathione metabolism during ROS metabolism helps to remove ROS from the leaves of P. lactiflora. The downregulation of DEGs associated with the glutathione metabolic pathway in the P. lactiflora transcriptome might be due to the disruption of glutathione metabolism due to drought stress and increased ROS content in plants. The analysis showed that chlorophyll a-binding protein (CAB), chlorophyllase (CHL) and other genes associated with the chlorophyll cycle were significantly downregulated under drought stress, which indicated that the chlorophyll cycle was inhibited. Among the key enzymes involved in chlorophyll degradation, in addition to the pheophorbide a oxygenase (PAO) gene, expression levels of the non-yellow coloring 1 (NYC1), hydroxymethyl chlorophyll reductase (HCAR) and pheophytinase (PPH) gene were all slightly downregulated, suggesting that the damage could be alleviated in P. lactiflora leaves by reducing the degradation of chlorophyll during prolonged drought or severe drought stress. In addition, genes associated with photosynthesis, such as the large subunitoffibulose-1,5- bisphosphate carboxylase oxygenase (RBCL) gene, cytochrome b/f complex gene (pet or psb), PS I, PS II, NADH dehydrogenase gene (NAD), and ATP synthase subunit (ATP) gene, were significantly downregulated under drought stress, indicating a direct effect of drought stress on photosynthesis.
During secondary metabolism biosynthesis, many genes related to flavonoid biosynthesis and phenylalanine biosynthesis have been found to be upregulated, such as the phenylalanine ammonia-lyase (PAL), chalcone synthase (CHS), chalcone isomerase (CHI), naringin 3-dioxygenase (F3H), flavonol synthetase (FLS), dihydroflavonol 4-reductase (DFR), and UDP glucose-flavonoid-3-o-glycosyltranferase (UFGT) gene. This finding indicates that drought stress promotes the increase in flavonoids, which is consistent with the experimental results of this study.
Polyunsaturated fatty acids are one of the most important components of cell membrane lipids, which improve plant resistance to stress by affecting the cell membrane lipid structure and cell membrane fluidity. Oxidative stress induced by drought stress causes membrane lipid peroxidation, which leads to membrane protein denaturation and changes in cell membrane fluidity, resulting in disruption of the membrane structure.Citation54 Based on the transcriptome data for P. lactiflora, altered genes were associated with the pentose phosphate pathway in fatty acid metabolism, such as glucose-6-phosatedehydrogenase (G6PDH) upregulation, fatty acid biosynthesis pathway downregulation, and fatty acid degradation pathway upregulation. These results indicate that drought stress leads to a decrease in fatty acid content, which is consistent with the findings of Ali et al.Citation55
When plants are subjected to drought stress, their growth will be inhibited due to the decrease in photosynthesis,Citation56 which may lead to an increase in soluble sugar (mainly sucrose) content in plants and a decrease in osmotic potential, thus maintaining the normal water demand of plants under drought stress. Furthermore, sugar accumulation in plant organs caused by drought stress may be related to sugar metabolism.Citation57 Du et al.Citation57 studying soybean, found that drought stress has an impact on sugar metabolism. They showed that compared with the Control, drought stress significantly increased the expression of genes related to sucrose phosphate synthase (SPS) and sucrose metabolism in soybean leaves. Chen et al.Citation58 found that the sugars will eventually be exported transporter (SWEET) gene was upregulated under drought stress. A significant upregulation of the SPS1 and pear sucrose synthase (SUS) genes in ‘Huangguan’ pears can lead to a large accumulation of sucrose in fruits.Citation59 These genes are also upregulated in the transcriptome of P. lactiflora. In addition, under drought stress, genes related to sugar metabolism with upregulated expression also included sucrose synthase (SS), fructokinase (FRK) and hexokinase (HXK), among others. These results indicate that drought stress enhances the metabolic cycle of sucrose, leading to the accumulation of soluble sugars (mainly sucrose), which improves the osmotic adjustment ability and tolerance of P. lactiflora under drought stress. This finding is consistent with the gradual increases in soluble sugar content with drought stress in P. lactiflora observed in this study.
During the drought stress response, after receiving a drought signal, the plant activates a transcription factor (TF) through a series of signaling cascades. The activated TF specifically binds to the cis-acting element of the corresponding target gene and initiates transcription of the downstream specific response gene in response to drought stress.Citation60 Zhang et al.Citation61 found that over-expression of ERF-like transcription factors can increase leaf epidermal wax accumulation, significantly reduce leaf dehydration, and increase the tolerance of plants to drought stress. OsMYB6, which leads to overexpression of MYB family genes in transgenic rice,Citation62 causes increased tolerance to drought stress. In addition, bHLH,Citation63 MYB-relatedCitation64 and other families can also be used to regulate plant drought tolerance. In the present study, drought treatment caused differential TF expression in P. lactiflora. Compared with the Control, ERF, NAC, bHLH, MYB-related, FARI, C2H2, and MYB in P. lactiflora representing several types of abundant transcription factors showed the most significant changes in expression under drought stress. The most dramatic downregulation was mainly detected for bHLH transcription factors such as ERF-type transcription factors, which were significantly upregulated. These results indicate that in P. lactiflora, genes are upregulated to achieve a leaf response to water stimuli and downregulated to facilitate leaf responses to drought tolerance. The responses of these transcription factors to drought stress were significant.
5. Conclusion
In the present study, we have confirmed that drought stress had a great influence on physiological response and gene expression of P. lactiflora. A large number of physiological indicators were used to reflect the growth of P. lactiflora under drought stress, including the accumulation of ROS free radicals and solutes in the body, the destruction of chloroplast structure and the sharp decrease in photosynthesis. Analysis of the transcriptome revealed a large number of genes and transcription factors that may play an important role in the drought stress of P. lactiflora, including genes involved in the ROS system, chlorophyll degradation and photosynthetic competency, secondary metabolism biosynthesis and sugar metabolism, and and transcription factors such as ERF, NAC, bHLH, MYB. These results could provide a better understanding of the P. lactiflora response to drought stress and lay a foundation for gene expression profile analysis related to the drought tolerance of plants.
Disclosure of Potential Conflicts of Interest
Disclosure of Potential Conflicts of Interest.
Author Contributions
J.T. designed the experiments; T.L. and R.W. performed experiments; T.L. and R.W. analyzed the data; T.L. wrote the paper; D.Z. revised the paper. All authors read and approved the final manuscript. All authors have read and agreed to the published version of the manuscript.
Supplemental Material
Download Zip (24.3 KB)Supplementary Materials
Supplemental data for this article can be accessed on the publisher’s website.
Additional information
Funding
Related Research Data
References
- Chebrolu KK, Fritschi FB, Ye S, Krishnan HB, Smith JR, Gillman JD. Impact of heat stress during seed development on soybean seed metabolome. Metabolomics. 2016;12(2):1. doi:10.1007/s11306-015-0941-1.
- Yu XH, Li M, Zhou HX. Research progress on plant abiotic stress. Agric Technol. 2016;36(9):51–14. in Chinese.
- Shawon RA, Kang BS, Lee SG, Kim SK, Lee HJ, Katriche E, Gorinstein S, Ku YG. Influence of drought stress on bioactive compounds, antioxidant enzymes and glucosinolate contents of Chinese cabbage (Brassica rapa). Food Chem. 2020;308:125657. doi:10.1016/j.foodchem.2019.125657.
- Melandri G, AbdElgawad H, Riewe D, Hageman JA, Asard H, Beemster GT, Kadam NN, Jagadish KS, Altmann T, Ruyter-Spira C, et al. Biomarkers for grain yield stability in rice under drought stress. J Exp Bot. 2019;71(2):669–683. doi:10.1093/jxb/erz221.
- Govindasamy V, George P, Kumar M, Aher L, Raina SK, Rane J, Annapurna K, Minhas PS. Multi-trait PGP rhizobacterial endophytes alleviate drought stress in a senescent genotype of sorghum [Sorghum bicolor (L.) Moench]. Biotech. 2020;10(1):13. doi:10.1007/s13205-019-2001-4.
- Mkhabela SS, Shimelis H, Odindo AO, Mashilo J. Response of selected drought tolerant wheat (Triticum aestivum L.) genotypes for agronomic traits and biochemical markers under drought-stressed and non-stressed conditions. Acta Agric Scand B-S P. 2019;69:674–689.
- Holloway PS, Buchholz K. The state of the Alaska peony industry 2012. AFES Misc Pub. 2013;3:1–8.
- Saldeen K, Saldeen T. Importance of tocopherols beyond α-tocopherol: evidence from animal and human studies. Nutr Res. 2005;25(10):877–889. doi:10.1016/j.nutres.2005.09.019.
- Ma GY, Shi XH, Zou QC, Zhu KY, Liu HC, Zhou JH, Zhang JQ. Characters determination of herbaceous oil physicochemical property and comparative analysis of peony seed oil. Chin J Cereals Oils. 2017;32(3):130–134,140. in Chinese.
- Ö zcanMM, J uhaimiAF. Effect of sprouting and roastingprocesses on some physico-chemical properties and mineral contents of soybean seed and oils. Food Chem. 2014;154:337–342. doi:10.1016/j.foodchem.2013.12.077.
- Wang Q, Zhao R, Chen Q, da Silva JAT, Chen L, Yu X. Physiological and biochemical responses of two herbaceous peony cultivars to drought stress. HortScience. 2019;54(3):492–498. doi:10.21273/HORTSCI13704-18.
- Zuo M, Gao SP, Wang CN, Sun S, He HF, Gan N. Effects of drought stress on physiological, biochemical and ornamental characteristics of peonies tianpeng. Acta Agric Sinica Sinica. 2011;24(4):66–69. in Chinese.
- Pareek CS. Transcriptome analysis on RNA-seq data. J Next Gen Seq Appl. 2015;S1:1–2.
- Hao ZJ, Wei MR, Gong SJ, Zhao DQ, Tao J. Transcriptome and digital gene expression analysis of herbaceous peony (Paeonia lactiflora Pall.) to screen thermo-tolerant related differently expressed genes. Genes Genomics. 2016;38(12):1201–1215. doi:10.1007/s13258-016-0465-8.
- Morgil H, Tardu M, Cevahir G, Kavakli İH. Comparative RNA-seq analysis of the drought-sensitive lentil (Lens culinaris) root and leaf under short-and long-term water deficits. Funct Integr Genomic. 2019;19:715–727.
- Zou Q. Experimental guidance of plant physiology. Beijing: China Agriculture Press. 2003;62–63. in Chinese.
- Wang R. Effects of melatonin on the aging process of gardenia japonica leaves under dark stress. Jiangsu: Yangzhou University; 2019. in Chinese.
- Grabherr MG, Haas BJ, Yassour M, Levin JZ, Thompson DA, Amit I, Adiconis X, Fan L, Raychowdhury R, Zeng QD, et al. Full-length transcriptome assembly from RNA-Seq data without a reference genome. Nat Biotechnol. 2011;29(7):644. doi:10.1038/nbt.1883.
- Mortazavi A, Williams BA, McCue K, Schaeffer L, Wold B. Mapping and quantifying mammalian transcriptomes by RNA-Seq. Nat Methods. 2008;5(7):621–628. doi:10.1038/nmeth.1226.
- Schmittgen TD, Livak KJ. Analyzing real-time PCR data by the comparative CT method. Nat Protoc. 2008;36:1101–1108. doi:10.1038/nprot.2008.73.
- Hussain HA, Hussain S, Khaliq A, Ashraf U, Anjum SA, Men S, Wang L. Chilling and drought stresses in crop plants: implications, cross talk, and potential management opportunities. Front Plant Sci. 2008;9:393. doi:10.3389/fpls.2018.00393.
- Farooq M, Wahid A, Kobayashi N, Fujita DBSMA, Basra SMA. Plant drought stress: effects, mechanisms and management. Agron Sustain Dev. 2009;29(1):185–212. doi:10.1051/agro:2008021.
- Xu X, Li D, Ma Y, Zhai J, Sun J, Gao Y, Zhang R. Responses of the antioxidant defense system of Osmanthus fragrans cv. ‘Tian Xiang TaiGe’ to drought, heat and the synergistic stress. Chin Bull Bot. 2018;53:72–81.
- Patakas A, Nikolaou N, Zioziou E, Radoglou K, Noitsakis B. The role of organic solute and ion accumulation in osmotic adjustm ent in drought- tressed grapevines. Plant Sci. 2002;163(2):361–367. doi:10.1016/S0168-9452(02)00140-1.
- Dong L, Li J, Wang J, Xie K, Su Y. Effects of Drought Stress on Osmotic Regulation Substances of Five Catalpa bungei Clones. Agric Sci Technol. 2013;14(9):1335–1343. in Chinese.
- Gao SS, Wang Y, Yu S, Huang YQ, Liu HC, Chen C, He HY. Effects of drought stress on growth, physiology and secondary metabolites of Two Adonis species in Northeast China. Sci Hortic-Amsterdam. 2020;259:108795. doi:10.1016/j.scienta.2019.108795.
- Zhang M, Jin ZQ, Zhao J, Zhang G, Wu F. Physiological and biochemical responses to drought stress in cultivated and Tibetan wild barley. Plant Growth Regul. 2015;75(2):567–574. doi:10.1007/s10725-014-0022-x.
- Tarchoune I, Sgherri C, Izzo R, Lachaal M, Ouerghi Z, Navari-Izzo F. Antioxidative responses of Ocimum basilicum to sodium chloride or sodium sulphate salinization. Plant Physiol Biochem. 2010;48(9):772–777. doi:10.1016/j.plaphy.2010.05.006.
- Cheng L, Han M, Yang LM, Li Y, Sun Z, Zhang T. Changes in the physiological characteristics and baicalin biosynthesis metabolism of Scutellaria baicalensis Georgi under drought stress. Ind Crop Prod. 2018;122:473–482. doi:10.1016/j.indcrop.2018.06.030.
- Cao Y, Luo Q, Tian Y, Meng F. Physiological and proteomic analyses of the drought stress response in Amygdalus Mira (Koehne) Yü et Lu roots. BMC Plant Biol. 2017;17(1):53. doi:10.1186/s12870-017-1000-z.
- Ji Y, Zhang X, Peng Y, Liang XY, Huang LK, Ma X, Ma YM. Effects of drought stress on lipid peroxidation, osmotic adjustment and activities of protective enzymes in the roots and leaves of orchardgrass. Acta prataculture sinica. 2014;23(3):144–151. in Chinese.
- Lu QX. Effects of drought stress on resistance physiological and biochemical indexes of Taraxacum mongolicum Hand-Mazz. Hebei: Hebei university of engineering; 2020. in Chinese.
- Ye J, Wang S, Deng X, Yin L, Xiong B, Wang X. Melatonin increased maize (Zea mays L.) seedling droughttolerance by alleviating drought-induced photosynthetic inhibition and oxidative damage. Acta Physiol Plant. 2016;38(2):48. doi:10.1007/s11738-015-2045-y.
- Li WJ. Effect of soil drought and rewatering on physiological characteristics of peanut. Shandong Cotton Res Center. 1997;5:15–18. in Chinese.
- Dong SK, Ma YL, Li S, Dong N, Liu LJ. Effect of drought stress and re-watering on ascorbate-glutathionecycle of soy bean. J Northeast Agric Univ. 2018;49(1):10–18. in Chinese.
- Gu F, Ji MC, Gu CH, Zheng G, Zheng SY. Effects of high temperature and drought stress on the antioxidant defense system of Huangwei. J Zhejiang A F Univ. 2019;36(5):894–901. in Chinese.
- Niu Y, Wang YP, Li P, Zhang F, Liu H, Zheng GC. Drought stress induces oxidative stress and the antioxidant defense system in ascorbate-deficient vtc1 mutants of Arabidopsis thaliana. Acta Physiol Plant. 2013;35(4):1189–1200. doi:10.1007/s11738-012-1158-9.
- Liu FG, Ju PF, Wang FZ, Zhang ST, Xing H, Jiang HD. Effect of Triadimefon on AsA-GSH Cycle of Soybean Roots Under Drought Stress at Flowering Stage. Soybean Sci. 2019;38:740–746.
- Shan CJ, Zhang FY. effects of salicylic acid on antioxidant properties of maize seedlings under drought. Jiangsu Agric Sci. 2015;43(2):102–104. in Chinese.
- Chaves MM. Effects of water deficits on carbon assimilation. J Exp Bot. 1991;42(1):1–16. doi:10.1093/jxb/42.1.1.
- Nijs I, Ferris R, Blum H, Hendrey G, Impens I. Stomatal regulation in a changing climate: a field study using free air temperature increase (FATI) and free air CO2 enrichment (FACE). Plant Cell Environ. 1997;20(8):1041–1050. doi:10.1111/pce.1997.20.issue-8.
- Liu BH, Liang J, Tang G, Wang XF, Liu FC, Zhao DC. Drought stress affects on growth, water use efficiency, gas exchange and chlorophyll fluorescence of Juglans rootstocks. Sci Hortic. 2019;250:230–235. doi:10.1016/j.scienta.2019.02.056.
- Gharbi F, Guizani A, Zribi L, Ahmed HB, Mouillot F. Differential response to water deficit stress and shade of two wheat (Triticum durum desf.) cultivars: growth, water relations, osmolyte accumulation and photosynthetic pigments. Pak J Bot. 2019;51(4):1179–1184. doi:10.30848/PJB2019-4(4).
- Wang B, Hu HL, Hu TX, Shi D, Hu Y, Zhou X, Tan F. Effects of drought stress on photosynthetic characteristics andgrowth of Phoebe zhennan seedlings. J Northwest A&f Univ. 2019;47(2):79-87+96. in Chinese.
- Flexas J, Medrano H. Drought-inhibition of photosynthesis in C3 plants: stomatal and non-stomatal limitations revisited. Ann Bot. 2002;89(2):183–189. doi:10.1093/aob/mcf027.
- Lei ZY, Han IM, Yi XP, Zhang WF, Zhang YL. Coordinated variation between veins and stomata in cotton and its relationship with water-use efficiency under drought stress. Photosynthetica. 2018;56:1326–1335. doi:10.1007/s11099-018-0847-z.
- Wang W, Wang C, Pan D, Zhang Y, Luo B, Ji J. Effects of drought stress on photosynthesis and chlorophyll fluorescence images of soy bean (Glycine max) seedlings. Int J Agric Biol Eng. 2018;11:196–201.
- Cornic G. Drought stress inhibits photosynthesis by decreasing stomatal aperture – not by affecting ATP synthesis. Trends Plant Sci. 2000;5:187–188. doi:10.1016/S1360-1385(00)01625-3.
- Yang JW, Zhao D, Sun GF, Liu JX, Zhao YX, Shi BS. Effect of drought stress on Viburnum sargentii Koehne photosynthetic characteristics. J Hebei Univ. 2019;39(5):529–535. in Chinese.
- Lai JL, Zhang L, Xue L, Zheng JM, He TY, Chen LY, Rong JD, Zheng YS. Effects of drought stress on the photosynthesis and chlorophyll fluorescencecharacteristics of Bambusa tuldoides ‘Swolleninternode’. J Fujian Agric For Univ. 2019;48:567–575.
- Wang XJ, Wu JH, Yang ZR, Zhang FL, Sun HL, Qiu X, Yi FY, Yang D, Shi FL. Physiological responses and transcriptome analysis of the Kochia prostrata (L.) Schrad. to seedling drought stress. AIMS Genet. 2019;6(2):17. doi:10.3934/genet.2019.2.17.
- Gnirke A, Melnikov A, Maguire J, Rogov P, LeProust EM, Brockman W, Fennell T, Giannoukos G, Fisher S, Russ C, et al. Solution hybrid selection with ultra-long oligonucleotides for massively parallel targeted sequencing. Nat Biotechnol. 2009;27(2):182. doi:10.1038/nbt.1523.
- Li J. The changes of physiological and biochemical characteristic and transcriptome analysis of different varieties of Paeonia suffruticosa Andr. under drought stress. Henan: Henan university of science and technology; 2014. in Chinese.
- Moran JF, Becana M, Iturbe-Ormaetxe I, Frechilla S, Klucas RV, Aparicio-Tejo P. Drought induces oxidative stress in pea plants. Planta. 1994;194:346–352.
- Ali SI, Gaafar AA, Metwally SA, Habba IE. The reactive influences of pre-sowing He-Ne laser seed irradiation and drought stress on growth, fatty acids, phenolic ingredients, and antioxidant properties of Celosia argentea. Sci Hortic. 2020;261:108989. doi:10.1016/j.scienta.2019.108989.
- Wang R, Gao M, Ji S, Wang SS, Meng YL, Zhou ZG. Carbon allocation, osmotic adjustment, antioxidant capacity and growth in cotton under long-term soil drought during flowering and boll-forming period. Plant Physiol Biochem. 2016;107:137-146. doi:10.1016/j.plaphy.2016.05.035.
- Du YL, Zhao Q, Chen LR, Yao XD, Zhang W, Zhang B, Xie FT. Effect of drought stress on sugar metabolism in leaves and roots of soybean seedlings. Plant Physiol Biochem. 2020;146:1–12. doi:10.1016/j.plaphy.2019.11.003.
- Chen W, Yao Q, Patil GB, Agarwal G, Deshmukh RK, Lin L, Wang B, Wang YQ, Prince SJ, Song L, et al. Identification and comparative analysis of differential gene expression in soybean leaf tissue under drought and flooding stress revealed by RNA-Seq. Front Plant Sci. 2016;7:1044. doi:10.3389/fpls.2016.01044.
- Shen CW, Wang J, Jin X, Liu N, Fan XS, Dong CX, Shen QR, Xu YC. Potassium enhances the sugar assimilation in leaves and fruit by regulating the expression of key genes involved in sugar metabolism of Asian pears. Plant Growth Regul. 2017;83(2):287–300. doi:10.1007/s10725-017-0294-z.
- Zhu CB, Xu CF, Liu RM, Lin ZZ, Cheng LR. Expression change of transcription factors of rice under drought stress. Chin Agric Sci Bull. 2019;35(6):108–114. in Chinese.
- Zhang GY, Chen M, Li LC, Xu ZS, Chen XP, Guo JM, Ma YZ. Overexpression of the soybean GmERF3 gene, an AP2/ERF type transcription factor for increased tolerances to salt, drought, and diseases in transgenic tobacco. J Exp Bot. 2009;60(13):3781–3796. doi:10.1093/jxb/erp214.
- Tang YH, Bao XX, Zhi YL, Wu Q, Guo YR, Yin XH, Zeng LQ, Li J, Zhang J, He WL, et al. Overexpression of a MYB family gene, OsMYB6, increases drought and salinity stress tolerance in transgenic rice. Front Plant Sci. 2019;10:168. doi:10.3389/fpls.2019.00168.
- Li ZX, Liu C, Zhang Y, Wang BM, Ran QJ, Zhang JR. The bHLH family member ZmPTF1 regulates drought tolerance in maize by promoting root development and abscisic acid synthesis. J Exp Bot. 2019;70(19):5471–5486. doi:10.1093/jxb/erz307.
- Xiong H, Li JJ, Liu PL, Duan JZ, Zhao Y, Guo X, Li Y, Zhang HL, Ali J, Li ZC. Overexpression of OsMYB48-1, a novel MYB-related transcription factor, enhances drought and salinity tolerance in rice. PLoS One. 2014;9(3):e92913. doi:10.1371/journal.pone.0092913.