
ABSTRACT
There is extensive evidence showing the impact of climate change on the biology and biogeography of species. Adopting drought-tolerant plants to conserve water is a potential adaptation to reduce the consequences of climate change. Accordingly, it was hypothesized that climate change would not affect potential distributions of drought-tolerant species. Here, this hypothesis was tested to model the potential distribution of three drought-resistant plant. Here, the potential distribution of Agropyron cristatum, Agropyron desertorum, and Festuca arundinacea was studied in Iran under current and future climate conditions, using 10 species distribution models. Sixty-two climate change scenarios (19 global climate models (GCMs) under four Representative Concentration Pathways (RCPs)) were used to model the potential distribution of the three plants in Iran in the future. The three species have different responses to predicted climate change due to species-environment interactions, species morphological and physiological advancement. The three species showed different responses to predicted climate change due to species-environment interactions. Festuca arundinacea and Agropyron cristatum will, respectively, experience the most and least severe decline in suitable habitats in the next 50 years. This result is because decreased annual precipitation caused an increase in habitat suitability for A. cristatum, while the same variable had the opposite effect for A. desertorum and F. arundinacea. On the other hand, F. arundinacea grows on moist soils that decreased annual precipitation caused a decrease in habitat suitability. Also, our results have clearly shown that plant species drought-stress tolerant are not immune to climate change and their current distributions undergo significant changes as a result of the changing of climate.
Introduction
There is extensive evidence showing the impact of climate change on the biology and biogeography of species [e.g., Citation1, Citation2, Citation3]. However, predicting how climate change can impact individual species has been challenging.Citation4 As a result of climate change, the current habitats of a large number of species will no longer be able to sustain their presence; consequently, species might need to migrate to suitable climates to stand a chance of survival .Citation2,Citation5–7
There is evidence of species reacting to climate change by migration. In particular, there are extensive data on plant migrations as a result of the pastCitation8 and presentCitation9–11 changes in climate. Plants seem to be responding to the increased availability of water in lower elevation as rain falls more often.Citation12 Such observations indicate the complexity of plants response to climate change, and suggest the response might differ for different latitudes, longitudes, elevations, and biomes. Simultaneously, habitat degradation and fragmentation, and invasive species undermine ecosystem resilience and impede the migration of species.Citation13 Hardly any region is exempt from the impacts of climate change. The rapid pace of climate change might not allow species to adapt fast enough. Therefore, the aftermath of climate change will be far-reaching and profound .Citation14,Citation15
Species distribution has always been one of the most important ecological aspects of biodiversity protection which has been affected by climate change through time. There is considerable support for the importance of environmental variables in limiting species distributions.Citation16 Managers and conservationists widely use statistical species distribution models (SDMs) to predict the potential range shifts in species distributions under climate change scenarios.Citation17,Citation18 SDMs can appropriately assess the impact of climate change on species distribution on both terrestrial [e.g., Citation19, Citation20] and marine species [e.g., Citation21]. A set of environmental conditions suitable for a given species has been defined as a bioclimatic envelope.Citation22 It has been obtained by associating the current climate variables with species occurrences using statistically or theoretically derived methods. Assessing shifts of the bioclimatic envelope under climate change scenarios can predict any shift in the species current range.Citation21
There is an important question that is how plant species will respond to climate change in the future, especially drought-resistant plant species. The drought-tolerant plant species grow naturally in different climates. Adopting drought-tolerant plants to conserve water is a potential adaptation to reduce the consequences of climate change .Citation23,Citation24
Accordingly, it was hypothesized that climate change will not affect potential distributions of drought-tolerant species. Here, this hypothesis was tested using ten different algorithms to model the potential distribution of three drought-resistant plant species, namely Agropyron cristatum, Agropyron desertorum, and Festuca arundinacea in Iran under current and future climate conditions. Tall fescue (F. arundinacea) is widely distributed in temperate regions. It is a perennial bunchgrass with the ability to grow in a range of climates and has shown high tolerance to diseases and weeds.Citation25,Citation26 These properties have made F. arundinacea popular in agriculture, landscaping, and phytoremediation. However, hot summer temperature adversely affects this species and reduces its growth and productivity.Citation27 Genus Agropyron includes the wild relatives of wheat. Species in the genus exhibit a host of useful traits such as tolerance to biotic and abiotic stressors such as low temperatures, salt, pathogens, and pests.Citation28,Citation29 Agropyron cristatum and A. desertorum represent the typical traits of genus Agropyron and are found in the majority of temperate regions. All three species are used as forage for livestock and wildlife and have found applications in weed control, soil conservation, and watershed management. All three species are widely distributed in Iran. Agropyron desertorum, and F. arundinacea are distributed in the north, northeast, northwest and center and A. cristatum is mainly distributed in the northern regions of Iran.Citation30,Citation31 Our goals include: (1) to determine the current and future distribution of the plant species in Iran, (2) to determine the major environmental parameters that dictate habitat suitability for the plant species, and (3) to evaluate the effect of climate change on habitat suitability for the plant species in the future.
Methods
Study area
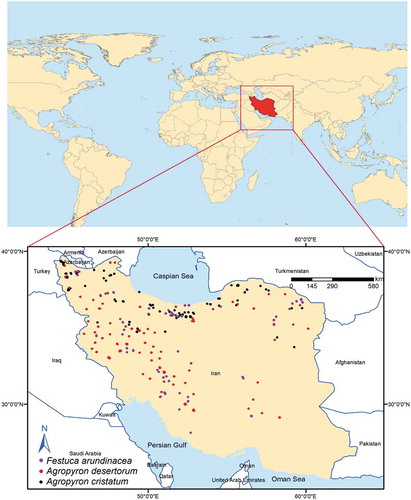
Iran is located in the Middle East between latitudes 24° and 40°N, and longitudes 44° and 64°E at 1,648,195 square kilometers (). Iran has a broad spectrum of climatic conditions across regions with significant annual precipitation variability (120 to 2000 mm yr−1) and temperature variability (−20 to 50°C). Previous studies revealed that wet regions of the country would receive more precipitation while dry regions will receive less. Analysis of daily precipitation intensities indicated more frequent and larger‐intensity floods in the wet regions and more prolonged droughts in the dry regions [e.g., Citation32, Citation33].
Figure 1. Study area location and studied species occurrences
Presence records
Occurrence records and distribution of the species were obtained from herbariums of Ferdowsi University of Mashhad, Tehran University, and University of Birjand. Relevant literatureCitation34–37 was also consulted, including Flora IranicaCitation31 and Flora of Iran.Citation30 Herbaria data were obtained from field samplings between 2009 and 2019. The coordinates of all the occurrence points were recorded using a hand-held multichannel Global Positioning System (GPS) receiver with a positional accuracy of ±5 m. The spatially correlated presence records were removed using spatial autocorrelation and Moran’s I test. The number of presence records was 156 for Agropyron cristatum, 171 for Agropyron desertorum, and 154 for Festuca arundinacea ().
Environmental variables
Topography, geology, soil and climate variables were supplied as input for SDMs. The National Cartographic Center of Iran (NCC) and Geological Survey and mineral exploration of Iran (GSI) provided topography, geology, and soil variables at 1:25000 scale. Mean elevation and slope were the only topography variables used in modeling. The digital elevation model was used to generate mean elevation and slope variables using ARCGIS software version 10.2 at 1 km2 spatial resolution. The soil variable includes soil orders that consist of 20 classes. The classes include Alfisol, Aridisol, Entisol/Alfisol, Entisol/Inceptisol, Inceptisol, Inceptisol/Vertisol, Mollisol, Badland, Coastal Sand, Dune Land, Kalut, Marsh, Playa, Rock Outcrop/Entisol, Rock Outcrop/Inceptisol, Rocky Land, Salt Flat, Salt Pug, Urban, Water Body. The geology variable of the study area has 557 classes. The geologic map shows the types and ages of rocks and younger deposits found at or near the Earth surface. For climate variables, the set of 19 climate variables was provided by the Worldclim databaseCitation38 at 1 km2 spatial resolution. Monthly solar radiation for a 12-month period was also obtained from Worldclim database at 1 km2 spatial resolution. All variables were used as raster with 1 km2 spatial resolution prepared by a resample analysis in ARCGIS software version 10.2. The climate data contains monthly air temperature and precipitation, which has been obtained from a global network using long-term time series from 1950 to 2000.
The climate projections for the year 2070 under 62 climate change scenarios, including four representative concentration pathways (RCPs) and 19 general circulation models (GCMs), was the base for the future climate data. Different scenarios were used to select the best-performing projection. These data were used to study habitat suitability for the selected species in the present and future. Representative concentration pathways were proposed by the IPCC in its fifth report in 2014 as predictions of greenhouse gas concentrations.Citation39 The four concentrations (490, 650, 850, and >1370 ppm CO2-equivalent) are titled RCP 26, 45, 60, and 85, respectively.Citation40 GCMs simulate the general circulation patterns of a planet atmosphere or oceans using mathematical models (see Table S4). Topography variables were excluded from the forecasting model of the future because future changes are expected to happen in the climate variables linked to topography and not topography by itself.Citation20
To omit redundant variables, the correlation between variables was tested using Pearson’s correlation analysis [‘Raster Correlations and Summary Statistics’ implemented in SDM Toolbox: cf. Citation41]. If −0.7 > r > +0.7, one variable was omitted from modeling. Doing so produced a set of final 12 variables used as input for habitat modeling ().
Table 1. Environmental variables to model habitat suitability of the studied species
SDM analysis
Ten different algorithms in four broad categories (machine learning, classification, regression-based, and enveloping) were used to determine habitat suitability for the species (). The general framework for this study is shown in Figure S1.
Table 2. The SDM algorithms used in this research and their required type of dependent variables
To develop the algorithms for the studied species, the Biomod2 package, version 3.3–7 in R version 3.1.25Citation14 was used.Citation51 Since both presence and absence of species are required to fit SDMs, and because only the presence records were available, pseudo-absences were generated randomly with an equal number of presences.Citation52 In our study, bootstrapping with 10 cycles was performed. The following two indices of model performance were used to evaluate the models by randomly assigning 70% and 30% of presence records as training and test data, respectively. The first index is the area under the ROC–plot curve [AUC; Citation53] in which 0 and 1 mean the worst and best predictions, respectively. The second index is the True Skill Statistics [TSS; Citation54], in which −1 and 1 mean the worst and best predictions, respectively. The best model was selected by the highest TSS and AUC values among models and climate change scenarios. Here, model performance is either categorized as poor (< 0.4), moderate (0.4–0.7), and good (>0.7). The importance of each environmental variable for each species in the models was assessed in Biomod2 by randomizing each variable individually and then projecting the model with the randomized variable while keeping the other variables unchanged. The model predictions containing the randomized variable were further correlated with those of the original models. Finally, the importance of the variable was calculated as one minus the correlation; higher values indicate predictors that are more important for the model.Citation51 Finally, the best-performing model with current data was used to project it into future scenarios. Then, the obtained habitat types (poor, moderate, and good) were compared between current and future conditions to assess the possible change in habitats. New future climate conditions, that is, those not observed for an area currently, were detected using mobility-oriented parity (MOP) and the multivariate environmental similarity surface (MESS) .Citation55 MOP identifies future environmental conditions not available in current climate conditions, while MESS assesses the level of similarity between climate scenarios. Results showed that to establish those areas of strict model extrapolation from those areas with environmental conditions present in Iran. MOP and MESS were performed in R with a sample of 10% of the pixels in the environmental variables.
Results
The area under the ROC–plot curve and true skill statistics values were between 0.50 and 0.94 for the models in current and future times .The BCC-CSM1-1, RCP45 scenario reached the highest TSS and AUC values for the three species in future times . MaxEnt had the highest TSS and AUC values among the models for A. cristatum and A. desertorum, and random forest for F. arundinacea in the current and future times.
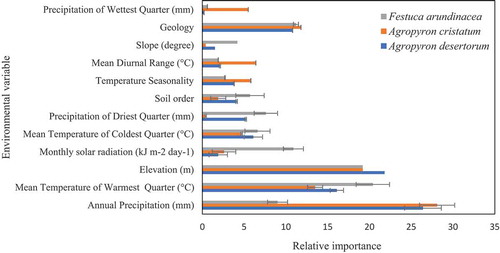
The importance of environmental variables varied for different species () and demonstrated different patterns (). Environmental variables that contributed the most to modeling the potential distribution of all species were annual precipitation, the mean temperature of the warmest quarter, mean temperature of coldest quarter, and geology. Meanwhile, some variables have a high contribution to one species only. For example, solar radiation is important for modeling habitat for F. arundinacea, while precipitation is important for A. cristatum.
Figure 2. Importance of environmental variables for A. desertorum, A. cristatum, and F. arundinacea. (error bars indicate differences between current and future condition for each species, the importance of environmental variables generated by MaxEnt model for A. cristatum and A. desertorum and RF model for F. arundinacea under current and future condition (BCC-CSM1-1, RCP45 scenario))
Response curves revealed the direction of effect for the most important variables (). The increased mean temperature of the coldest quarter and mean temperature of the warmest quarter caused a decrease in habitat suitability for the three species. Also, increased annual precipitation caused an increase in habitat suitability for A. desertorum and F. arundinacea, while the same variable had the opposite effect on A. cristatum. Comparing predictive maps with elevation classes indicated that all species would disappear in sites located below 500 m, and expand its range toward sites located between 500 and 3500 m during future projections ().
Figure 3. Relationships between environmental variables and the probability of presence for A. desertorum, A. cristatum, using MaxEnt model and F. arundinacea using RF model under current and future condition (BCC-CSM1-1, RCP45 scenario) (red curves show the mean response and blue margins are ± SD)
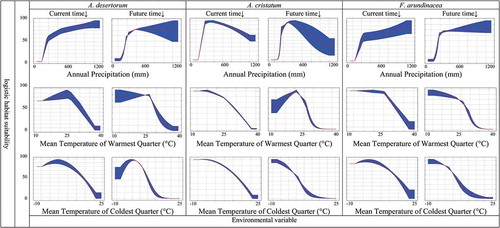
Figure 4. Habitat suitability shifts of A. desertorum, A. cristatum, and F. arundinacea in relation to elevation under current and future condition. (the data generated by MaxEnt model for A. cristatum and A. desertorum and RF model for F. arundinacea under current and future condition (BCC-CSM1- 1, RCP45 scenario))
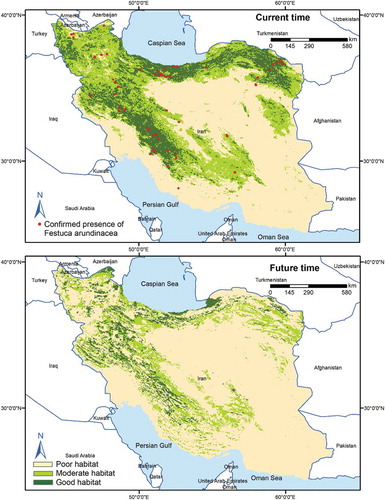
Our findings showed that suitable habitats (moderate and good habitat suitability) for all three species would decline in the future (). Results also showed that 26% of F. arundinacea’s moderate habitats and 23% of its good habitats would remain stable by 2070, while 66% of the moderate habitats and 46% of the good habitats for the species will be lost . Also, the moderate and good habitats for A. cristatum, respectively, 46% and 35% will maintain their current suitability by 2070, while 41% of the moderate habitats and 5% of the good habitats will no longer be able to support the species (). Of the moderate habitats for A. desertorum, 26% will retain their current level of suitability by 2070, and 30% of the good habitats for the species will still be able to support the species by 2070. However, 64% of the moderate habitats and 16% of the good habitats will be lost in the next 50 years (). The results of the multivariate environmental similarity surface analyses showed broad areas with similar environmental conditions between current and future climate conditions in all 62 climate change scenarios. The mobility-oriented parity analyses also revealed that the future projection at BCC-CSM1-1, RCP45 has the minimum extrapolated areas among the 62 climate change scenarios.
Figure 5. Habitat suitability map for F. arundinacea in the current and future time using RF model under current and future condition (BCC-CSM1-1, RCP45 scenario)
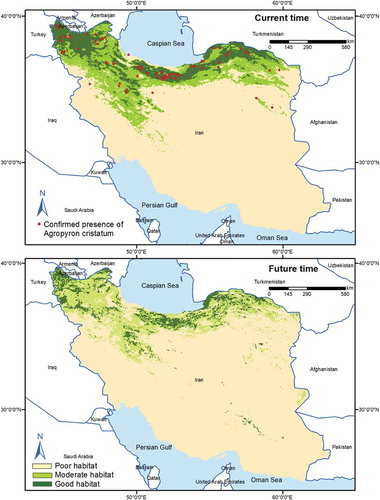
Figure 6. Habitat suitability map for A. cristatum in the current and future time using MaxEnt model under current and future condition (BCC-CSM1-1, RCP45 scenario)
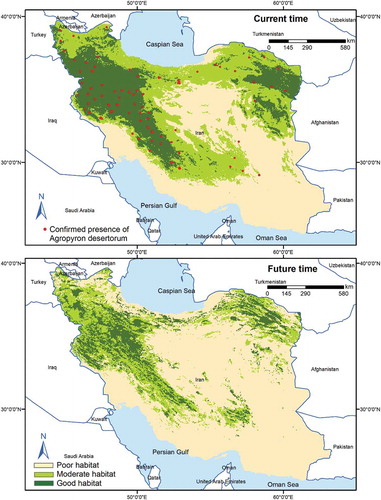
Figure 7. Habitat suitability map for A. desertorum in the current and future time using MaxEnt model under current and future condition (BCC-CSM1-1, RCP45 scenario)
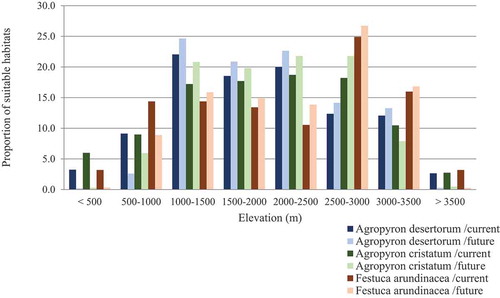
Table 3. Changes in area and proportion of suitable habitats for A. desertorum, A. cristatum, using MaxEnt model and F. arundinacea using RF model under current and future condition (BCC-CSM1-1, RCP45 scenario] (km2 and %)
Discussion
Based on our projections, all species will retreat to the central parts of their current suitable habitats (moderate and good habitat suitability) under climate change. The extent and spatial pattern of distribution shifts varied substantially, according to species (). The species also respond similarly to variables in the current and future times. However, the optimal intervals might be different. For A. cristatum, under climate change scenarios, suitable habitats shift from the mean temperature of the warmest quarter of 10–18°C in current conditions to 20–25°C in the future conditions. Plant species could circumvent the impacts of climate change through migration. However, migration is limited by the displacement capability of species. Some species show the geographical pattern of adaptation by migrating to a higher elevation.Citation56,Citation57 In this study, all species showed a range shift toward higher elevation (). Such phenomenon was reported for mountain plant species in northern Africa (e.g., Rosa arabica), Citation58,Citation59 Middle EastCitation2 and in the Mediterranean mountains.Citation60 Our study indicated that habitats in areas lower than 500 m are unsuitable for these plant species. In the near future, it would be expecting a fluctuation in the species occurrence between 500 and 3500 m.
Adaptation and acclimation can be interpreted indirectly by SDMs results under climate change.Citation61–63 Moreover, as a general principle, high genetic variation in natural populations enhances the potential for disease and pest resistance and adaptation to environmental change, including climate change.Citation64 Previous studies have shown that these three species have high levels of genetic variation in Iran.Citation65–68 The rate of genetic variation determines the ability of species to sense changes in the habitat and make a plastic response.Citation69 Therefore, SDMs should also consider genetic variation in plant species, which could improve accuracy .Citation70
The different responses depend not only on the climate variables that SDMs used but also on many non-climate factors as well as the individual plant morphological and physiological advancement and its ability to cope with an adverse climate.Citation71 The three species showed different responses to predicted climate change due to species-environment interactions. Festuca arundinacea and Agropyron cristatum will, respectively, experience the most and least severe decline in suitable habitats in the next 50 years. This result is because decreased annual precipitation caused an increase in habitat suitability for A. cristatum, while the same variable had the opposite effect for A. desertorum and F. arundinacea. On the other hand, F. arundinacea grows on moist soils that decreased annual precipitation caused a decrease in habitat suitability. Agropyron desertorum, and F. arundinacea are predicted to lose more than 50% of their current distribution ranges (). The lost suitable habitats are related to 15, 18, 16% of the actual distribution of A. cristatum, A. desertorum, and F. arundinacea, respectively. Therefore, future climate change can significantly impact the shifting distributions of these species. Moderate and good habitats for these species are mostly located in rangelands that are particularly at risk of overgrazing. Overgrazing can substantially worsen the negative impact of climate change, especially in arid habitats, where fragile assemblages of plant and threatened animal species are present, representing a serious threat to maintaining the food chain’s function.Citation72 Iran has the maximum density of domestic sheep among arid countries in the world, ahead of Sudan and Australia. The sheep and goat population in Iran has been doubled in the last 40 years.Citation73 Iran has twice as many domesticated animals as the capacity of its rangelands allows. In some areas, the livestock population has reached five times the current carrying capacity.Citation72
SDMs have limitations and assumptions. For example, SDMs can be influenced by sampling bias, Citation74 sample size, Citation75 multicollinearity, and spatial autocorrelation.Citation76 Also, SDMs can be used to forecast species distribution under future conditions but the level of uncertainty of those models can be very high.Citation77,Citation78 Using MaxEnt in habitat evaluation studies has become a common practice.Citation79 Nevertheless, MaxEnt has drawbacks such as presence-only models underperform in species distribution modeling compared to presence-absence models, since absence data can help indicate absence points for speciesCitation80 and MaxEnt can take advantage of museum and atlas data, which provide presence-only data. However, there are biases in data provided by museums, herbariums, and atlases toward accessible areas or areas where species are expected to occur. Our data face the same challenges. Rather than being collected with prior sampling strategies such as random or systematic sampling, data in museums and atlases are gathered without particular sampling schemes, and without any particular purpose in mind.Citation81 Biases in sampling intensity can arise because data has not been collected according to a prior plan (such as random or stratified sampling).Citation82 As opposed to presence-absence models, presence-only models such as MaxEnt are strongly affected by such sampling biases. On the other hands, MaxEnt has also been shown to be superior to other species distribution models, specifically for evaluating expanded uncertainty in modeling.
Our results have demonstrated that even plant species drought-stress tolerant are not immune to climate change and will see their current distributions undergo significant changes due to climatic changes. It should be noted that this research used the BCC-CSM1-1, RCP45 scenario because the future projection in BCC-CSM1-1, RCP45 has the minimum extrapolation areas among the 62 climate change scenarios. However, future economic development, especially in China and the United States, will determine the direction of development in the world. As a result, an increase in greenhouse gas emissions and an increase in the Earth’s temperature are expected. These future phenomena will possibly cause further impacts on plant distributions. These results are crucial for notifying long-term management activations aimed to reduce the effect of wildlife-human conflict.
Data Availability
Some or all data, models, or code that support the findings of this study are available from the corresponding author upon reasonable request.
Supplemental Material
Download MS Word (50.9 KB)Acknowledgments
This work was supported by Iran National Science Foundation [grant numbers 96015179].
Supplementary material
Supplemental data for this article can be accessed on the publisher’s website.
References
- Bateman BL, VanDerWal J, Williams SE, Johnson CN. Biotic interactions influence the projected distribution of a specialist mammal under climate change. Diversity and Distributions. 2012;18(9):1–11. doi:10.1111/j.1472-4642.2012.00922.x.
- Khanum R, Mumtaz AS, Kumar S. Predicting impacts of climate change on medicinal asclepiads of Pakistan using Maxent modeling. Acta Oecologica. 2013;49:23–31. doi:10.1016/j.actao.2013.02.007.
- Zhang K, Yao L, Meng J, Tao J. Maxent modeling for predicting the potential geographical distribution of two peony species under climate change. Science of the Total Environment. 2018;634:1326–1334. doi:10.1016/j.scitotenv.2018.04.112.
- Pereira HM, Leadley PW, Proença V, Alkemade R, Scharlemann JP, Fernandez-Manjarrés JF, Chini L, Balvanera P, Biggs R, Cheung WWL. Scenarios for global biodiversity in the 21st century. Science. 2010;330(6010):1496–1501. doi:10.1126/science.1196624.
- Duffy KJ, Jacquemyn H, Buckley Y. Climate change increases ecogeographical isolation between closely related plants. Journal of Ecology. 2019;107(1):167–177. doi:10.1111/1365-2745.13032.
- Loarie SR, Carter BE, Hayhoe K, McMahon S, Moe R, Knight CA, Ackerly DD, McClain CR. Climate change and the future of California’s endemic flora. PloS One. 2008;3(6):e2502. doi:10.1371/journal.pone.0002502.
- Warren R, VanDerWal J, Price J, Welbergen JA, Atkinson I, Ramirez-Villegas J, Lowe J, Jarvis A, Shoo LP, Williams SE. Quantifying the benefit of early climate change mitigation in avoiding biodiversity loss. Nat Clim Chang. 2013;3(7):678. doi:10.1038/nclimate1887.
- Muller SD, Richard PJ. Post-glacial vegetation migration in conterminous Montréal Lowlands, southern Québec. J Biogeogr. 2002;28(10):1169–1193. doi:10.1046/j.1365-2699.2001.00625.x.
- Lenoir J, Gégout JC, Marquet PA, De Ruffray P, Brisse H. A significant upward shift in plant species optimum elevation during the 20th century. science. 2008;320(5884):1768–1771. doi:10.1126/science.1156831.
- Meineri E, Skarpaas O, Vandvik V. Modeling alpine plant distributions at the landscape scale: do biotic interactions matter? Ecol Modell. 2012;231:1–10. doi:10.1016/j.ecolmodel.2012.01.021.
- Crimmins SM, Dobrowski SZ, Greenberg JA, Abatzoglou JT, Mynsberge AR. Changes in climatic water balance drive downhill shifts in plant species’ optimum elevations. Science. 2011;331(6015):324–327. doi:10.1126/science.1199040.
- Allen CD, Breshears DD. Drought-induced shift of a forest–woodland ecotone: rapid landscape response to climate variation. Proceedings of the National Academy of Sciences. 1998;95(25):14839–14842. doi:10.1073/pnas.95.25.14839.
- Guida RJ, Abella SR, Smith JWJ, Stephen H, Roberts CL. Climatic change and desert vegetation distribution: assessing thirty years of change in Southern Nevada’s mojave desert. The Professional Geographer. 2014;66(2):311–322. doi:10.1080/00330124.2013.787007.
- Iverson LR, Prasad AM. Predicting abundance of 80 tree species following climate change in the eastern United States. Ecol Monogr. 1998;68(4):465–485. doi:10.1890/0012-9615(1998)068[0465:PAOTSF]2.0.CO;2.
- Wiens JJ. The niche. Biogeography and Species Interactions Philosophical Transactions of the Royal Society B: Biological Sciences. 2011;366(1576):2336–2350. doi:10.1098/rstb.2011.0059.
- Fitzpatrick MC, Hargrove WW. The projection of species distribution models and the problem of non-analog climate. Biodivers Conserv. 2009;18(8):2255. doi:10.1007/s10531-009-9584-8.
- Graham CH, Hijmans RJ. A comparison of methods for mapping species ranges and species richness. Global Ecology and Biogeography. 2006;15(6):578–587. doi:10.1111/j.1466-8238.2006.00257.x.
- Bhattacharyya S, Mungi NA, Kawamichi T, Rawat GS, Adhikari BS, Wilkening JL. Insights from present distribution of an alpine mammal Royle’s pika (ochotona roylei) to predict future climate change impacts in the Himalaya. Regional Environmental Change. 2019;19(8):2423–2435. doi:10.1007/s10113-019-01556-x.
- Kumar P. Assessment of impact of climate change on rhododendrons in Sikkim himalayas using Maxent modelling: limitations and challenges. Biodivers Conserv. 2012;21(5):1251–1266. doi:10.1007/s10531-012-0279-1.
- Jones MC, Dye SR, Fernandes JA, Frölicher TL, Pinnegar JK, Warren R, Cheung WW. Predicting the impact of climate change on threatened species in UK waters. PLoS One. 2013;8(1):1. doi:10.1371/journal.pone.0054216.
- Cheung WW, Lam VW, Pauly D. Modelling present and climate-shifted distribution of marine fishes and invertebrates. Canada: Fisheries Centre, University of British Columbia; 2008.
- Bryan E, Deressa TT, Gbetibouo GA, Ringler C. Adaptation to climate change in Ethiopia and South Africa: options and constraints. Environ Sci Policy. 2009;12(4):413–426. doi:10.1016/j.envsci.2008.11.002.
- Fan Y, McCann L, Qin H. Households’ adoption of drought tolerant plants: an adaptation to climate change? Journal of Agricultural and Resource Economics. 2017;42:236–254.
- Bokmeyer JM, Bonos SA, Meyer WA. Broad-sense heritability and stability analysis of brown patch resistance in tall fescue. HortScience. 2009;44(2):289–292. doi:10.21273/HORTSCI.44.2.289.
- Sellmann MJ, Brede AD, Bonos SA, Meyer WA, Funk CR, Branch WD, Bernhardt JL. 2355461 Registration of’Inferno’Tall Fescue. Crop Sci. 2006;46(5):2307–2308. doi:10.2135/cropsci2005.12.0482.
- Li H, Hu T, Amombo E, Fu J. Genome-wide identification of heat stress-responsive small RNAs in tall fescue (Festuca arundinacea) by high-throughput sequencing. J Plant Physiol. 2017;213:157–165. doi:10.1016/j.jplph.2017.03.004.
- Dewey DR. The genomic system of classification as a guide to intergeneric hybridization with the perennial Triticeae. In Gene manipulation in plant improvement. 1984:209–279. Boston: Springer.
- Dong YS, Zhou RH, Xu SJ, Li LH, Cauderon Y, Wang RRC. Desirable characteristics in perennial Triticeae collected in China for wheat improvement. Hereditas. 1992;116:175–178. doi:10.1111/j.1601-5223.1992.tb00819.x.
- Assadi M, Maassoumi AA, Khatamsaz M, Mozaffarian V, Eds. Flora of Iran . vols 1–76.1988–2017. Tehran: Research Institute of Forests and Rangelands Publications.
- Rechinger KH (Eds.) 1963–2015. Flora Iranica vols 1–181 Akademische Druck- u Verlagsanstalt Graz; vol 175 Akademische Verlagsgesellschaft Salzburg; vols 176–181. Verlag des Naturhistorischen Museums Wien.
- Abbaspour KC, Faramarzi M, Ghasemi SS, Yang H. Assessing the impact of climate change on water resources in Iran. Water Resour Res. 2009;45(10):10. doi:10.1029/2008WR007615.
- Karimi V, Karami E, Keshavarz M. Climate change and agriculture: impacts and adaptive responses in Iran. Journal of Integrative Agriculture. 2018;17(1):1–15. doi:10.1016/S2095-3119(17)61794-5.
- Ahmadi A, Shahmoradi A. An aut-ecological study of agropyron cristatum in west Azerbaijan province. Iranian Journal of Natural Resources. 2005;58:691–700.
- Amir Khani M, Mesdaghi M, Dianati Tilaki GA. An investigation on ecological characteristics of agropyron cristatum in golestan national park. Pajouhesh-va-sazandegi. 2006;19:81–88.
- Memar SH, Behjoo K, Behtari B, Zandi Esfahan E, Pirmohamadi Bardeh M. Trends of fescue seed germination (festuca arundinacea schreb) during accelerated ageing test. J Plant Res. 2018;30:249–363.
- Shokrollahi SH, Moradi HR, Dianati Tilaki G. A survey of some environmental factors affecting on distribution of Agropyron cristatum (case study: polur summer rangelands mazandaran province). Watershed Management Researches. 2012;25:111–119.
- Worldclim. 2019. Climatic variable. Available online http://wwwworldclimorg. 2019 Aug 10
- Rogelj J. Long-term climate change: projections commitments and irreversibility In Climate Change 2013: the physical science basis IPCC working group I contribution to AR5—the physical science basis IPCC working group I contribution to AR5. 2013: 1029–1136. Cambridge: Cambridge University Press Cambridge UK and New York USA.
- Meinshausen M, Smith SJ, Calvin K, Daniel JS, Kainuma MLT, Lamarque JF, Thomson AGJMV, Montzka SA, Raper SCB, Riahi K. The RCP greenhouse gas concentrations and their extensions from 1765 to 2300. Clim Change. 2011;109(1–2):213. doi:10.1007/s10584-011-0156-z.
- Brown JL. SDM toolbox: a python‐based GIS toolkit for landscape genetic. Biogeographic and Species Distribution Model Analyses Methods in Ecology and Evolution. 2014;5:694–700.
- Lek S, Guégan JF. Artificial neural networks as a tool in ecological modelling an introduction. Ecol Modell. 1999;120(2–3):65–73. doi:10.1016/S0304-3800(99)00092-7.
- Elith J, Leathwick JR, Hastie T. A working guide to boosted regression trees. Journal of Animal Ecology. 2008;77(4):802–813. doi:10.1111/j.1365-2656.2008.01390.x.
- Phillips SJ, Anderson RP, Schapire RE. Maximum entropy modeling of species geographic distributions. Ecol Modell. 2006;190(3–4):231–259. doi:10.1016/j.ecolmodel.2005.03.026.
- Friedman JH. Multivariate adaptive regression splines. The Annals of Statistics. 1991;19:1–67.
- Breiman L. Random forests. Mach Learn. 2001;45(1):5–32. doi:10.1023/A:1010933404324.
- Vayssières MP, Plant RE, Allen-Diaz BH. Classification trees: an alternative non-parametric approach for predicting species distributions. Journal of Vegetation Science. 2000;11(5):679–694. doi:10.2307/3236575.
- Hastie T, Tibshirani R, Buja A. Flexible discriminant analysis by optimal scoring. J Am Stat Assoc. 1994;89(428):1255–1270. doi:10.1080/01621459.1994.10476866.
- Guisan A, Edwards JTC, Hastie T. Generalized linear and generalized additive models in studies of species distributions: setting the scene. Ecol Modell. 2002;157(2–3):89–100. doi:10.1016/S0304-3800(02)00204-1.
- Busby J. BIOCLIM-a bioclimate analysis and prediction system.. 1991;6:8–9. Australia: Plant protection quarterly.
- Thuiller W, Georges D, Engler R 2014. biomod2: ensemble platform for species distribution modeling R package version 31-64. Availablt at: http://CRANR-projectorg/package=biomod2 (accessed February 2015).
- Barbet‐Massin M, Jiguet F, Albert CH, Thuiller W. Selecting pseudo‐absences for species distribution models: how where and how many? Methods in Ecology and Evolution. 2012;3(2):327–338. doi:10.1111/j.2041-210X.2011.00172.x.
- Fielding AH, Bell JF. A review of methods for the assessment of prediction errors in conservation presence/absence models. Environ Conserv. 1997;24(1):38–49. doi:10.1017/S0376892997000088.
- Allouche O, Tsoar A, Kadmon R. Assessing the accuracy of species distribution models: prevalence kappa and the true skill statistic (TSS). Journal of Applied Ecology. 2006;43(6):1223–1232. doi:10.1111/j.1365-2664.2006.01214.x.
- Owens HL, Campbell LP, Dornak LL, Saupe EE, Barve N, Soberón J, Peterson AT, Lira-Noriega A, Hensz CM, Myers CE. Constraints on interpretation of ecological niche models by limited environmental ranges on calibration areas. Ecol Modell. 2013;263:10–18. doi:10.1016/j.ecolmodel.2013.04.011.
- Abolmaali SMR, Tarkesh M, Bashari H. MaxEnt modeling for predicting suitable habitats and identifying the effects of climate change on a threatened species Daphne mucronata in central Iran. Ecol Inform. 2018;43:116–123. doi:10.1016/j.ecoinf.2017.10.002.
- Midgley GF, Hughes GO, Thuiller W, Rebelo AG. Migration rate limitations on climate change‐induced range shifts in cape proteaceae. Diversity and Distributions. 2006;12(5):555–562. doi:10.1111/j.1366-9516.2006.00273.x.
- Abdelaal M, Fois M, Fenu G, Bacchetta G. Using MaxEnt modeling to predict the potential distribution of the endemic plant rosa arabica crép in Egypt. Ecol Inform. 2019;50:68–75. doi:10.1016/j.ecoinf.2019.01.003.
- Al-Qaddi N, Vessella F, Stephan J, Al-Eisawi D, Schirone B. Current and future suitability areas of kermes oak (Quercus coccifera L) in the Levant under climate change. Regional Environmental Change. 2017;17(1):143–156. doi:10.1007/s10113-016-0987-2.
- Fois M, Cuena-Lombrana A, Fenu G, Cogoni D, Bacchetta G. The reliability of conservation status assessments at regional level: past present and future perspectives on gentiana lutea L ssp lutea in Sardinia. Journal for Nature Conservation. 2016;33:1–9. doi:10.1016/j.jnc.2016.06.001.
- Crossman ND, Bryan BA, Summers DM. Identifying priority areas for reducing species vulnerability to climate change. Diversity and Distributions. 2012;18(1):60–72. doi:10.1111/j.1472-4642.2011.00851.x.
- Koo KA, Park SU, Kong WS, Hong S, Jang I, Seo C. Potential climate change effects on tree distributions in the Korean Peninsula: understanding model climate uncertainties. Ecol Modell. 2017;353:17–27. doi:10.1016/j.ecolmodel.2016.10.007.
- Matteodo M, Wipf S, Stöckli V, Rixen C, Vittoz P. Elevation gradient of successful plant traits for colonizing alpine summits under climate change. Environ Res Lett. 2013;8(2):024043. doi:10.1088/1748-9326/8/2/024043.
- Jump AS, Marchant R, Peñuelas J. Environmental change and the option value of genetic diversity. Trends Plant Sci. 2009;14(1):51–58. doi:10.1016/j.tplants.2008.10.002.
- Jafari AA, Seyed MA, Abdi N. Study of variation for seed yield and seed components in 31 genotypes of Agropyron desertorum through factor analysis. Iranian Journal of Rangelands and Forests Plant Breeding and Genetic Research. 2007;15:211–221.
- Majidi MM, Mirlohi A, Amini F. Genetic variation heritability and correlations of agro-morphological traits in tall fescue (festuca arundinacea schreb). Euphytica. 2009;167(3):323–331. doi:10.1007/s10681-009-9887-6.
- Majidi MM, Mirlohi A. Genetic similarities among Iranian populations of festuca lolium bromus and agropyron using amplified fragments length polymorphism (AFLP) markers. Iranian Journal of Biotechnology. 2010;8:16–23.
- Taghizadeh R, Jafari AA, Imani AA, Asghari A, Choukan R. Investigation of genetic variability in Iranian populations of desert wheatgrass (Agropyron desertorum) based on morphological and RAPD markers. Iranian Journal of Rangelands and Forests Plant Breeding and Genetic Research. 2011;19:85–100.
- Nicotra AB, Atkin OK, Bonser SP, Davidson AM, Finnegan EJ, Mathesius U, Van Kleunen M, Purugganan MD, Richards CL, Valladares F. Plant phenotypic plasticity in a changing climate. Trends Plant Sci. 2010;15(12):684–692. doi:10.1016/j.tplants.2010.09.008.
- Russell J, Van Zonneveld M, Dawson IK, Booth A, Waugh R, Steffenson B, Xu M. Genetic diversity and ecological niche modelling of wild barley: refugia large-scale post-LGM range expansion and limited mid-future climate threats? PloS One. 2014;9(2):e86021. doi:10.1371/journal.pone.0086021.
- Lamsal P, Kumar L, Aryal A, Atreya K. Invasive alien plant species dynamics in the himalayan region under climate change. Ambio. 2018;47(6):697–710. doi:10.1007/s13280-018-1017-z.
- Jowkar H, Ostrowski S, Tahbaz M, Zahler P. The conservation of biodiversity in Iran: threats challenges and hopes. Iranian Studies. 2016;49(6):1065–1077. doi:10.1080/00210862.2016.1241602.
- Amiraslani F, Dragovich D. Combating desertification in Iran over the last 50 years: an overview of changing approaches. J Environ Manage. 2011;92(1):1–13. doi:10.1016/j.jenvman.2010.08.012.
- Kadmon R, Farber O, Danin A. Effect of roadside bias on the accuracy of predictive maps produced by bioclimatic models. Ecological Applications. 2004;14(2):401–413. doi:10.1890/02-5364.
- Stockwell DR, Peterson AT. Effects of sample size on accuracy of species distribution models. Ecol Modell. 2002;148(1):1–13. doi:10.1016/S0304-3800(01)00388-X.
- Segurado PAGE, Araújo MB, Kunin WE. Consequences of spatial autocorrelation for niche‐based models. Journal of Applied Ecology. 2006;43(3):433–444. doi:10.1111/j.1365-2664.2006.01162.x.
- Diniz‐Filho JA, Mauricio Bini L, Fernando Rangel T, Loyola RD, Hof C, Nogués‐Bravo D, Araújo MB. Partitioning and mapping uncertainties in ensembles of forecasts of species turnover under climate change. Ecography. 2009;32(6):897–906. doi:10.1111/j.1600-0587.2009.06196.x.
- Terribile LC, Lima-Ribeiro MS, Araújo MB, Bizão N, Collevatt RG, Dobrovolski R, Franco AA, Guilhaumon F, Lima JD, Murakami DM, et al. Areas of climate stability of species ranges in the Brazilian Cerrado: disentangling uncertainties through time. Natureza & Conservação. 2012;10(2):152–159. doi:10.4322/natcon.2012.025.
- Fourcade Y, Besnard AG, Secondi J. Paintings predict the distribution of species or the challenge of selecting environmental predictors and evaluation statistics. Global Ecology and Biogeography. 2018;27(2):245–256. doi:10.1111/geb.12684.
- Lahoz‐Monfort JJ, Guillera‐Arroita G, Wintle BA. Imperfect detection impacts the performance of species distribution models. Global Ecology and Biogeography. 2014;23(4):504–515. doi:10.1111/geb.12138.
- Elith J, Graham CH, Anderson RP, Dudík M, Ferrier S, Guisan A, Li J. Novel methods improve prediction of species’ distributions from occurrence data. Ecography. 2006;29(2):129–151.
- Guillera‐Arroita G, Lahoz‐Monfort JJ, Elith J, Gordon A, Kujala H, Lentini PE, Wintle BA, Tingley R, Wintle BA. Is my species distribution model fit for purpose? Matching data and models to applications. Global Ecology and Biogeography. 2015;24(3):276–292. doi:10.1111/geb.12268.
- Rajan A, Kuang YC, Ooi MPL, Demidenko SN 2017. Moments and maximum entropy method for expanded uncertainty estimation in measurements In 2017. RIEEE International Instrumentation and Measurement Technology Conference (I2MTC) (pp 1–6). Turin, Italy: IEEE.