
ABSTRACT
The temporal evolution of the electrical signal generated by Pinus halepensis was measured in a sample of 15 trees. Weekly experiments were carried out during a long-term campaign lasting over a year, while trials with a high frequency of measurements were also performed during several days. In the latter case, day-night oscillations of the electrical magnitudes were observed. Additionally, punctual meteorological events such as rainfall and electrical storms affect the electrical signal as well.
The measured electrical intensity grows exponentially with the voltage. In fact, no electrical intensity that exceeds the threshold of 0.01 μA is gathered when voltage values are lower than 0.6 V. In general, higher electrical signals were gathered during the rainy seasons with moderate temperatures; while very low signals, including few measures of zero intensity, were obtained during the most stressful periods over the year, mainly by mid-summer.
There is a strong correlation between the rainfall and the electrical signal. The rain-intensity correlation, together with sustained intensity values during the reproductive period in spring, suggests that this electrical magnitude could be an indicator of the physiological state of the tree and thus used for in situ and minimally invasive forest monitoring.
1 Introduction
The Mediterranean climate has never been benign for most tree species due to its long drought periods, torrential rains and extreme temperatures in summer,Citation1 which facilitate bushfire ignition.Citation2 However, many plants have adapted to these conditions and supported the establishment of ecosystems with a great biodiversity.Citation3
In the current framework of climate change, Mediterranean climate areas are vulnerable to a decrease in precipitation, a plausible scenario over the next few decades, as the atmospheric circulation models predict.Citation4 This is a global challenge because these regions (Australia, Southern Africa, Chile, California and the Mediterranean basin) are present in every continent and they are densely populated.
According to Gracia,Citation4 a rainfall reduction of 10% is expected in the Iberian Peninsula over the upcoming 50 years, as well as a decrease of 25% of soil’s water content. Reduction in the soil’s water reserve is a consequence of the increase in the rate of trees’ transpiration during the vegetative period and the greater evaporative demand of the atmosphere.Citation4 The phytosanitary status of trees in Mediterranean climate zones is associated both with the characteristic climate fluctuations and with other ecological processesCitation5 such as outbreaks of fire.Citation6 In a climate change context, bushfire recurrence is enhanced in terms of intensity and frequencyCitation5 by the temporary weakness of many trees.Citation7 Therefore, the early detection of weakened trees that do not display visible symptoms of disease yet, could represent a significant advancement in the planning of forest health management.Citation5
Remarkably, the existence of a continuous electrical potential between the electrodes inserted in the tree’s phloem and the surrounding soil was discovered.Citation8 Additionally, it was recently documented that different environmental stimuli also produce electrical signal changes.Citation9 Further, according to some authorsCitation10–15 the variation of electrical signals in response to the stimulus depends on the intensity of the stimulation.
This behavior has been studied by other authors in research laboratories under controlled conditions.Citation13–16 This characteristic of the electrical signals could be used as an element for monitoring the state of the trees inside their ecosystem under natural conditions. Despite the different investigations carried out, it still remains unclear which environmental factors have the greatest influence on the tree’s electrical signals. Few published works have studied the electrical signals of trees in controlled conditions and only for continental and Central European climatic areas, e.g., Aesculus hippocastanumCitation17 and Populus nigraCitation12 both in France, Salix alba in Austria,Citation18 Quercus spp. and Fagus sylvatica.Citation19,Citation20 Thus, to the best of our knowledge, any prior research which has addressed this topic under field conditions neither studied the electrical response of trees located in highly vulnerable ecosystems to climate change such as Mediterranean forests.
FrittsCitation21 affirms that trees growing in extreme conditions, such as Mediterranean ecosystems, respond more clearly to climatic variations. Consequently, the Aleppo pine (Pinus halepensis Mill.) is an interesting species for monitoring environmental changes because it is very well adapted to drought and its growth is highly related to the water supply.Citation22 In addition, Pinus halepensis is a pioneer species that is expanding strongly on the two banks of the Mediterranean basinCitation23 due to its high potential for natural regeneration after bushfires and also due to its ability to rapidly colonize abandoned agricultural lands.Citation24
In summary, the current and voltage values rely on the tree’s physiological stateCitation25–30 and thus, both electrical signal components could be robust indicators of the forest health under different environmental conditions and consequent vulnerabilities: growth potential, hydric stress, bushfire risk and pests, among others.
In a previous study, we analyzed the most significant static factors influencing Pinus halepensis populations,Citation31 i.e. experiments carried out for a short period of time at stable climatic conditions. We observed that the tree age significantly influences the measured electrical potential, obtaining higher values in young trees. Furthermore, we conclude that the amplitude of the electrical signals does not depend on the location of the electrode. Both components of the electrical signal (the potential difference and the ISC) are constant, regardless of the orientation and height at which the measurement electrode is inserted into the tree.
Based on this acquired knowledge, the aim of this research is to analyze the temporal evolution of the electrical signal of a representative group of Pinus halepensis in Mediterranean forest. Indeed, this is the first study researching the electrical behavior of a representative sample of trees in natural conditions and it is also pioneering in measuring the electric intensity generated by a tree. The chosen pine is a paradigmatic Mediterranean species that quickly responds to climatic variations, and hence, it is a representative object of research. Regarding the experimental planning, the electrical measurements with a higher sample frequency were carried out for a period of several days, while the long-term trials were performed for a campaign lasting more than one year. In summary, the main objective of this work is to detect and analyze the seasonal but also day-night variations of electrical signals of Pinus halepensis in a Mediterranean ecosystem.
2 Material and methods
Both components of the electrical signal, voltage and current,Citation32 were measured in two different data acquisition experiments, one for short, the other for long periods. In the first trial, data were recorded with a weekly resolution to assess the electrical signal evolution throughout the annual vegetative cycle. In the other experimental set-up, signal values were obtained each minute over several consecutive full days. In this way, we can observe the short-term changes in voltage and current along the day-night cycles in different stages of the pine vegetative cycle.
2.1 Selection of representative species and forest
As in our previous work,Citation31 Pinus halepensis is the selected arboreal species on which the measurement of the electrical signals has been carried out because it is a representative coniferous, native to the Mediterranean region and present in almost all regions of both banks of the Mediterranean basin.Citation33–39 Moreover, Pinus halepensis presents clear relationships between growth and climatic variables. Thus, it is a reliable species for dendroclimatological studies.Citation22 Different studies for the Iberian PeninsulaCitation40,Citation41 suggest that the growth series reflect a strong influence of climatic factors, with a higher sensitivity than that observed in other Pinus species such as Pinus sylvestris, Pinus nigra, Pinus pinaster and Pinus mugo. Thus, understanding the impact of different environmental factors on the electrical response of this species may be of interest to the scientific community.Citation22
In our previous work, it was found that the amplitude of the signal is significantly greater in younger trees than in mature ones.Citation31 For this reason and to facilitate the measurement of the electrical signal, it was decided to look for a forest that had enough young trees within an area not affected by significant environmental disturbances such as recent bushfires, pests or damage due to heavy snowfall. Therefore, we decided to use a natural regenerated forest located within the protected area of the Sierra Calderona Natural Park in the Region of Valencia, Spain. The selected sample stand has an approximate size of 0.25 hectares and is located at latitude 39° 45ʹ 28.80” N and longitude 0° 30ʹ 36.36” W. The age of the trees is in average 27 years. The mean breast height diameter is 12.10 cm and the mean height 5.16 m. The stock density is 484 trees/ha.
2.2 Electrodes
Two model electrodes were used according to their function, a stainless steel for the tree and a platinum-iridium for the ground.Citation12,Citation16,Citation31,Citation42,Citation43 We inserted the stainless-steel electrode directly at 1.5 m above the ground into the trunk to be in contact with the phloematic tissue. We chose stainless steel screws as electrodes because they can be easily inserted and removed from trees, causing only a minor wound. Additionally, the screws have a greater contact surface with respect to the smooth electrodes due to their thread. The contact with the phloematic tissue was ensured by inserting the electrodes with a torque wrench that allowed us to detect the change in hardness of the tissue and to cross the phloematic tissue. The latter action is fundamental since electrical signals are transmitted more easily along this tissue, given its lower resistance to electrical flow, compared to other plant tissues.Citation9
The second type of electrode was a non-polarization titanium-nitride-coated platinum-iridium alloy electrode (1999/5/EC)Citation44 and was used as ground reference. Due to the hardness of the soil, this electrode was buried 15 cm in the mineral soil, discarding the centimeters of topsoil, at a minimum distance of 3 m from the tree.
Both electrodes were connected with the measuring equipment through an electrical connector and a 0.5 mm copper conductor cable insulated with a flexible plastic coating (CE 0123).
2.3 Measures for the long-term evolution
The long-term experimental design was based on the knowledge acquired for individual hardwoodsCitation10,Citation12,Citation19 and on our previous experience with Pinus halepensis.Citation31 This trial aims to observe the electrical signal evolution within the group of selected pines throughout their annual vegetative cycle.
2.3.1 Procedure
Voltage (V) and short-circuit current (ISC) data were collected at the same solar time once every Monday for 16 months, between May 28th 2018 and September 30th 2019, comprising more than a complete vegetative cycle. Four values (one for each cardinal point) of each component of the electrical signal and for each of the 15 representative specimens of the study population were recorded, i.e., 60 measurements every week.
2.3.2 Measurement equipment and external data sources
Voltage and current values were measured with a UT71D UNI-T multimeter with an input impedance of 2.5 GΩ and an accuracy of 0.1% ± 2 millivolts (mV).
Meteorological data of the area were provided by a professional weather station installed in 39° 46ʹ 10.12” N, 00° 31ʹ 14.19” W, located very close to the research plot. The weather station is a Davis Vantage VUE model owned by the Valencian Association of Meteorology ‘Josep Peinado’ (AVAMET).Citation45 The meteorological variables to be correlated with the electrical signal components are the temperature, relative air humidity, atmospheric pressure, wind speed and precipitation. For simplicity, the daily mean of the collection day was used. For the rainfall amount, the accumulated weekly precipitation was assumed.
2.3.3 Trees selection
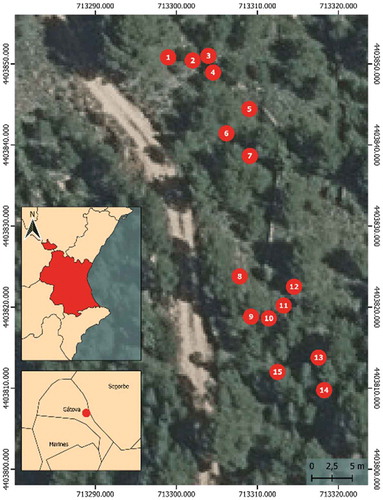
15 trees of a forest population of Pinus halepensis were selected following the method described by Hapla and Saborowski for sampling representative trees in a forest stand.Citation46 In this way, the tree selection can be considered as a representative sample of the surrounding forest. This methodology has been verified in different studies related to the characteristics of trees and the physical properties of wood.Citation47–53 shows the spatial distribution of the trees in the plot.
Figure 1. Distribution of the selected trees in the research plot
2.3.4 Statistical analysis
The Spearman correlation coefficient was used to link the voltage and intensity data with the meteorological variables. The use of Spearman correlation was based on other worksCitation54,Citation55 affirming that this coefficient is less sensitive than other statistics to outliers.
2.4 Measures for short-term evolution
This experiment monitors the influence of the day-night cycles on the electrical signal in a single tree as described in.Citation19,Citation42,Citation56,Citation57 Voltage and current measurements were prolonged for several days in a row, and the recording sessions took place in different seasons to observe electrical variations throughout the year.
2.4.1 Procedure
The electrical potential difference was registered every second, while the intensity was measured during ten seconds every two minutes to allow the electrical signal to recover. shows the dates on which the 24-hour measurement sessions were carried out.
Table 1. Short-term experiment calendar
The experiments carried out during 2019 only included voltage measures, while intensity and voltage were both measured from 2020 onwards (see ).
2.4.2 Measurement equipment and external data sources
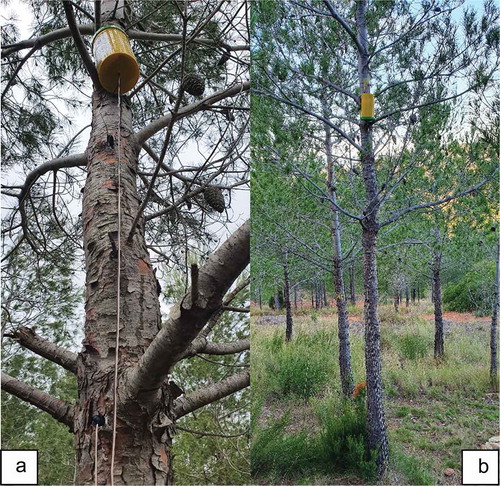
shows the position of the equipment for data measurement on the selected tree. In this figure you can also see the installation in height on the trunk to protect the action of the fauna the watertight capsule that, in turn, protects the electronic components of measurement from meteorological factors.
Figure 2. Short-term data-acquisition emplacement in a selected tree. Close vision of the watertight capsule (a). Overview of the installation (b)
For the short-term data-acquisition campaign, a prototype was developed that uses a Mooshim Mooshimeter BLE-DMM-2X-01 device with an accuracy of 0.5% for any voltage measurement. The intensity magnitude was gathered by measuring the voltage drop across a shunt.
The intensity of the electrical signal dropped to values close to zero if the measurement device was maintained connected through the shunt, as our prior experience indicates (see ). To avoid the plant stress emerging from the shunt experiment, the prototype had a relay controlled with an automatic programmable system (PycomFootnote1). In this way, the circuit could periodically be interrupted, making current measurements through the shunt punctually and not continuously.
Figure 3. Circuit diagram of measurement through the shunt
Sunrise and sunset hours were consulted in the Spanish National Astronomical Observatory.Citation58
2.4.3 Tree selection
For the 24-hour monitoring, it was necessary to work on a single tree due to equipment availability limitations. The selected tree (number 11) for the continuous evaluation displayed a yearly average voltage that was the closest to the group’s mean among all specimens of the long-term data collection.
3 Results
3.1 Long-term evolution
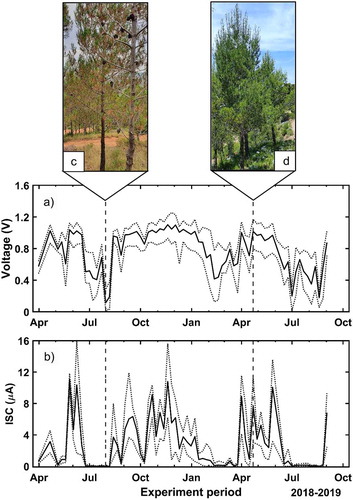
The first obtained results are the voltage and intensity signals for the long-term experiment. shows the mean, maximum and minimum values for the population sampled during the 16-month campaign. The maximum recorded value is 1.10 V for the voltage ()) and 11.05 µA for the current ()), while the minimum magnitudes correspond to 0.11 V and 0.00 µA, respectively. It can be observed that the voltage values are maintained within a narrower range with respect to the electrical current. This means that there are smaller variations among the specimens for the voltage than for the current. The highest values were measured in October and November 2018 and April and May 2019, corresponding to autumn and spring seasons. Conversely, the minimum values were recorded in February, March 2018, July and August of both years. So, during winter and summer, minimal values are registered, especially for the summer months. The vertical dashed lines represent the dates on which the tree pictures were taken ()). One photo was taken at the end of July, which corresponds to the period with the highest hydric stress for the tree. The second picture corresponds to the end of April, which is the beginning of the growth period, that is, when temperatures are not too high, and there is enough water availability due to intense rainfalls in the spring.
Figure 4. Temporal evolution of the voltage (a) and the ISC (b) during the long-term experiment given as the principal value of all trees. Maximum and minimum values are also depicted (dotted). Dashed vertical lines represent the dates when the tree pictures (C/D) were measured
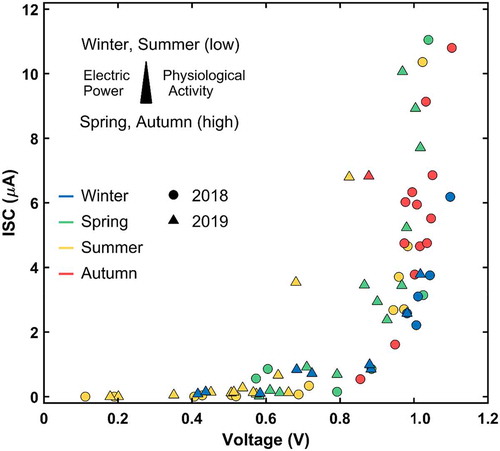
shows the mean voltage and intensity values of all trees along with the long-term experiment. Here, we can observe that there is a characteristic relationship between both magnitudes. Remarkably, voltages below 0.6 V do not allow any measurable ISC values. These records are only gathered during summer seasons and in the coldest months of the year. Alternatively, high voltage and ISC figures are gathered during both rainy seasons under moderate temperatures. The relationship between both electrical components follows an exponential behavior. In fact, voltage increases above 1.0 V promote considerable ISC rises, Which represents a consistently recurring phenomenon throughout the study period.
Figure 5. Relationship between the mean voltage and ISC of all trees for the long-term campaign
3.2 Relationship between the electrical signal and the atmospheric variables
shows the main results obtained from Spearman’s correlation analysis. Based on its outcome, it can be stated that there is a strong positive correlation between the voltage and the ISC values, as previously described. This correlation reaches a Spearman -value of 0.838 with p < .05. Nevertheless, there is no correlation between the voltage, nor the ISC, and the atmospheric pressure. In relation to the wind speed and the relative humidity, there is neither a significant correlation of these variables with the voltage variable since the calculated p-values are 0.372 and 0.082, respectively. Analogously, the effect of the wind on the ISC (negative effect) is statistically significant. However, this is not the case for the ISC and the air humidity. Moreover, the relationship with the daily temperature was shown to be significant only with respect to the voltage, being such an influence negative with = −0.402. In contrast, there was no correlation with statistical significance for the ISC magnitude, being the associated p = .083.
Figure 6. Result of Spearman’s correlation. Values within a colored box correspond to a statistically significant correlation different from 0 with the alpha significance level equal to 0.05
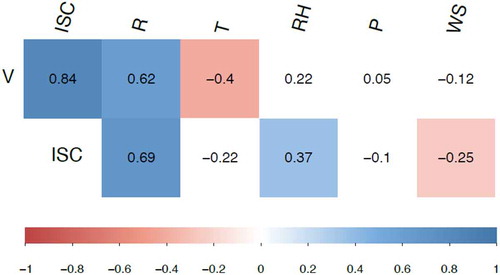
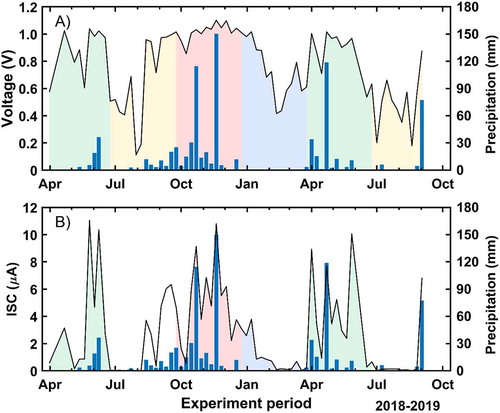
The precipitation amount is the atmospheric variable showing the highest correlation according to the Spearman methodology. There is a statistically significant correlation for both, the voltage and the ISC, with a p < .05 and reaching a value of 0.652 for the voltage and 0.709 for the ISC. Since rainfall is the most influential variable on the tree’s electrical signals, we will now plot the weekly accumulated precipitation on the voltage and ISC evolution as depicted in . It can be observed that while the voltage seems to be less dependent on the precipitation, this is not the case for the ISC values. Thus, this magnitude is correlated with the rain intensity. Indeed, ISC increases are measured when it had rained the week before. To some extent, the intensity rise seems to be proportional to the rainfall amount for summer and autumn, whereas there is no recorded rain in winter during our experiment period. However, the trees in spring seem to strongly react to the rain regardless of its intensity.
Figure 7. Temporal evolution of the voltage (a) and the ISC (b) during the long-term experiment given as the mean value of all trees. The rainfall amount is also displayed. Background colors represent the corresponding astronomical season
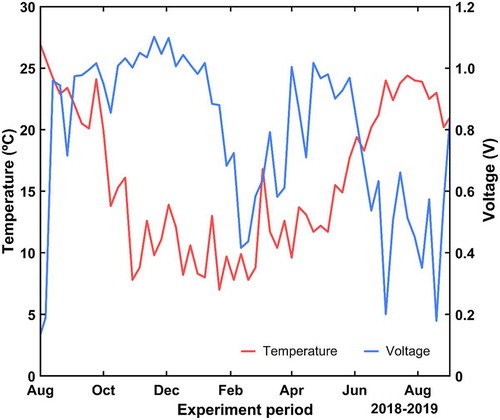
shows the evolution of the temperature and the voltage. It can be seen that there is a negative correlation between those magnitudes from July to October, whose valuetshow is −0.687, and a positive one who accounts for 0.262 during the first semester of the year.
Figure 8. Temporal evolution of the temperature and the mean voltage of all trees during the long-term experiment
3.3 Short-term evolution
Four 24-hour experiments were carried out during several days at different seasons to observe the trees’ electrical response to the day-night cycles. The graph for each voltage experiment is displayed in . Similarly, the concurrent ISC trials (only two experiments in this case) are shown in .
Figure 9. Voltage evolution for different short-term experiments. Events related with voltage changes are indicated with arrows. A) from 26th April to 1st May 2019. B) from 29th June to 4th July 2019. C) from 15th to 20th June 2020. D) from 6th to 12th March 2021
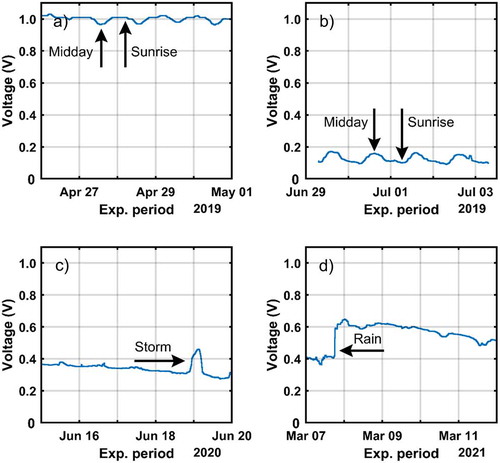
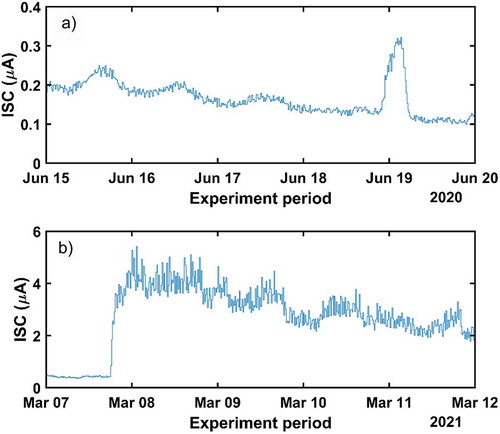
Figure 10. ISC evolution during two different short-term experiments. ISC evolution (a) and (b) correspond to the experiment shown in (c) and (d) of , respectively
The first trial was performed from 26th April to 01st May 2019. That is, during the most important growing period of the trees due to their vegetative activity [67]. The maximum temperature was 20.6°C and the experiment was carried out three days after the last precipitation (2.6 mm) and seven days since the last storm occurred (139.4 mm). ) shows the daily voltage variations, which account for 0.05 V. Moreover, the highest potential difference is gathered at night. Indeed, the largest difference is obtained at the local sunrise time. The electrical signal decrease gradually until reach a minimum voltage difference at the zenith. From this moment on, the registered potential difference begins to increase until the sunset.
The next test was carried out from 29th June to 4th July 2019 ()). The trees in this period are in one of the most stressful phases of the year due to the high temperatures and scarce water availability. Measurements were taken 37 days after the last recorded storm, with a maximum temperature measured by the meteorological station of 36.9°C. Under these conditions of water stress, the signals continue to show daily oscillations of 0.05 V and an inversion of the periods of maximum and minimum voltage compared to the spring period. There is a steep voltage reduction for the period between 9:30 p.m. and 10:00 a.m. of the next day. Later, there is a relatively moderate voltage increase between 10:00 a.m. and 2:00 p.m. Then, a stability period is reached until approximately 8:30 p.m. to end up with a marked decrease until approximately 9:30 p.m., when the cycle begins again.
Other measurement series were made during the period between the 15th and the 20th of June 2020 ()). With an elapsed period of five days since the last period of rainfall, when 10.6 mm were collected in three days of rain. In this period, the weather station recorded a maximum temperatures of 26.6°C. The graph shows no apparent variations between night and day hours. On June 19th, we observe a marked electrical anomaly of more than 1 V that coincides in date and time with an electrical storm with hardly any measurable rain (0.6 mm) over the tree area. The sudden increase of voltage disappeared few hours after the storm had vanished. ) also outlines a clear downward trend in the voltage values along the studied period.
Furthermore, between the 6th and the 12th of March 2021, the maximum recorded temperature was 22.1°C, while the minimum accounted for 2°C. During this measurement period, an overall rainfall of 21.4 mm was recorded on the 7th and the 8th of March, in this case without any atmospheric electrical activity. This rain event coincides with a sudden increase in the registered electric signal amplitude as shown in ). Unlike the transitory voltage behavior displayed in ), the electrical signal does not return to the previous level it held before the precipitation occurred (0.4 V). On the contrary, after the rain episode, a voltage magnitude of 0.6 V is maintained for almost two days. Then, it slowly decreases up to values close to 0.5 V.
During the last two voltage experiments, ISC measurements were also gathered. The related results are displayed in . The experiment carried out in June 2020 ()) shows the trend of the ISC along the studied period. It can be seen that its evolution resembles the voltage progress, including the electric anomaly derived from the storm. Unlike the voltage trend, the ISC shows clear maximum and minimum values, corresponding to midday and some hours after midnight, respectively. In this case, a voltage level of 0.4 V is enough to sustain some current. However, its magnitude is close to zero. Similarly, the ISC measurements gathered during the second week of March 2021 ()) display the same voltage trend of that week: after the rain event, the ISC and the voltage remain much higher than before the rainfall. In particular, the initial current level of 0.4 µA is multiplied by a factor of 10 after the rain and slowly decrease at a rate of 1 µA each two days approximately. In this case, no clear local extrema are distinguishable during this week. This means that the surplus of electricity derived from the intense rain masks the daily electrical oscillations.
4 Discussion
4.1 Long-term evolution
The long-term evolution of the voltage and the ISC in the trees is strongly affected by the seasonal characteristics of the Mediterranean climate: low and occasionally zero electrical signals are collected during dry periods, that is, in winter and especially in the middle of summer as shown in . In this sense, the hydric stress suffered by the trees during these periods leads to yellow coloration and a lower needle density.Citation59 This contrasts sharply with the intense green color and the higher needle density displayed by the pines in autumn and spring, as shown in ) when both electrical components are at their maximum values. Prior literature also reports seasonal variations of the voltage in trees under controlled conditions over long periods.Citation12,Citation19,Citation56 However, extreme values might be obtained in different periods according to the climatic characteristics of each location and consequently to the adaptation of each tree species to the environmental conditions of its habitat.
In this research, voltages below 0.6 V do not support any measurable ISC values. These records are normally gathered during the summer season and in the coldest months of the year. Thus, we expect the tree to stay in a dormant state when such magnitudes are measured. In addition, the rainfall seems to be strongly correlated with the ISC magnitude throughout the year, with the only exception of the spring months. During this period, sustained ISC values are measured regardless of the precipitations. Certainly, it is known that Pinus halepensis presents marked seasonally growth periodsCitation60 due to the climatic pattern along the year, concentrating its main physiological activity in spring when water availability is high and temperatures are in the optimal range. Alternatively, Pinus halepensis stops growing during the summer and winter. Moreover, it is known that the lack of water leads to the interruption of plant growth in many species, including this Mediterranean pine.Citation59 We similarly demonstrate that the electrical signal, especially the intensity, shows a reduction in the periods when the water availability is scarce. Hence, we expect the ISC magnitude to be a good indicator of the physiological state of the tree and that values below the given voltage threshold correspond to null net photosynthetic activity. Moreover, Gil et al.Citation14 found that the voltage values gathered in avocado trees under controlled conditions were dependent on changes in the soil water content.
In addition, some authors have identified a seasonally differentiated effect of the temperature on the radial growth of Pinus halepensis.Citation60 They reported a negative relationship in the months of July to October and a positive one during the first semester of the year. We have also detected such a bimodal trend in our results: during the first half of the year, there is a positive correlation between the temperature and the voltage, while it is negative in the second half. Hence, considering the growth-temperature dependence described in,Citation60 it might be possible to establish a correlation between the pine growth and the voltage.
Another outcome of this research is the analysis of the electrical signal of individual trees. The individual measurements confirm that all trees experience similar trends regarding their electrical output. However, there is some signal variability, especially in the intensity magnitude ()) and to a lesser extent in the voltage ()), despite being all specimens coeval and located in a plot with similar soil characteristics. Similarly, minor differences could also be appreciated among the trees regarding their external aspects and the harsh periods regarding extreme climatic conditions. The dissimilarities among the specimens could be a consequence of the micro-geology around each tree. Indeed, minor local differences in the soil and subsoil properties can also affect the tree response.Citation61 Furthermore, other authors mention that the influence of micrositesCitation62 and the morphological attributes of each treeCitation63 can confer unique characteristics to each specimen and thus, a partially different electrical response might emerge in each tree.
4.2 Short-term evolution
The appearance of daily cyclical variations of the electrical response coincides with the experiences reported by other authors.Citation42,Citation56 ) displays voltage oscillations, whose mean value is close to 1 V. The signal range, i.e., the maximum and minimum value difference is around 30 mV. This figure is very close to that published by Koppán,Citation56 who measured daily voltage variations in Quercus cerris during the same week of the year and also reported maximum values at night and minimal during midday. Alternatively, daily variations during summer display an inversion ()) with respect to the time of local extreme appearance in spring ()): minimal voltage values are gathered at night and the highest measurements are obtained during the day in the hot period.
During two of our short-term trials, two electrical anomalies originated by an electrical storm and a punctual rain were registered. In the first case, a sudden and transient increase in the voltage and the ISC was detected () and )). On the contrary, in the second case a signal enlargement was recorded that lasted longer than the atmospheric instability () and )), probably due to a higher water availability in the soil. Hence, atmospheric events can also alter both electrical magnitudes and have to be taken into account when analyzing short-term characteristics of the electrical signals in Mediterranean pines. Moreover, the ISC measurements describe the same behavior as in the voltage case after the appearance of the mentioned electrical phenomena, as displayed in ) and ). Similar electrical alterations were observed in,Citation56 since the voltage maxima in Fagus sylvatica are enhanced when atmospheric electricity is present. Moreover, precipitation was found to impact the electrical outcome for several days as it occurs in our research.
Additionally, some authors have observed the reversal of the current flow in the trees due to the presence of positively charged atmospheric islands.Citation57 Nevertheless, we could not recognize such a phenomenon in our measurements.
In summary, we have identified the existence of seasonal and daily patterns of both electrical-signal components of Pinus halepensis in natural ecosystems. In addition, we have also found a clear correlation between the fallen precipitation on the area and the variations in the electrical signal of the trees, especially with respect to the electrical intensity. Remarkably, we found a minimum voltage of 0.6 V that is necessary to measure intensity flows in our circuit. Since lower voltage values are only measured during the most demanding periods of the year, that is, when the pines have a very low photosynthetic activity, we think that the ISC could be a good estimator of the physiological activity. Moreover, soil humidity is the most limiting factor for pine growth in the Mediterranean ecosystem and periods without rain are clearly correlated with low voltages and zero ISC measurements. So, the measured electrical components seem to be potential estimators of the tree health and activity, e.g. monitoring moisture content and consequently, bushfire or pest risk.
Further work is necessary to predict the contribution of each atmospheric and environmental factor to the electrical signal. Indeed, a complete understanding of the electrophysiological behavior of Pinus halepensis is critical for future applications such as bushfire risk or pest monitoring and detection. Hence, the electrical signals generated by the trees could be used as indicators of the tree physiological state and thus, leveraged for in situ and permanent monitoring of Mediterranean forests in the actual scenario of climate change.
Geolocation information
Datum: ETRS89N
Latitude: 39º 45 28.80” N
Longitude: 0º 30 36.36” W
UTM zone: 30
Coord. X: 713.297,97
Coord. Y: 4.403.863,10
Disclosure statement
No potential conflict of interest was reported by the author(s).
Notes
References
- Gimeno TE, Pías B, Lemos-Filho JP, Valladares F. Plasticity and stress tolerance override local adaptation in the responses of Mediterranean holm oak seedlings to drought and cold. Tree Physiol. 2009;29:1–13.
- Pausas JG, Vallejo VR. The role of fire in European Mediterranean ecosystems. In: Chuvieco E ,editor, Remote Sensing of Large Wildfires in the European Mediterranean Basin. Berlin: Springer; 1999. p. 3–16.
- Syphard AD, Radeloff VC, Hawbaker TJ, Stewart SI. Conservation threats due to human‐caused increases in fire frequency in Mediterranean‐climate ecosystems. Conserv Biolo. 2009;23:758–769.
- Gracia CA, Sabaté SY, Sánchez A. 2002. El cambio climático y la reducción de la reserva de agua en el bosque mediterráneo. Ecosistemas 2002/2. http://www.aeet.org/ecosistemas/022/investigacion4.htm)
- Guillen-Climent ML, Mas H, Fernández-Landa A, Algeet-Abarquero N, Tomé JL. Using hipersepctral images for decay detection in Pinus halepensis (Mill.) in the Mediterranean forest. Revista de Teledetección. 2020;55:59–69. doi:10.4995/raet.2020.13289.
- De Dios VR, Fischer C, Colinas C. Climate change effects on Mediterranean forests and preventive measures. New For. 2007;33:29–40.
- Hódar JA, Zamora R, Cayuela L. Climate change and the incidence of a forest pest in Mediterranean ecosystems: can the North Atlantic Oscillation be used as a predictor? Clim Change. 2012;113:699–711.
- Love CJ, Zhang S, Mershin A. Source of sustained voltage difference between the xylem of a potted Ficus benjamina tree and its soil. PloS One. 2008;3:8.
- Oyarce P, Gurovich L. Electrical signals in avocado trees. Plant Signal Behav. 2010;5(1):34–41. doi:10.4161/psb.5.1.10157.
- Datta P, Palit P. Relationship between environmental factors and diurnal variation of bioelectric potentials of an intact jute plant. Curr Sci. 2004;87:680–683.
- Gora EM, Yanoviak SP. Electrical properties of temperate forest trees: a review and quantitative comparison with vines. Can J For Res. 2015;45(3):236–245. doi:10.1139/cjfr-2014-0380.
- Gibert D, Le Mouel JL, Lambs L, Nicollin F, Perrier F. Sap flow and daily electric potential variations in a tree trunk. Plant Sci. 2006;171(5):572–584. doi:10.1016/j.plantsci.2006.06.012.
- Gil PM, Gurovich L, Schaffer B. The electrical response of fruit trees to soil water availability and diurnal light-dark cycles. Plant Signal Behav. 2008;3(11):1026–1029. doi:10.4161/psb.6786.
- Gil PM, Gurovich L, Schaffer B, Garcia N, Iturriaga R. Electrical signaling, stomatal conductance, ABA and ethylene content in avocado trees in response to root hypoxia. Plant Signal Behav. 2009;4(2):100–108. doi:10.4161/psb.4.2.7872.
- Rios-Rojas L, Morales-Moraga D, Alcalde JA, Gurovich LA. Use of plant woody species electrical potential for irrigation scheduling. Plant Signal Behav. 2015;10(2):e976487. doi:10.4161/15592324.2014.976487.
- Volkov AG, Ranatunga DRA. Plants as environmental biosensors. Plant Signal Behav. 2006;1:105–115.
- Morat P, Le Mouel JL, Granier A Electrical potential on a tree. A measurement of the sap flow? Comptes rendus de l’Academie des sciences Serie 3, Sciences de la Vie. 1994; 317: 98–101.
- Gindl W, Loppert HG, Wimmer R. Relationship between streaming potential and sap velocity in Salix Alba L. PHYTON-HORN. 1999;39:217–224.
- Koppan A, Szarka L, Wesztergom V. Temporal variation of electrical signal recorded in a standing tree. Acta Geodaetica et Geophysica Hungarica. 1999;34:169–180.
- Koppan A (2004). Variations of the natural electric potential differences occurring on tree trunks and their relationship with the xylem sap flow. PhD Thesis. University of West Hungary. Sopron,Hungary.
- Lamb HH, Gray BM. Tree rings and climate. By H. C. Fritts. London, New York and San Francisco, Academic Press, 1976. Q J R Meteorol Soc. 1978;104:236–237. doi:10.1002/qj.49710443923.
- Olivar J, Bogino S, Spiecker H (2009, June). Influencia del clima en el crecimiento radial de Pinus halepensis de diferentes clases sociales e identificación de las variables climáticas más importantes. Congresos Forestales.
- Maestre FT, Cortina J, Bautista S, Bellot J. Does Pinus halepensis facilitate the establishment of shrubs in Mediterranean semi-arid afforestations? For Ecol Manage. 2003;176:147–160.
- Chomel M, Fernandez C, Bousquet‐Mélou A, Gers C, Monnier Y, Santonja M, … Baldy V. Secondary metabolites of P inus halepensis alter decomposer organisms and litter decomposition during afforestation of abandoned agricultural zones. J Ecol. 2014;102:411–424.
- Rathgeber CB, Cuny HE, Fonti P. Biological basis of tree-ring formation: a crash course. Front Plant Sci. 2016;7:734.
- Castagneri D, Fonti P, von Arx G, Carrer M. How does climate influence xylem morphogenesis over the growing season? Insights from long-term intra-ring anatomy in Picea abies. Ann Bot. 2017;119:1011–1020.
- Ekberg I, Eriksson G, Dormling I. Photoperiodic reactions in conifer species. Ecography. 1979;2:255–263.
- Mattsson A. Seasonal variation in root growth capacity during cultivation of container grown Pinus sylvestris seedlings. Scand J For Res. 1986;1:473–482.
- Rodríguez-Calcerrada J, Salomón R, Gil L. Transporte y reciclaje de CO2 en el interior del árbol: factores que complican la estimación de la respiración leñosa a través de la emisión radial de CO2. Bosque (Valdivia). 2015;36:5–14.
- Pfanz H, Aschan G, Langenfeld-Heyser R, Wittmann C, Loose M. Ecology and ecophysiology of tree stems: corticular and wood photosynthesis. Naturwissenschaften. 2002;89:147–162.
- Zapata R, Oliver-Villanueva JV, Lemus-Zúñiga LG, Luzuriaga JE, Mateo Pla MA, Urchueguía JF. Evaluation of electrical signals in pine trees in a mediterranean forest ecosystem. Plant Signal Behav. 2020;15(10). doi:10.1080/15592324.2020.1795580.
- The Editors of Encyclopaedia Britannica. Electric power. Encyclopædia Britannica. Encyclopædia Britannica, inc. Accessed August 31, 2020. https://www.britannica.com/technology/electric-power
- De Luis M, Čufar K, Di Filippo A, Novak K, Papadopoulos A, Piovesan G, Smith KT. Plasticity in dendroclimatic response across the distribution range of Aleppo pine (Pinus halepensis). PLoS One. 2013;8:12. doi:10.1371/journal.pone.0083550.
- AAVV. (2008). Distribution map of aleppo pine. EUFORGEN 2009, [Accessed 2020 July 16]. www.euforgen.org
- Fadi B, Semerci H, Vendramin GG 2003. EUROFORGEN technical guidelines for genetic conservation and use for aleppo pine (Pinus halepensis) and brutia pine (Pinus brutia). IPGRI, International plant genetic resources institute. Rome (Italy). 6. ISBN 92-9043-571-2.
- Mauri A, Di Leo M, de Rigo D, Caudullo G. Pinus halepensis and Pinus brutia in Europe: distribution, habitat, usage and threats. In: San-Miguel-Ayanz J, de Rigo D, Caudullo G, Houston Durrant T, Mauri A, editors. European Atlas of Forest Tree Species. Luxembourg:Publ. Off. EU; 2016. p. e0166b8+.
- Pausas JG, Ribeiro E, Vallejo R. Post-fire regeneration variability of Pinus halepensis in the eastern Iberian Peninsula. For Ecol Manage. 2004;203(1–3):251–259. doi:10.1016/J.FORECO.2004.07.061.
- IFN3. Tercer inventario forestal nacional (3rd national forest inventory of Spain). Ministerio para la Transformacion Ecologica y el Reto Demografico; Spain, 2007. [Retrieved 2002 July 16] https://www.miteco.gob.es/es/biodiversidad/servicios/banco-datosnaturaleza/informacion-disponible/ifn3.aspx
- Valbuena P, Bravo F. Stand density Management diagrams for two mediterranean pine species in Eastern Spain. For Syst. 2008;17:97–104.
- Richter K, Eckstein D, Holmes RL (1991). The dendrochronological signal of pine trees (Pinus spp.) in Spain.
- Bogino SM, Bravo F. Growth response of Pinus pinaster Ait. to climatic variables in central Spanish forests. Ann For Sci. 2008;65:506.
- Cardoso SS, Carrondo LB, Marques JM, Narciso PN, Rocha MJ, Rodrigues IN, Soares A (2004). Monitorization of the electrical signal generated by a tree. February 2004 – 4th luso-spanish assembly on geodesy and geophysics.
- Hao Z, Li W, Hao X. Variations of electric potential in the xylem of tree trunks associated with water content rhythms. J Exp Bot. 2021;72:1321–1335.
- Directive 1999/5/Ec Of The European Parliament and of the council of 9 march 1999.
- Asociación Valenciana de Meteorología ‘Josep Peinado’ (AVAMET). Accessed December 15, 2020. https://www.avamet.org/mx-mxo.php?id=c11m902e01
- Hapla F, Saborowski J. Planning of sample size for wood anatomical investigations. Holz als Roh-und Werkstoff. 1987;45:141–144.
- Oliver-Villanueva JV, Becker G. Verwendungsrelevante Holzeigenschaften der Esche (Fraxinus excelsior L.) und ihre Variabilitat im Hinblick auf Alter und Standraum. Forst und Holz. 1993;48:387–391.
- Hapla F, Oliver-Villanueva JV, Gonzalez-Molina JM. Effect of silvicultural management on wood quality and timber utilisation of Cedrus atlantica in the European Mediterranean area. Holz als Roh-und Werkstoff. 2000;58(1–2):1–8. doi:10.1007/s001070050377.
- Seeling U, Sachsse H (1991). Abnorme Kernbildung bei Rotbuche und ihr Einfluß auf holzbiologische und holztechnologische Kenngrößen [Abnormal heartwood formation in beech and its influence on the biological and technological features of the wood] (Doctoral dissertation, Doctoral thesis, 2nd).
- Sauter U Technologische Holzeigenschaften der Douglasie (Pseudotsuga menziesii (Mirb.) Franco) als Auspragung unterschiedlicher Wachstumsbedingungen. Freiburg i. Breisgau, Germany, 1992.
- Dix B, Roffael E, Becker G, Gruss K. Properties of pulps prepared from poplar wood of different clones, sites and ages. Papier. 1992;46:583–592.
- Wobst J (1995). Auswirkungen von Standortwahl und Durchforstungsstrategie auf verwertungsrelvante Holzeigenschaften der Douglasie (Pseudotsuga menziesii (Mirb. (Franco)) (Doctoral dissertation). University of Gottingen.
- Peters S (1996). Untersuchungen über die Holzeigenschaften der Stieleiche (Quercus robur L.) und ihre Beeinflussung durch die Bestandesdichte. Papierflieger, UNIVERSITY OF GOTTINGEN.
- Restrepo LF, González J. From pearson to Spearman. Revista Colombiana de Ciencias Pecuarias. 2007;20:183–192.
- Faraway JJ. Extending the linear model with R: generalized linear, mixed effects and nonparametric regression models. Boca Raton, FL: CRC press; 2016. ISBN-13: 978-0-203-49228-4.
- Koppán A, Szarka L, Wesztergom V. Annual fluctuation in amplitudes of daily variations of electrical signals measured in the trunk of a standing tree. Comptes Rendus de l’Académie des Sciences-Series III-Sciences de La Vie 323.6 (2000): 559–563.
- Le Mouël JL, Gibert D, Poirier JP. On transient electric potential variations in a standing tree and atmospheric electricity. C R Geosci. 2010;342:95–99.
- Observatorio Astronómico Nacional, Instituto Geográfico Nacional, Ministerio de Fomento, España. Accessed December 15, 2020. https://astronomia.ign.es/web/guest/hora-salidas-y-puestas-de-sol
- Belda-Palazón B, Adamo M, Valerio C, Ferreira LJ, Confraria A, Reis-Barata D,Rodrigues A, Meyer C, Rodriguez PL, Baena–González E. A dual function of SnRK2 kinases in the regulation of SnRK1 and plant growth. Nat Plants. 2020Nov; 6(11):1345-1353. doi: 10.1038/s41477-020-00778-w.1–9.
- Matamoros MR, Merino EG, Ibáñez NI, Bernal EM. Sensibilidad y grado de adaptación de “Pinus halepensis” mill. a la variabilidad climática en la provincia de Zaragoza. Cuadernos de la Sociedad Española de Ciencias Forestales. ISSN 1575-2410, Nº. 26, 2008. p. 137–142.
- Carriere SD, Ruffault J, Pimont F, Doussan C, Simioni G, Chalikakis K, … Davi H. Impact of local soil and subsoil conditions on inter-individual variations in tree responses to drought: insights from electrical resistivity tomography. Sci Total Environ. 2020;698:134247.
- Cailleret M, Nourtier M, Amm A, Durand-Gillmann M, Davi H. Drought-induced decline and mortality of silver fir differ among three sites in Southern France. Ann For Sci. 2014;71:643–657.
- Cailleret M, Jansen S, Robert EM, Desoto L, Aakala T, Antos JA, … Čada V. A synthesis of radial growth patterns preceding tree mortality. Glob Chang Biol. 2017;23:1675–1690.