
 ?Mathematical formulae have been encoded as MathML and are displayed in this HTML version using MathJax in order to improve their display. Uncheck the box to turn MathJax off. This feature requires Javascript. Click on a formula to zoom.
ABSTRACT
The changes in plant life behaviors and water status are accompanied by electrophysiological activities. In this study, the theoretical relationship between clamping force (CF) and leaf resistance (R), capacitive reactance (XC), inductive reactance (XL), impedance (Z), and capacitance (C) were exposed as 3-parameter exponential decay and linear models based on bioenergetics, respectively, for mangrove species. The intracellular water metabolism parameters and salt transport characteristics were also determined based on mechanical equations with influences of Sodium nitroprusside (SNP) and rewatering (RW). The results show that the inherent capacitance and effective thickness could better represent Aegiceras corniculatum (A. corniculatum) species, and inherent resistance and impedance show obvious effects on Kandelia obovate (K. obovate) species at different salt levels. SNP application shows positive effect on different salt-resistance capacities of A. corniculatum, while K. obovate perform better in RW phase at high salt level. These outcomes indicates that K. obovate is more salt-resistant because RW process is consistent with actual situation, and response of A. corniculatum at high salt stress is irreversible, even in RW. It is concluded that the electrophysiological parameters could be used for the determination of salt-resistant capacities, which gave more enhanced and reliable information of mangroves’ life activities.
1. Introduction
The life activities of plant involve salt tolerant capacity, water status, stress resistance, metabolism of substance and energy, growth, and other processes.Citation1,Citation2 Various changes in plant physiological processes such as photosynthesis, stomatal conductance, respiration, transpiration, substance flow, energy metabolism, and plant growth are directly or indirectly linked with electrical signal (variation, action, and system potential).Citation3 The relationship between electrical and physiological processes in plant can be analyzed by the simulation.Citation4 The membrane lipid is an important element of the cell membrane, and it could be acting as an insulating layer along with electrical resistance, which allows the plant cell to store the electric charge.Citation5 Moreover, through transpiration, approximately 95% of water in the plant leaves dissipate, and remaining 5% of water in the leaf cell are available to support their growth.Citation2 This 5% precious intracellular water is utilized for the metabolism, which performs an important role in the physiological processes.Citation6 Plant cells injured by abiotic or biotic stress at that time produce variations in structure and composition ion permeability, and consequential changes were observed in the electrical parameters.Citation7 These variations are considered as a quick response when plants are under stressful environment.Citation8 Hence, the electrical parameters can be clearly influenced by environmental changes and other aspects. Consequently, a method was developed on an urgent basis to monitor the electric parameters of mangrove species with high reproducibility.
Mangrove plays an important role in controlling the soil salinity in coastal areas; it decreases the sea intrusion and increases the irrigated land.Citation9 Mangrove forest provides a vast range of economic and ecological benefits.Citation10 Mangrove species are divided into two categories based on their special features, such as true mangrove and associate mangrove. Aegiceras corniculatum (A. corniculatum) is a salt-secretor mangrove, and Kandelia obovate (K. obovate) is a non-secretor mangrove, but both are the true mangrove species.Citation11 A. corniculatum has salt glands in their leaves and thus are considered as a salt-secretor mangrove; the salt glands are important strategy to sustain osmotic balance and increase salt-tolerance rate.Citation12 K. obovate has evolved many mechanisms to resist high salinity, and the most important feature is the maintenance of cell turgor by accumulating inorganic ions in the vacuole and organic compounds in the cytoplasm.Citation13 Generally, plant cell performs the important role and involves in different salt-tolerant mechanism, such as salt accumulation of plastoglobuli by K. obovate and secretion by A. corniculatum are important features in opposition to the salt stress.Citation14
How electrophysiological information reflect the mangrove plants in stress condition? Could electrophysiological parameters describe the inherent relationship between electrical parameters and stressful environment? The physiological capacitance and impedance are always used for the evaluation of water status and plant growth.Citation15 Ion groups of mesophyll cell are the electrolytes, which are strongly associated with the electrical processes. During the stress condition, salt enters the plant cell and vacuoles, and the vacuoles perform the main role of salt storage capacity. Additionally, the electrical parameters are connected with the plant cell and vacuole volume. Therefore, leaf capacitance (C) performs the main role during the determination of water status, and C is associated with the effective thickness and the area of the leaves in contact with the capacitor plates.Citation16 In the present study, C was measured with the help of clamping force (CF); in this method, the leaf was clipped between two electrodes of the parallel plate capacitor, and the detailed descriptions of parallel plate capacitor sensor are shown in . The inherent relationship between CF and R, XC, XL, Z, and C of mangrove species has not yet been revealed. Therefore, it is an effective approach to expose the inherent relationship between plant electrical parameters and CF to provide efficient technique for monitoring physiological condition of mangroves.
The metabolism water that is occupied in leaf cell impact the concentration of electrolytes (electric dipoles and ions groups) and, thus, attend the dynamic electrical activity. The leaf capacitance (C), resistance (R), and impedance (Z) related to intracellular water metabolism, electric dipoles, ions, and ion groups resulted in variations in the electrolyte concentration. The physical models and inherent mechanisms involved between CF and R, XC, XL, Z, and C values of mangrove leaves were revealed in this study. Furthermore, from the leaf C, XC values can be calculated. Subsequently, the inherent resistance (IR), capacitive reactance (IXC), inductive reactance (IXL), the intrinsic impedance (IZ), capacitance (IC), and specific effective thickness (ET) of the inherent electrical parameters in the plant leaves were successfully obtained using the respective mechanism equations. The intracellular water metabolism parameters such as water-holding capacity (IWHC), water-use efficiency (IWUE), and water-holding time (IWHT) were defined based on the inherent electrical parameter equations and reflect the intracellular water metabolism.
Moreover, the cell membrane performed a vital role to stabilize the environment inside the cell. The energy used by cells in salt transport is almost 60% of the total energy consumed by the cells.Citation7 The type of surface and binding ability of salt in cell membrane is most closely related with salt transport capacity; therefore, salt transport capacity of cells is reflected by the composition and content of the membrane protein. Therefore, in this study, salt transport capacity of mangrove leaves were investigated by their mechanism equations with the help of inherent electrical parameter. The salt flux per unit area (USF), salt transfer rate (STR), and salt transport capacity (STC) in plant leaves in the light of the inherent electrophysiological parameters were defined to assess the salt transport strategies. Moreover, salt uptake helps to maintain positive pressure potential through their contribution to osmotic adjustment of growing tissues.Citation17 However, under high salinity conditions, the survival of the plant depends on its ability to regulate the internal salt concentrations and prevent ions from reaching toxic levels.Citation18,Citation19
Generally, salt-resistant capacity of mangrove species depends on its cell volume, which is connected with salt outflow capacity, which is determined by inherent electrical parameters such as IR, IXC, IXL,and IZ. Furthermore, as we know that mangroves are considered salt-resistant species; therefore, in high salt level, mangroves upstand with their unique features. Salt dilution capacity (large capacity) of mangrove species can be determined by inherent electrical parameters such as CP, ET, IWHC, and STC. Moreover, mangroves develop different mechanism associated with anatomic and physiological characteristics to regulate salt absorption and exclusion, such as salt ultrafiltration and salt secretion. Salt ultrafiltration capacity is also an important factor, in which the mangroves filter the salt with their root and leave. Therefore, in this study, salt ultrafiltration capacity is also determined by the electrical parameters such as IWUE, IWHT, USF, and STR.
Furthermore, the high concentration of Na+ in the soil solution, beyond the normal condition, decreased the water potential at certain levels. Hence, the plant roots will not able to take up enough water for metabolism, and so the plant suffers physiological drought (Xing et al., 2019). Sodium nitroprusside (SNP) is a crucial signaling molecule that performs important role in various physiological processes, such as senescence and adaptive responses to water deficit and salinity stresses.Citation20,Citation21 Jian et al. (2016) suggested that the exogenous SNP could alleviate the damage caused by various abiotic stress. Various studies reported that the application of low concentration of SNP could improve the salinity-induced oxidative injury in the roots of cucumber,Citation22 seed of alfalfa,Citation23 and cotton seedling.Citation24 Furthermore, SNP could increase chlorophyll content and maintain the stability of photosynthetic complexes in thylakoid membranes, which was helpful to plants, especially under stress conditions.Citation25,Citation26 So, this study also evaluates the influence of SNP application on both mangrove species in different salt levels.
The rewatering (RW) technique could be a supportive technique, which helps to maintain plant growth by gradually decreasing salt concentration in saline water. In previous study, the rewatering technique usedCitation27 predict that the rewatering time point could be attained through online monitoring of electrophysiological parameters such as leaf tensity. But this study used the RW technique, which is considered as an intertidal condition for mangroves. Furthermore, the physiological parameters such as net photosynthesis rate (PN), leaf stomatal conductance (gs), leaf intercellular CO2 concentration (Ci), and transpiration rate (Tr,) were also investigated, which were considered as sensitive parameters in stress conditions. Photosynthetic parameters are continuously inhibited when the plant suffered high stressful environmental conditions.Citation28 Therefore, in this study, the photosynthetic parameters considered are used to verify the electrophysiological parameters because electrophysiological parameters can reflect the salt-resistant capacity and drought resistant even when the plant is in healthy condition.
It was noticed that there was not any available method to characterize the difference between different plant species based on salt outflow capacity (C1), salt dilution capacity (C2), and ultrafiltration capacity (C3), neither the common photosynthetic parameter. The electrophysiological parameters may have the potential to characterize the differential response of different plants with these three capacities. Thus, the purpose of this study was to explore the salt-resistant capacities of two mangroves species based on electrophysiological parameter with the help of RW and SNP application and evaluate the status of water metabolism with the help of IWUE and IWHT and also monitor the plant salt transport parameter (USF, STR, and STC) strategies by mechanism equations of both mangrove species in Ss and RW conditions. Furthermore, in this study, the photosynthesis parameters and water potential were also determined to verify the electrophysiological parameters. Moreover, based on the electrophysiological parameters, the C1, C2, and C3 capacities were also calculated because these capacities accurately address salt-resistant capacity of both mangrove species and different adaptive strategies under different salt levels.
2. Materials and method
2.1. Experimental design and salt treatments and rewatering
The experiment was performed in a greenhouse of Jiangsu University, Zhenjiang, Jiangsu, China, from 11 September to 11 November 2019. Two different mangrove species were collected from Quanzhou Tongqing mangroves technology Co. Ltd., Fujian, China. Initially, both the species were washed with tape water and then stored in 10 liter of half strength nutrient Hoagland solution.Citation29 The youngest leaves of fresh branches were selected as the experimental material taken from the fifth and fourth leaf positions of each branch. Moreover, a complete randomized block design was used with six different salt treatments, and each treatment contains four replicates. The mangrove species were kept for 30 days in salt-stress phase; after that, the same time span was used for the RW phase. In salt-stress phase, different NaCl treatments were used, i.e., T1: NaCl (100 mM) considered as (low NaCl); T2: SNP (0.01 mM) + NaCl (100 mM) (low NaCl + SNP); T3: NaCl (200 mM) (moderate NaCl); T4: SNP (0.01 mM) + NaCl (200 mM) (moderate NaCl +SNP); T5: NaCl (400 mM) (high NaCl); and T6: SNP (0.01 mM) + NaCl (400 mM) (high NaCl + SNP). Regarding RW, the phase order was as follows: T1: NaCl (100 mM) considered as (low NaCl); T2: SNP (0.01 mM) + NaCl (100 mM) (low NaCl + SNP); T3: NaCl (100 mM) (low NaCl); T4: SNP (0.01 mM) + NaCl (100 mM) low NaCl + SNP); T5: NaCl (200 mM) (moderate NaCl); and T6: SNP (0.01 mM) + NaCl (200 mM) (moderate NaCl +SNP), as shown in .
Figure 1. Experiment design shows two different phases (salt stress and rewatering). ΔC indicates the change in NaCl concentration from high to low.
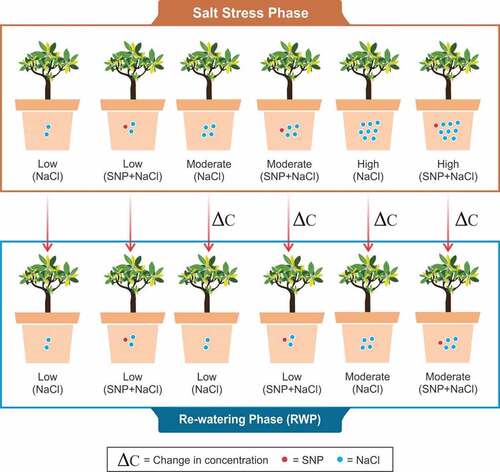
Figure 2. Simplified equivalent circuit of cells. Z = impedance, Cm = capacitance of membrane, Rm = resistance of membrane, XCm = capacitive reactance of membrane, XLm = inductive reactance of membrane, Ro = resistance outside membrane, and Ri = resistance inside membrane.
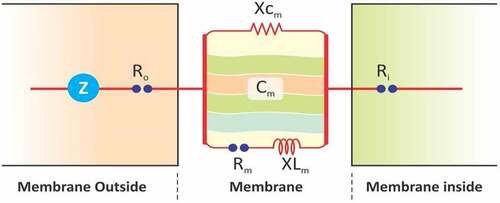
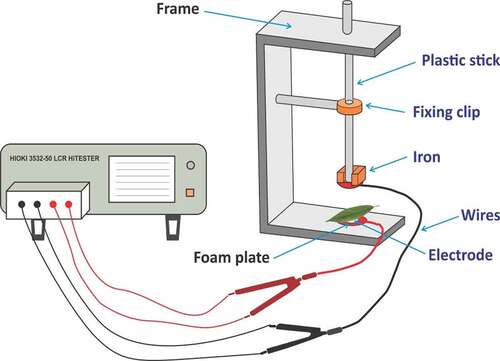
Figure 3. Representation of the parallel plate capacitor.
2.2. Inherent mechanism relationships of CF and leaf R, XC, and XL
Mesophyll cell is considered as a concentric sphere capacitor with both resistor and inductor functions.Citation2 The diagram of a simplified equivalent circuit of mesophyll cell is shown in .
The plasmodesmata is linked with mesophyll cells, so it generates low-resistance ways to pass by electrical current. Generally, mesophyll cells can be separated into unreliable spherical tissue cells and long cylindrical palisade tissue. To simplify and achieve this scientific issue, every mesophyll cell can be observed with a concentric sphere capacitor. Therefore, the leaf capacitor consisted of aligned mesophyll cell. The values of Z, R, and C are based on the electrolyte concentration in the leaf; therefore, the parallel connection mode of LCR was used. The water status of the leaf cells depends on the variation in the electrolyte concentration.Citation30 The above-mentioned parameters (Z, R, and C) were evaluated by LCR tester (3532–50, HIOKI, Japan), as shown in .
The voltage and frequency used were 1 V and 3 kHz, respectively. A leaf was placed between two parallel electrode plates, and a clamping force (CF) was applied. After that sigma plot (version 12.0) was used and applied to polynomial linear equation for curve fitting. Finally, one equation was obtained from each repeat, which is mentioned above in detail, and leaf Z, R, and C at different CF were measured continuously by adding the same quantity and quality of iron block. Finally, the values of leaf XC and XL are expressed as follows:
Where XC = capacitive reactance, π = 3.1416, f = frequency, C = physiological capacitance, XL = inductive reactance, Z = Impedance, and R = resistance.
The concentrations of the electrolytes are associate to Z outer and inner side of the cell membrane, which is defined by plant leaf Z. The outside stimulation changes in membrane permeability of electrolytes impact the outer and inner side of cell membrane. According to the bioenergetics, the potential of ion groups and electric dipoles inside and outside the cell membrane can be obtained by Nernst equation.Citation2 Thus, the Nernst equation can be obtained from Equationequation 3(3)
(3) as follows:
where E is the electromotive force (V), is the standard electromotive force (V),
is the gas constant (8.314570 J K−1 mol−1), T is the thermodynamic temperature (K),
is the concentration of electrolytes responding to Z inside the cell membrane (mol L−1),
is the concentration of electrolytes responding to Z outside the cell membrane (mol L−1), F0 is the Faraday constant (96,485 C mol−1), and
is the number of transferred electrolytes (mol).
Hence, the pressure work applied on leaf cells can be converted into internal energy of electromotive force, and they have a direct relationship, PV = a E:
where P is the pressure intensity on the leaf cells (Pa), a is the energy conversion coefficient of the electromotive force, and V isthe cell volume (m3). Further, , where F is the clamping force (N) and S is the effective area of the electrode plate (m2). F can be calculated by the gravity formula:
where M is the iron block mass (kg), m is the mass of the plastic rod and the plate electrode (kg), and g = 9.8 N/kg.
For mesophyll cells, the sum of and
is certain.
is directly proportional to the conductivity of electrolytes that respond to Z, and the conductivity is the reciprocal of Z. Hence,
can be expressed as
, where JO is the ratio coefficient of the conversion between
and Z and Q is
+
. Therefore, Formula (2) can be transformed into Equationequation (6)
(6)
(6) ..
and
The exponents of both sides in Equationequation (9)(9)
(9) :
Further,
As
For the same leaf tested in the same environment, the d, a, ,
, T,
,
, Q, and
of Formula (10) are constants. Let
and
, then the intrinsic mechanical relationships of leaf Z and F are
where y0, k1, and b1 are the model parameters.
When F = 0, the inherent impedance (IZ) can be determined by
same as the Z, and the inherent mechanical relationships of leaf XC and F are revealed.
where ,
, and
are the model parameters. When F = 0, the intrinsic capacitive reactance (IXC) (IR) of the plant leaves can be calculated as
Like R, the inherent mechanism relation of leaf XL and F are calculated as
When F = 0, the inherent inductive reactance (IXL) of the plant leaves could be calculated as
Thus, the inherent impedance (IZ) and inherent capacitance (IC) of the plant leave were, respectively, obtained according to Equationequations (18)(18)
(18) and (Equation19
(19)
(19) )
The clamping force according to the first law of thermodynamics were obtained as follows
The Gibbs free energy equation is
where ΔG is Gibbs free energy, ΔH is the internal energy of the leaf cell system, P is the pressure intensity of the leaf cells, and V is the cell volume (m3). P can be calculated by the pressure intensity equation:
where F is the clamping force (N) and A is the effective area of the electrode plate (m2).
The mesophyll cells could be regarded as concentric sphere capacitors. The equation for the energy of spherical capacitor is
where WC is the capacitor energy, U is the test voltage (V), and C is the physiological capacitance (pF). According to energy conservation theory, a capacitor’s energy is equal to the work converted by the Gibbs free energy, i.e., W = ΔG. The leaf C and clamping force (CF) relationship model can thus be obtained by
By assuming that ET is the specific effective thickness of the plant leaves, therefore, ET = V/A; Equationequation (24)(24)
(24) can be rewritten as
We assume that , then Equationequation (25)
(25)
(25) can be transferred as
EquationEquation (25)(25)
(25) is a linear model equation, where
C is thecapacitance (pf), b0 and K are the model parameters, and CF is theclamping force (N).
As K = , the specific effective thickness (ET) of the plant leaves can be calculated as
2.3. Intracellular water utilization parameters
The cell is of sphere shape, and increase in volume of the cell is associate with their growth. The concentric spherical capacitor formula helps to calculate the C value of the plant leave.
where π = 3.1416, Cc is the capacitance of the concentric spherical capacitor (pF), ε is the dielectric constant of electrolytes, R1 is the outer sphere radius (m), and R2 is the inner sphere radius (m). For a plant cell, R2 − R1 is the thickness of the cell membrane. R1 ≈ R2, ε, and the thickness of the cell membrane are constant. Therefore, the cell volume (VC) has the following relationship with the cell C
The vacuole volume is directly proportion to cell volume, and the water is an important component of the vacuole and cytoplasm. Furthermore, the water-holding capacity of the cells is directly proportional to Therefore,
can represent the water-holding capacity of the plant leaves. The intracellular water-holding capacity (IWHC) of the plant leaves can be calculated by Equationequation (29)
(29)
(29) as follows:
ET is the specific effective thickness of leaves that characterizes the growth of the cells. Water-holding capacity provides main support for the cell growth. Hence, the intracellular water-use efficiency (IWUE) of leaves is represented by Formula (30):
According to Ohm’s law, IZ: U/Z, where IZ is the physiological current (A), U is the test voltage (V), and Z is the physiological impedance (Ω). At the same time, the current is equal to the product of the capacitance and the differential of voltage in time, as shown in equation (31):
Subsequently, for the essential transformation, the current time is the product of the capacitance and impedance. Therefore, the intracellular water-holding time (IWHT) of plant leaves is characterized as follows (32):
2.4. Determination of salt transport parameters
Plant cells have the electrical properties of low capacitance and high resistance, and it could be assumed that electrical cells were connected in parallel manner, and various aligned mesophyll cells make up the leaf capacitor. The value of IR in plant leaf cells can be measured as follows:
We can assume that the resistance of inside and outside membrane is equal; then, IR₁, IR₂, IR₃, and IRn can represent inherent resistance of each unit cell membrane. Hence, the IR of the plant leaves were obtained as follows:
Further, the resistance of the cell membrane closely related to lipids and proteins, so, n can be denoted as the relative number of lipids and proteins that induce membrane R in plant leaves. Finally, the leaf IXC in plant were measured as follows..
As we know that capacitive resistance of cell membrane is closely related to the surface proteins, then IXC or p was considered as the relative amount of surface proteins. Therefore, IXC is inversely proportional to p.
The IXL of plant leaf was obtained as
As we know that inductive resistance of cell membrane is closely related to the binding proteins, then IXL or q was considered as the relative number of binding proteins. Therefore, IXL is inversely proportional to q.
The cell membrane proteins are most closely related to the salt transport; thus, the relative salt flux per unit area (USF) could be represented by Equationequation (37)(37)
(37) :
Salts are soluble in water, and the water transfer rate and the salt transfer rate (STR) are conceptually similar and assigned the same value; thus, it can be calculated by Equationequation (38)(38)
(38) :
Therefore, the salt transport capacity (STC) is USF multiplied by STR:
Salt outflow capacity is related to the biological current. The greater the biological current, the greater the ability of Na+ outflow of the cation opposite to the electron. Therefore, we define I = V/IR, I = V/IXC, I = V/IXL, and I = V /IZ as salt outflow capacity. Here, V represents the voltage applied in determination, and I represents the current flowing through the cell membrane. Therefore, finally, we define 1/IR, 1/IXC, 1/IXL, and 1/IZ as the portion of salt outflow capacity and normalize the value of 1/IR, 1/IXC, 1/IXL, and 1/IZ, respectively, as (0,1) into IRN, IXCN, IXLN, and IZN. If IRN, IXCN, IXLN, and IZN have the same weight, we define salt outflow capacity as follows:
Here C1 is equal to the salt outflow capacity
The cell volume and intracellular salt-holding capacity can be determine by IC, ET, IWHC, and STC. Therefore, we define them as the portion of salt dilution capacity and normalize the value of IC, ET, IWHC, and STC, respectively, as (0,1) into ICN, ETN, IWHCN, and STCN. If ICN, ETN, IWHCN, and STCN have the same weight, we define salt dilution capacity (large capacity (C2)) as follows:
The ultrafiltration capacity is related to salt flow rate and flow time through the cell membrane. 1/IWUE represents the salt solution flux, IWHT represents the salt flow time, 1/USF represents the solute flux, and STR represents the flow rate. Therefore, we define 1/IWUE, IWHT, 1/USF, and STR as the portion of ultrafiltration capacity and normalize the value of 1/IWUE, IWHT, 1/USF, and STR, respectively, as (0,1) into IWUEN, IWHTN, USFN, and STRN. Assume that IWUEN, IWHTN, USFN, and STRN have the same weight, we define ultrafiltration capacity (C3) as follows:
If C1, C2, and C3 have the same weight, we define the total salt resistance capacity (T) as follows:
2.5. Leaf water potential (Ψ)
Leaf water potential (Ψ) indicates whole plant water status, and high leaf Ψ is found to be associate with dehydration avoidance mechanisms. Leaf Ψ is connected with opening of stomata because water moves from root to leaf through the series ‘pipes’ known as xylem and is evaporated through small openings on the leaf surface called stomata. In this study, leaf Ψ is determined by a dew point microvolt meter in a C-52-SF universal sample room (Psypro, Wescor, USA); the measuring time was 9:00–11:00 am in both the phases (SS phase and RW phase).
2.6. Photosynthetic traits
The net photosynthesis rate (PN), leaf stomatal conductance (gs,) leaf intercellular CO2 concentration (Ci), and transpiration rate (Tr,) were recorded using a portable LI-6400XT photosynthesis measurement system (LI-COR, Lincoln, NE, USA). The leaf of both species was enclosed within the chamber and stirred continuously with two fans inside. For each parameters, five repeats were taken; totally, four plants were measured in each treatment. The top of the expanded leaf was used for these measurements during full sunshine.Citation31 Throughout the measurement, the set values are as follows: the flow rate inside the chamber, 500 (µmol s−1), atmospheric pressure 99.9 kPa, using its own blue and red light, and photosynthetic active radiation (PAR) was 800 (µmol m−2 s1).
2.7. Statistical analysis
he measurements were analyzed using analysis of variance (ANOVA) on SPSS software (version 20.0, SPSS Inc.) to assess the significant modification between diverse salt levels using Duncan’s LSD post hoc test at p < .05; The data were shown as the mean ± standard error (SE). The figures of physiological and growth parameters were prepared by Origin Pro. 9.0 (Northampton, MA, USA).
3. Results
3.1. Confirmation of inherent mechanism relationship
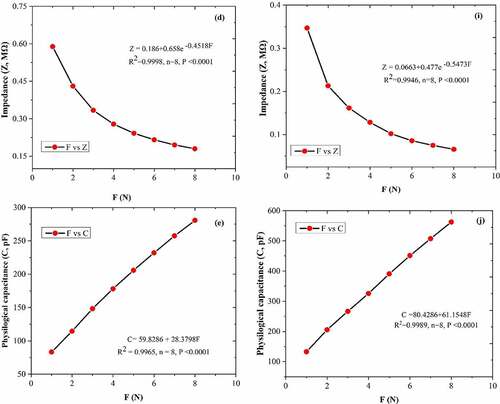
Between CF and leaf R, XC, XL, Z and C was generated the fitting curves equations; R (), XC (), XL (), Z (), and C () of the A. corniculatum species, while R (), XC (), XL (), Z (), and C () of the K. obovate species were choose randomly from the list of stress phase. The results of fitting curve equations show that the values of R, XC, XL, Z, and C correlated with CF. The correlation coefficient (R2) of both mangrove species was 0.99, and P value was ≤0.0001. These results demonstrate that the CF and leaf R, XC, XL, Z, and C show positive correlations and highlight that the inherent relationships of these mechanism are authentic existence.
Figure 4. The equations of fitting curve relationship between clamping force CF and leaf resistance (R), capacitive reactance (XC), inductive reactance (XL), impedance (Z), andphysiological capacitance (C). Figure (a–e) represents the A. corniculatum species and figure (f–j) represents the K. obovate species fitting equations in stress condition (random examples).
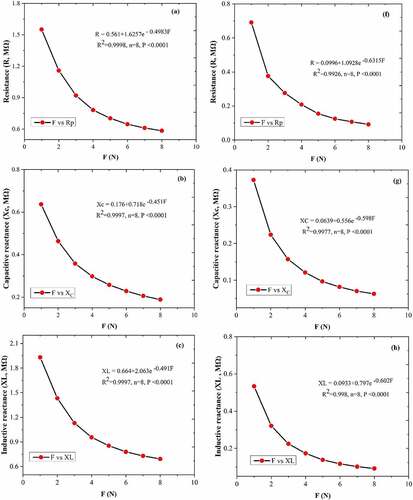
Figure 4. Continued.
3.2. Electrophysiological parameter of A. corniculatum species
The results demonstrate that the inherent relationship between CF and leaf R, XC, XL, Z, and C of both mangrove species are shown in , while inherent electrical parameters including IR, IXC, IXL, IZ, IC, and ET of A. corniculatum species in SS and RW phase are shown in . In stress phase, A. corniculatum has nonsignificant results, which were observed of IR, IXC, and IXL in low and medium salt level, but at high salt levels, the values were increasing. IC results were significantly change higher, values were recorded at low salt level and lower values were at high salt level but ET values nonsignificant and sharply decreased at higher salt level. The SNP application exhibited obvious effects, which could indicate that changes in IXC and IC in different salt levels of other parameters show nonsignificant effects with SNP application in SS phase. Furthermore, it was noted that SNP can be reflected on IXC, IZ, and IC in a long-term and low salt environment, while ET increased in medium salt environment. Moreover, rewatering technique does not improve these parameters expected ET. In moderate -low (M-L) and high-medium (H-M) level ET results noticeable changes were seen.
Table 1. The electrophysiological parameters of A. corniculatum species in salt stress and rewatering phase, clamping force CF = 0
3.3. Electrophysiological parameter of K. obovate species
The electrical parameters of K. obovate species including IR, IXC, IXL, IZ, IC, and ET in SS and RW phase are shown in . In the stress phase, K. obovate species has nonsignificant results noted for IR, IXC, IXL, and IZ in all salt level, while IC and ET showed significant results in low and medium salt level in SS phase. These results display that IC and ET are clearly reflecting the K. obovate species in stress phase. The SNP application improves the IXC and IXL in high salt environment and ET in low and medium salt level. These results display that SNP clearly reflected IXC, IXL, and ET in SS phase. Moreover, when decreased the salt concentration in rewatering phase, the IC values were increased at H-M level and ET values at M-L level, and other parameters show nonsignificant results in RW phase.
Table 2. The electrophysiological parameters of K. obovate species in salt stress and rewatering phase, clamping force CF = 0
3.4. Intracellular water utilization parameters of A. corniculatum
The result of water utilization parameters of A. corniculatum is shown in . Based on IR, IXC, IXL, IZ, and IC equations, the IWHC, IWUE, IWHT were obtained, which show the water status in mangrove leaves. The results of IWHC show significant change in low-high salt level, while IWUE and IWHT show nonsignificant results in the SS phase.There is not any prominent change were observed in IWHT when increasing the salt level. Addition of SNP improves the IWHT at low salt level, while nonsignificant results were seen for IWHC and IWUE in the SS phase with SNP application. These results indicates that SNP reflected only IWHT at low salt level. RW shows positive impact on IWHC at H-M level and IWUE at M-L salt level.
Table 3. The water utilization parameters of A. corniculatum in salt stress and rewatering phase
3.5. Intracellular water utilization parameters of K. obovate species
The results IWHC, IWUE, and IWHT of K. obovate species are shown in . In the SS phase, IWHC and IWHT values were decreased with increasing the salt level, an obvious effect was observed, while IWUE having nonsignificant results were observed during SS phase. The addition of SNP shows clearly the changes on IWHT, but IWHC and IWUE shows nonsignificant results with SNP application in the SS phase. RW technique shows positive impact on IWHC and IWHT at M-L level, and IWUE show nonsignificant results in all salt level with and without SNP application. These results indicate that SNP and RW show different impact on K. obovate species in different salt level.
Table 4. The water utilization parameters of K. obovate species in salt stress and rewatering phase
3.6. Salt transport parameters of A. corniculatum and K. obovate species
Results of salt transport parameters of A. corniculatum species are shown in . Based on the mechanical equations, the USF, STR, and STC were monitored. Results of SS phase show that USF has nonsignificant result in low and medium salt level, but at high salt level, values were increased, while STR values were decreased and increased with increasing salt concentration in low–high salt level. Furthermore, STC has nonsignificant result even in high salt environment. These results display that STC does not reflect in SS phase. Moreover, SNP improves the USF and STR in low and medium salt level, but in higher salt level, SNP is not reflected by USF and STR in the SS phase. When the salt concentration decreased in rewatering phase, nonsignificant results were observed; it means rewatering technique did not reflect the USF, STR, and STC of A. corniculatum species.
Table 5. Salt transport parameters of A. corniculatum species in salt stress and rewatering phase
The results of salt transport parameters of K. obovate species are shown in .The results of USF significantly changed in low-high salt level during the SS Phase. STR values were decreased with increasing the salt concentration during the SS phase. SNP application clearly reflected USF at low salt level in the SS phase, but STR and STC shows nonsignificant results with addition of SNP application. RW phase does not improve the USF and STR, but STC was improved specially at the M-L level. These results indicate that SNP and RW both show different impact on salt-resistant parameters of K. obovate species in different salt levels.
Table 6. Salt transport parameters of K. obovate species in salt stress and rewatering phase
3.7. Water potential (Ψ) of A. corniculatum and K. obovate species
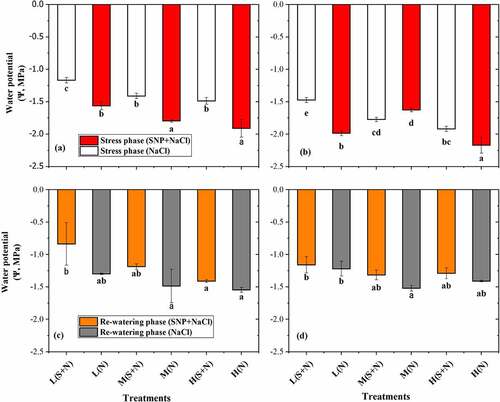
The Ψ of A. corniculatum and K. obovate species showed significant results in SS and RW phase in . In the SS phase, the results were significant with SNP application of A. corniculatum species, and it was observed that Ψ was improved by SNP application. During the rewatering phase, Ψ also found higher values as compared to stress phase. Changes were observed in both phase, which indicated that when salt level increased, Ψ of A. corniculatum species was decreased. Furthermore, the results of K. obovate species also was significant during the stress phase. K. obovate obtained higher values in higher salt level, which shows that K. obovate are more salt resistant, and the salt storage capacity and vacuole volume are larger. In the RW phase when salt concentration decreased, K. obovate species increased the Ψ 34.6%, 6.9%, 48.6%, and 53.9% as compared to stress phase shown in . These results indicate that RW technique and SNP application improve the Ψ.
Figure 5. Effect of salt stress and rewatering on water potential (Ψ): (a, c) A. corniculatum and (b, d) K. obovate. The value n = 12 and small letter indicates significant difference at (p < .05) using Duncan’s multiple range tests.
3.8. Photosynthetic traits of A. corniculatum species
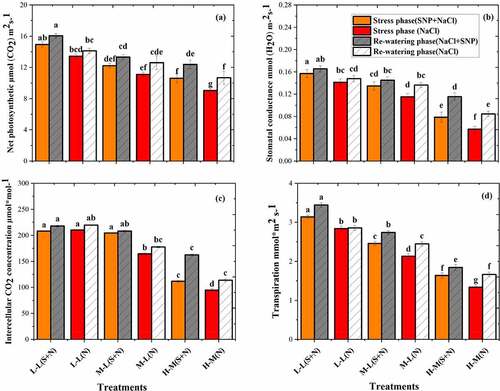
The photosynthetic parameters of A. corniculatum species was significantly decreased in the SS phase and increased in RW phase as shown in . The effects of salt varied from time to time, with significant interactions between time and NaCl concentrations. The PN values were decreased by increasing the salt concentration, even at lower concentration. The lowest value was recorded at high salt level and higher value at lower salt level (). Stomatal conductance was a more sensitive parameter in stress condition, as compared to PN, and it was noted that gs was significantly decreased in A. corniculatum with increasing salt concentration, and more prominent reduction of gs was found in high salt level with and without SNP application inthe stress phase (). Furthermore, similar trend was observed, and the intercellular concentrations CO2 (Ci) were also reduced. Thus, the nonsignificant difference was observed in T1, T2, and T3 treatment, although T5 and T6 treatments were sharply decreased. Similarly, the Tr were decreased throughout the stress phase; the important reduction was noted in T5 and T6 treatments. After that, the results of RW phase show that the PN values increased by 14.2% and 15.3%, gs by 47% and 47.3%, Ci by 31.1% and 16.9%, and Tr by 12.6% and 24.3% in T5 and T6 treatments, respectively, compared to stress phase. The reason of increment in physiological parameters during RW phase was the low concentration of NaCl.
Figure 6. Effect of salt stress and rewatering on (a) net photosynthetic, (b) stomatal conductance, and (c) intercellular CO2 (Tr) transpiration of A. corniculatum. The value n = 12 and small letter indicates significant difference at (p < .05) using Duncan’s multiple range tests.
3.9. Photosynthetic traits of K. obovate species
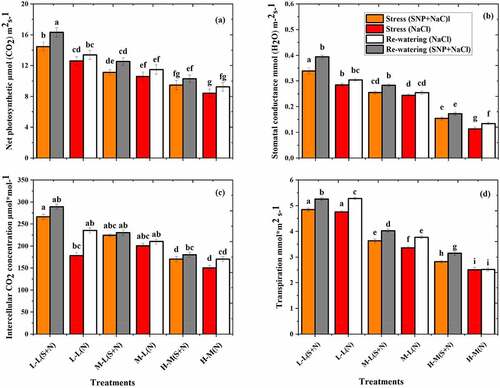
The photosynthetic parameters of K. obovate species were significantly decreased in the SS phase and increased in RW phase as shown in . The lowest value was recorded at T5 and T6 treatments and higher value at T1 (). It was also noted that T5 and T6 treatments have nonsignificant differences. The gs and Ci obtained higher values in T1 treatment and lower values in T6 treatment. Furthermore, the results of RW phase show that the PN values increased by 8.7% and 9.9%, gs by 10.4% and 15.6%, Ci by 5.7% and 13.3%, and Tr by 11.6% and 0.5% in T5 and T6, respectively, compared to the stress phase.
Figure 7. Effect of salt stress and rewatering on (a) net photosynthetic, (b) stomatal conductance, and (c) intercellular CO2 (Tr) transpiration of K. obovate. The value of n = 12 and small letter indicates significant difference at (p < .05) using Duncan’s multiple range tests.
3.10. The correlation between electrophysiological and photosynthetic parameters of mangrove species
shows the correlation between electrophysiological, water utilization, salt transport, and photosynthesis parameters of A. corniculatum species. During the stress phase, it was observed that USF highly positively correlated with IR, IXC, IXL, and IZ and negatively correlated with ET, IWHC, STC, and IWHT. STR was highly positively correlated with IC, IWHC, and gs, while negatively correlation was noted with IR, IXC, IXL, and IZ. Furthermore, IWHC significantly correlated with IR, IXC, and IZ and positively correlated with the determiner IC, STR, gs, and Tr. Moreover, in the RW phase, IZ with IR, IXC, IXL, and USF is positively correlated and IZ with PN, gs, Ci, Tr, and Ψ is negatively correlated. USF absolutely correlated with IR, IXC, IXL, and IZ, while negatively correlated with IC, ET IWHC, STC, IWUE, IWHT, PN, gs, and Ψ. In addition, STC negatively correlated with IR, IXC, IXL, IZ, ET, IWHC, USF, IWHT, and gs, while positively correlated with PN, Ci, Tr and Ψ.
Table 7. Correlation between electrophysiological, water utilization, salt transport, and photosynthesis parameters of A. corniculatum species in salt stress and rewatering phase
shows correlation between electrophysiological, water utilization, and salt transport and photosynthesis parameters of K. obovate species. In stress phase, IC with IWHC, STC, STR, PN, gs, Ci, Tr, and Ψ have positive correlation, while negatively correlated with IR, IXC, IXL, and IZ. However, USF was negatively correlated with IC, ET, IWHC, STC, IWUE, IWHT, STR, PN gs, and Ψ and positively correlated with IR IXC, IXL, and IZ. Furthermore, IWUE was highly positive correlated with IR, IXC, IXL, and IZ, while highly negatively correlated with IC. PN with IC, ET, IWHC, gs, Ci, and Tr have significant correlation, while Ψ has negative correlation with IR, IXC, IXL, and IZ and positive correction was observed with IC STC, STR, and Ci. Moreover, in RW phase, IR with IXC, IXL, IZ, and IWUE have strongly positive correlation, while it has negative correlation with IC, ET, IWHC, USF, STR, PN, gs, Ci, Tr, and Ψ. Furthermore, USF has negative correlation with IC, ET, IWHC, STC, PN, gs, Tr, and Ψ. However, IWHT is negatively correlated with IR, IXC, IXL, IZ, STC, and IWUE. Additionally, IC with PN, gs, Ci, Tr, and Ψ have significant correlation, and PN with its gs, Ci, Tr, and Ψ have positive correlation.
Table 8. Correlation between electrophysiological, water utilization, salt transport, and photosynthesis parameters of K. obovate species in salt stress and rewatering phase
3.11. Different salt-resistant capacities of mangrove species
As shown in , the salt outflow capacity is defined as C1 = 0.25 (IRN+ IXCN +IXLN+ IZN), salt dilution capacity as C2 = 0.25 (ICN+ETN+IWHCN+STCN), ultrafiltration capacity as C3 = 0.25 (IWUEN+IWHTN+USFN+STRN), and total salt resistance capacity as T = (C1+C2+C3) /3 in salt-stress and rewatering phase of A. corniculatum species. Hence, in , we assess the combined effects of three different capacities in diverse salt levels with SNP application. In both phases, it was noted that the SNP application shows obvious effects as compared to where species received only NaCl treatment. In C1 capacity, A. corniculatum species obtained higher values of 0.88 in SS phase (SNP + NaCl) and 0.79 in RW phase. In C2 capacity, higher values were noted with SNP application: 0.62, 0.46, and 0.37, while in the C3 capacity, higher values were observed, 0.66, 0.60 and 0.20, correspondingly as compared to the stress phase. Therefore, it was state that SNP application was more reflected at low salt level in these different capacities. Moreover, RW does not improve these capacities in high salt level because A. corniculatum cannot tolerate high salt, but in the same salt level, SNP shows better results.
Table 9. Salt outflow capacity (C1), salt dilution capacity (C2), and salt ultrafiltration capacity (C3) of A. corniculatum in salt-stress and rewatering phase
shows three different capacities of K. obovate species in SS and RW phase. In stress phase C1 and C3 capacity, higher values were obtained only in low salt level with SNP application, 0.80 and 0.84 respectively, but in moderate and high salt levels, SNP does not improve the C1 and C3 capacities of K. obovate species; these results indicate that SNP cannot conducive the adaptability of K. obovate species in high salt level. However, C2 capacity results are almost same at low and moderate salt level, but SNP helps to improve the C3 capacity of K. obovate species in low sat level. Furthermore, RW technique is beneficial for K. obovate species, and when the salt level decreased from M-L in C3 capacity, there was great improvement as compared to NaCl, and also at H-M level, RW shows good impact as compared to SS phase. SNP application and RW technique have diverse effects on C1, C2, and C3 capacities of K. obovate species.
Table 10. Salt outflow capacity (C1), salt dilution capacity (C2), and salt ultrafiltration capacity (C3) of K. obovate species in salt stress and rewatering phase
4. Discussion
The current study measures electrophysiological parameters of A. corniculatum and K. obovate species in SS and RW phase. The electrophysiological parameters associated with plant cell, vacuole volume, and almost all life activities, if plant is stressed, practically all life activities are impacted. Nitric oxide (NO) application could improve the plant stress resistance and effects on photosynthesis system, antioxidant enzyme system, and metabolism system.Citation32 The cell can be considered as a concentric sphere capacitor by their resistor inductor functions,Citation2,Citation5 in which the electrolytes of a capacitor are equivalent to electric ions, ion groups, and dipoles. When the cell membrane permeability changes were observed, at that time plant leaf is subjected to a CF stimulus.
Consequently, electrolyte concentrations in inner and outer side changes in the cell membrane, which leads to variation in the leaf C, R, and Z. The Nernst equation could be utilized to expose the electrical potential formed by ions and used to quantitatively describe the diffusion gradient of electrolytes in the outer and inner side of cell membrane.Citation33 The Nernst equation, Z (or XC) , and theoretical intrinsic relationships between the CF and Z and XC of mangroves species was exposed in this paper. The process in which the decreased internal energy of the system can be change into the work done by the system is a concept of Gibbs free energy. According to Gibbs free energy, C = x + KF of the theoretical inherent relationships between the leaf CF and C. The results demonstrated that the fitting equations of R-CF, XC–CF, XL-CF, Z-CF, and C–CF have positive correlations, which highlighted the existence of the above-mentioned inherent mechanism. In the current study, the IR, IXC, IXL, IZ, IC, and ET values of inherent electrical parameters in mangrove leaves were successfully obtained with the help of inherent mechanical relationships between the CF and leaf Z, XC, XL, R, and C.
The nonsignificant results of IR, IXC, and IXL of A. corniculatum species were observed in low and moderate salt levels. IC results had significant change when the salt concentration was increased. SNP application shows positive impact on IXC and IC in different salt levels. These results indicate that IXC and IC are reflected by SNP in long-term and low salt environment, while ET shows positive impact at medium salt level when receiving the SNP application. The ET in plant leaf is highly variable, which depends on plant species.Citation2 These results correctly clarify the phenomenon of life in plant: when the concentration of electrolyte is low and intracellular water in plant leaves is sufficient, then plant contains low IR, IZ, IXC, and IC and ET. Moreover, the RW technique does not help to improve these electrical parameters expect ET at moderate salt level. Furthermore, IR IXC, IXL, and IZ parameters state the salt outflow capacity in plant.
The K. obovate species having nonsignificant results were noted of IR, IXC, and IXL, while IC and ET have significant results. These results demonstrate that IC and ET are clearly reflecting the K. obovate species in stress phase. In our previous study, we noted that the vacuole volume of K. obovate species was higher, which enables it to store more salt even in high salt level.Citation34 The K. obovate species grown under great water state had higher IWHC, which indicate and support the higher IC and ET values of K. obovate species. Excluding the IC and ET, the results of remaining parameters were nonsignificant in rewatering, while the IC and ET were considerably improved at the M-L salt level.
The IWHC, IWUE, and IWHT associated with plant cell volume and water utilization parameters. These parameters display water status in plant leaves, representing the ion concentration and intercellular water occupied in plant cell. The results of IWHC in stress phase was significant and reflect of A. corniculatum species, while IWUE has nonsignificant results during the SS phase. The results also indicates that SNP application and rewatering technique show positive impacts on IWHT, which improve by SNP in low salt level, while IWUE show better results at moderate salt level with SNP application. Moreover, the results of K. obovate species of IWHC and IWHT were significant and IWUE was nonsignificant, which shows that IWHC and IWHT reflect the K. obovate species in stress phase when the salt level increased. Because K. obovate species have bigger vacuole volume, it keeps lower solute concentration in vacuole;Citation34 hence, the water status of the plant leaf was unaffected. A recent research study reported that with the help of electrophysiological parameter, the metabolism of water status of various plant was evaluated.Citation2
Moreover, in the mesophyll cells, organelles and cell are existing enclosed within the cell membrane composed of 40% proteins, 50% lipids, and 2 to 10% sugars.Citation35 Inductive reactance and inductance are affected by binding protein and capacitive reactance and capacitance by the surface proteins. Thus, the mesophyll cell can be regarded as a concentric sphere capacitor with both inductor and resistor function, and the ions, ion groups, and electric dipoles are equivalent to the electrolytes of a capacitor.Citation35 Previously, the monitoring of the salt transport capacity of plants has hardly been described. In the current study, the salt transport capacity of mangroves species based on mechanical equation of IR, IXC, IXL, IZ, and IC was obtained. The results were significant of STR in both phases (SS and RW) of A. corniculatum species, while STC have nonsignificant results. USF was reflected by A. corniculatum species only at higher salt level. These result shows that STR was reflected by A. corniculatum species in both phases. Furthermore, SNP application could improve the USF and STR in low and medium salt level, but in the high salt level, USF and STR were not reflected in the SS phase. However, rewatering does not improve the salt transport capacity of A. corniculatum species.
Moreover, USF, STR, and STC were reflected in stress phase of K. obovate species, and obvious changes were observed when salt concentration increased. In our recent study, we know that v =, V = volume of vacuole, and CP = physiological capacitance if volume of vacuole is bigger; thus, physiological capacitance was also higher.Citation34 The SNP application also improved and reflected the USF during the SS phase, and rewatering technique also improve the USF and STC. These results indicate that as compared to SNP, rewatering does not improve and reflect the STR.
The variation in Ψ of both mangrove species are shown in . The Ψ decreased, which indicated that solute concentration inside the cell could have a threshold value for dysfunction of cells and increased the Ψ of plant. Present results state that when salt concentration increased, Ψ also decreased, and it means solute concentration inside the cell was higher and inhibited the leaf cell. The cell volume depends on salt storage capacity. During the RW phase, Ψ shows good response as mentioned in , because solute concentration inside the cell was decreased, so that the Ψ also decreased. Additionally, physiological parameters were more inhibited of A. corniculatum species in SS phase. Presence of Na+ can be harmful for plant metabolism and potentially kill the plant.Citation36 The most common explanation for Na+ toxicity is that it has an inhibitory effect on the activities of enzymes. Therefore, SNP also increase the leaf cell size and helps to upstand in stress condition.Citation37 When the leaf cell size increases, it directly impacts on salt secretion rate of A. corniculatum. The PN significantly decreased with increasing the salt concentration, but in those treatments where plant received SNP + NaCl application, the PN values were observed higher than other treatments. Furthermore, other photosynthesis-related parameters such as gs and Tr also decreased with increasing salt concentration.Citation38 When the salt entered in vacuole, it impacts on whole cell especially solute concentration in the cytosol. Generally, salt glands in recretohalophytes lack a big central vacuole but contain others microvacuoles; these microvacuoles may have a connection with active metabolism of salt glands.Citation39 Moreover, the application of rewatering demonstrations better development of A. corniculatum and obtained higher values in all treatments of photosynthetic parameters, which is exposed in . The increment is noticed in all treatment, but more dominated values were seen in where mangrove received high salt concentration. The PN values increased by 14.2% and 15.3% and gs by 47% and 47.3% in T5 and T6 treatments compared to stress phase. Because when the salt concentration decreased, at that time leaf cell maintained their metabolism and water status, which helps to increase PN values and gs. Present results supported by findings of Azeem et al. and Javed et al.Citation40,Citation41 reported that application of RW helps the plant to maintain their development, and the effects of salt stress could be reduced by RW.
The physiological parameter of K. obovate species decreased by NaCl in the SS phase as shown in . The reason of reduction in physiological parameters are presence of NaCl in water, which increase the osmotic stress, resulting in rapid closing of gs and decreased the PN. The K. obovate species contain larger leaf cell size and vacuole volume as compared to A. corniculatum. With their particular mechanisms, the vacuole can store salts and exclude them. Citation42 The PN and gs in T1 treatment obtained higher values and lower value in T6. As reported by Xu et al.,Citation11 the high salinity inhibited photosynthesis by closing of gs, and on the other hand, the reduction of CO2 assimilation was the main cause of salt stress on photosynthetic activity. The CO2 assimilation rate and gs both are decreased when increasing the environmental salinity.Citation43 Furthermore, during the RW phase when salt concentration decreased as compared to SS phase, the photosynthetic parameters show higher value than stress phase (). Javed et al.Citation41 reported that gs was sharply responsive when there was changes in the soil water salinity. Similar trend was seen in the present study when decreasing the salt concentration, mangrove shows higher value of gs and other related parameters in the RW phase. According to the results, we observed that the electrical parameters better characterized the response of mangroves in stress condition as compared to photosynthesis parameters. Finally, in this study, intracellular water-use indices IWHC, IWUE, and IWHT are based on plant inherent electrical parameters and have ability to monitoring the intracellular water metabolism in mangroves and IR, IXC, and IXL of plants electrophysiological information, which could efficiently manifest the composition and salt transport characteristics of membrane protein in mangroves.
Furthermore, in , it was demonstrated that USF highly positively correlated with IR, IXC, IXL, and IZ in both phases (SS and RW), while negatively correlated with ET, IWHC, STC, and IWHT of A. corniculatum species. STC positively correlated with IC, ET, IWHC, STR PN, Ci, Tr, and Ψ in stress phase and negatively correlated with other parameters, but in RW phase, only PN, Ci, Tr, and Ψ show positive correlation with STC. Moreover, correlation of IC with IWHC, STC, STR, PN, gs, Ci, Tr, and Ψ is positive for K. obovate species, whereas USF negatively correlated with IC, ET, IWHC, STC, IWUE, IWHT, STR, PN gs, and Ψ. Furthermore, IWHC has positive correlation with IC and ET because IC and IWHC are directly connect with vacuole volume; thus, when IWHC increased, similarly IC and ET also increased. In our previous study, PN shows positive correlation with gs, Ci, Tr, and Ψ.Citation34 Similarity was seen in current study, where PN positively correlated with photosynthesis parameters. In the rewatering phase, IR with IXC, IXL, IZ, and IWUE have strongly positive correlation and IC with PN, gs, Ci, Tr, and Ψ have significant correlation of K. obovate species.
Furthermore, the results of three different capacities are shown in of A. corniculatum and K. obovate species. Salt outflow capacity, salt dilution capacity, and salt ultrafiltration capacity of A. corniculatum species were improved with SNP application in all salt levels. At the low salt level, by SNP application, A. corniculatum species obtained higher value of 0.88, in medium salt level, 0.64, and high level, 0.31; when the salt level increased, simultaneously the values of C1 capacity were decreased. Because A. corniculatum species cannot be tolerant in the high stress environment, but SNP shows improvement only in C2 and C3 capacities when salt level reach at 400 mM (). RW technique shows positive impact and helps to improve the only ultrafiltration capacity of A. corniculatum species.
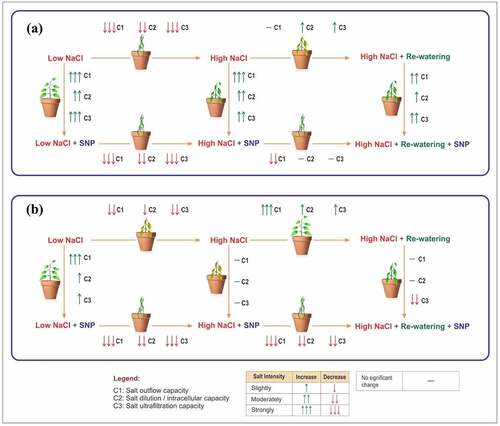
Figure 8. Hypothetical model of mangrove species in different salt level with influences of SNP and rewatering: (a) A. corniculatum and (b) K. obovate species.
Moreover, C1 and C3 capacities of K. obovate species were improved by SNP application of K. obovate species in low salt level, but in moderate and high salt level, SNP did not improve the C1 capacity. These results indicate that SNP application improves these capacities at low salt level but not beneficial for the adaptability of K. obovate. While, during the low salt level, C3 capacity obtain higher values 0.84 by K. obovate. RW technique improve all capacities and C3 capacity at M-L level was greatly improved. The SNP application used as supplementary and in low salt level shows obvious impact on both species. But at high salt level, SNP shows nonsignificant results of K. obovate species. These results display that electrophysiological parameter could be used to characterize the differences in both mangrove species and clearly reflecting C1, C2, and C3 capacities in different salt levels. These parameters give positive, reliable, and quick results as compared to photosynthesis parameters. Previous research studies reported that the SNP is helpful for restoration of plant in the stress environment.Citation44–46.
demonstrates that the salt tolerance mechanism of both species with impacts of SNP and RW technique. The SNP application at low salt level increases the C1, C2, and C3 capacity of both species, but at high salt level, SNP cannot help to improve the salt-resistance capacities, which indicate that high concentration of salt stress is not accompanied by the peroxidation stress of membrane lipid, while SNP improves the antioxidant capacity. Moreover, RW helps to effectively improve salt tolerance of K. obovate under high salt concentrations, which indicates that K. obovate species is more salt resistant because this process is consistent with the actual situation; under high salt, A. corniculatum is irreversible and RW cannot reverse the salt resistance of A. corniculatum species.
5. Conclusion
The present study initially verifies the relationship of fitting equations between the electrophysical parameters, including R, XC, XL, Z, and C, and the CF of two different mangrove species in the Ss and RW phases. These inherent electrical parameters IR, IXC, IXL, IZ, and IC of mangrove leaves were detected for the first time with the help of mechanical equations. Subsequently, the IWHC, IWUE, and IWHT of the intracellular water-use parameters in the mangroves were defined based on the inherent electrical parameters of the water status of metabolism. These parameters accurately exposed the life activities and changes in water status in mangrove species and could be hypothetically used for the intercellular metabolism water status in mangroves. The salt transport indices USF, STR, and STC were also monitored based on IR, IXC IXL, IZ, and IC. The results show that the electrical parameters IC and ET better reflect the A. corniculatum species, and the IWHC also shows significant results under stress conditions, while K. obovate species is more reflected by IR, while IZ and other electrical parameters show nonsignificant results. Furthermore, the IWHC, IWHT, USF, STR, and NTC could better reflect under different salt levels of K. obovate species. Three different capacities of A. corniculatum species were reflected by SNP application at all salt levels, especially at low salt levels. These capacities were greatly improved by SNP, while obvious changes in K. obovate species were observed at low salt levels. Under low concentration SNP, can effectively improve the salt tolerance of both mangrove species. However, under high concentration, SNP can effectively improve the salt tolerance of A. corniculatum. Moreover, under high concentration, RW only effectively improves the salt resistance of K. obovate, which indicates that K. obovate is more salt-resistant because RW process is consistent with the actual situation, the response of A. corniculatum to high salt stress is irreversible, and RW cannot reverse the salt resistance of A. corniculatum species. Therefore, it is concluded that these three capacities help to understand salt tolerance mechanism and different adaptive strategies of both mangrove species in diverse salt levels.
Author contributions
YYW: Conceptualization, Methodology, Funding acquisition, Supervision, Validation; KAS: Data curation; Formal analysis, Writing - original draft, Visualization; DX: Formal analysis, Software; WAQ, MHT, SAS, and AS: Writing - review and editing.
Disclosure statement
No potential conflict of interest was reported by the author(s).
Additional information
Funding
References
- Sukhov V. Electrical signals as mechanism of photosynthesis regulation in plants. Photosynth Res. 2016;130(1–3):373–20. doi:10.1007/s11120-016-0270-x.
- Zhang C, Wu Y, Su Y, Xing D, Dai Y, Wu Y, Fang L. A plant’s electrical parameters indicate its physiological state: a study of intracellular water metabolism. Plants. 2020;9(10):1256. doi:10.3390/plants9101256.
- Sukhov V, Sukhova E, Vodeneev V. Long-distance electrical signals as a link between the local action of stressors and the systemic physiological responses in higher plants. Prog Biophys Mol Biol [Internet]. 2019;146:63–84. doi:10.1016/j.pbiomolbio.2018.11.009.
- Sukhov V, Vodeneev V. A mathematical model of action potential in cells of vascular plants. J Membr Biol. 2009;232(1–3):59–67. doi:10.1007/s00232-009-9218-9.
- Xing D, Chen L, Wu Y, Zwiazek JJ. Leaf physiological impedance and elasticity modulus in Orychophragmus violaceus seedlings subjected to repeated osmotic stress. Sci Hortic (Amsterdam). 2021;276:109763. doi:10.1016/j.scienta.2020.109763.
- de Jong SM, Addink EA, Doelman JC. Detecting leaf-water content in Mediterranean trees using high-resolution spectrometry. Int J Appl Earth Obs Geoinf [Internet]. 2014;27:128–136. doi:10.1016/j.jag.2013.09.011.
- Nguyen CT, Kurenda A, Stolz S, Chételat A, Farmer EE. Identification of cell populations necessary for leaf-to-leaf electrical signaling in a wounded plant. Proc Natl Acad Sci U S A. 2018;115(40):10178–10183. doi:10.1073/pnas.1807049115.
- Gallé A, Lautner S, Flexas J, Fromm J. Environmental stimuli and physiological responses: the current view on electrical signalling. Environ Exp Bot [Internet]. 2015;114:15–21. doi:10.1016/j.envexpbot.2014.06.013.
- Solangi KA, Siyal AA, Wu Y, Abbasi B, Solangi F, Lakhiar IA, Zhou G. An assessment of the spatial and temporal distribution of soil salinity in combination with field and satellite data: a case study in Sujawal district. Agronomy. 2019;9(12):869. doi:10.3390/agronomy9120869.
- Getzner M, Islam MS. Ecosystem services of mangrove forests: results of a meta-analysis of economic values. Int J Environ Res Public Health. 2020;17(16):1–13. doi:10.3390/ijerph17165830.
- Xu HM, Tam NFY, Zan QJ, Bai M, Shin PKS, Vrijmoed LLP, Cheung SG, Liao WB. Effects of salinity on anatomical features and physiology of a semi-mangrove plant Myoporum bontioides. Mar Pollut Bull. 2014;85(2):738–746. doi:10.1016/j.marpolbul.2014.04.003.
- Liang S, Zhou RC, Dong SS, Shi SH. Adaptation to salinity in mangroves: implication on the evolution of salt-tolerance. Chinese Sci Bull. 2008;53:1708–1715.
- Parida AK, Jha B. Salt tolerance mechanisms in mangroves: a review. Trees - Struct Funct. 2010;24(2):199–217. doi:10.1007/s00468-010-0417-x.
- Qiu DL, Lin P, Su JW. Relationship of leaf ultrastructure of mangrove Kandelia candel (L.) Druce to salt tolerance. J For Sci. 2005;51(10):476–480. doi:10.17221/4581-JFS.
- Ibba P, Falco A, Abera BD, Cantarella G, Petti L, Lugli P. Bio-impedance and circuit parameters: an analysis for tracking fruit ripening. Postharvest Biol Technol [Internet]. 2020;159:110978. doi:10.1016/j.postharvbio.2019.110978.
- Zhang M, Wu Y, Xing D, Zhao K, Yu R. Rapid measurement of drought resistance in plants based on electrophysiological properties. Trans ASABE. 2015;58:1441–1446.
- Acosta-Motos JR, Ortuño MF, Bernal-Vicente A, Diaz-Vivancos P, Sanchez-Blanco MJ, Hernandez JA. Plant responses to salt stress: adaptive mechanisms. Agronomy. 2017;7(1):18. doi:10.3390/agronomy7010018.
- Ball MC. Salinity tolerance in the mangroves Aegiceras corniculatum and Avicennia marina. I. water use in relation to growth, carbon partitioning, and salt balance. Funct Plant Biol. 1988;15(3):447–464. doi:10.1071/PP9880447.
- Xing D, Chen X, Wu Y, Chen Q, Li L, Fu W, Shu Y. Leaf stiffness of two Moraceae species based on leaf tensity determined by compressing different external gripping forces under dehydration stress. J Plant Interact. 2019;14(1):610–616. doi:10.1080/17429145.2019.1686182.
- Mosiichuk N. Effects of sodium nitroprusside on salt stress tolerance of tocopherol-deficient Arabidopsis thaliana Plants. J Vasyl Stefanyk Precarpathian Natl Univ. 2015;2(1):122–131. doi:10.15330/jpnu.2.1.122-131.
- Jian W, Wei ZD, Zhu F, Xun WS, Jun PX, Deng XG, Luo SS, Hui LH. Alternative oxidase pathway is involved in the exogenous SNP-elevated tolerance of Medicago truncatula to salt stress. J Plant Physiol. 2016;193:79–87. doi:10.1016/j.jplph.2016.01.018.
- Shi Q, Ding F, Wang X, Wei M. Exogenous nitric oxide protect cucumber roots against oxidative stress induced by salt stress. Plant Physiol Biochem. 2007;45(8):542–550. doi:10.1016/j.plaphy.2007.05.005.
- Wang Y, Li L, Cui W, Xu S, Shen W, Wang R. Hydrogen sulfide enhances alfalfa (Medicago sativa) tolerance against salinity during seed germination by nitric oxide pathway. Plant Soil. 2012;351(1–2):107–119. doi:10.1007/s11104-011-0936-2.
- Liu S, Dong Y, Xu L, Kong J. Effects of foliar applications of nitric oxide and salicylic acid on salt-induced changes in photosynthesis and antioxidative metabolism of cotton seedlings. Plant Growth Regul. 2014;73(1):67–78. doi:10.1007/s10725-013-9868-6.
- Chen K, Chen L, Fan J, Fu J. Alleviation of heat damage to photosystem II by nitric oxide in tall fescue. Photosynth Res. 2013;116(1):21–31. doi:10.1007/s11120-013-9883-5.
- Gong B, Li X, Bloszies S, Wen D, Sun S, Wei M, Li Y, Yang F, Shi Q, Wang X. Sodic alkaline stress mitigation by interaction of nitric oxide and polyamines involves antioxidants and physiological strategies in Solanum lycopersicum. Free Radic Biol Med. 2014;71:36–48. doi:10.1016/j.freeradbiomed.2014.02.018.
- Xing D, Chen X, Wu Y, Xu X, Chen Q, Li L, Zhang C. Rapid prediction of the re-watering time point of Orychophragmus violaceus L. based on the online monitoring of electrophysiological indexes. Sci Hortic (Amsterdam). 2019;256:108642. doi:10.1016/j.scienta.2019.108642.
- Batra NG, Sharma V, Kumari N. Drought-induced changes in chlorophyll fluorescence, photosynthetic pigments, and thylakoid membrane proteins of Vigna radiata. J Plant Interact. 2014;9(1):712–721. doi:10.1080/17429145.2014.905801.
- Hoagland DR, Arnon DI. Preparing the nutrient solution. Water-Culture Method Grow Plants Without Soil. 1950;347:29–31.
- Xing D, Xu X, Wu Y, Liu Y, Wu Y, Ni J, Azeem A. Leaf tensity: a method for rapid determination of water requirement information in brassica napus L. J Plant Interact. 2018;13(1):380–387. doi:10.1080/17429145.2018.1478006.
- Chen D, Wang S, Cao B, Cao D, Leng G, Li H, Yin L, Shan L, Deng X. Genotypic variation in growth and physiological response to drought stress and re-watering reveals the critical role of recovery in drought adaptation in maize seedlings. Front Plant Sci. 2016;6:1–15. doi:10.3389/fpls.2015.01241.
- Yastreb TO, Kolupaev YE, Karpets YV, Dmitriev AP. Effect of nitric oxide donor on salt resistance of Arabidopsis jin1 mutants and wild-type plants. Russ J Plant Physiol. 2017;64(2):207–214. doi:10.1134/S1021443717010186.
- Beilby M, Coster HG. The action potential in chara corallina III.* The Hodgkin-Huxley parameters for the plasmalemma. Funct Plant Biol. 1979;6(3):337. doi:10.1071/PP9790337.
- Solangi KA, Wu Y, Chen Q, Qureshi WA, Xing D, Tunio MH, Shaikh SA. The differential responses of Aegiceras corniculatum and Kandelia candel under salt stress and re-watering phase. A study of leaf electrophysiological and growth parameters. J Plant Interact. 2021;16(1):307–320. doi:10.1080/17429145.2021.1946606.
- Zhang C, Wu Y, Su Y, Li H, Fang L, Xing D. Plant’s electrophysiological information manifests the composition and nutrient transport characteristics of membrane proteins. Plant Signal Behav [Internet]. 2021;16 doi:10.1080/15592324.2021.1918867.
- Zhao C, Zhang H, Song C, Zhu J-K, Shabala S. Mechanisms of plant responses and adaptation to soil salinity. Innov [Internet]. 2020;1:100017. doi:10.1016/j.xinn.2020.100017.
- Ding F. Effects of salinity and nitric oxide donor sodium nitroprusside (SNP) on development and salt secretion of salt glands of Limonium bicolor. Acta Physiol Plant. 2013;35(3):741–747. doi:10.1007/s11738-012-1114-8.
- Yuan F, Leng B, Wang B. Progress in studying salt secretion from the salt glands in recretohalophytes: how do plants secrete salt? Front Plant Sci. 2016;7:1–12. doi:10.3389/fpls.2016.00977.
- Flowers TJ, Glenn EP, Volkov V. Could vesicular transport of na + and cl - be a feature of salt tolerance in halophytes? Ann Bot. 2019;123(1):1–18. doi:10.1093/aob/mcy164.
- Azeem A, Wu Y, Xing D, Javed Q, Ullah I. Photosynthetic response of two okra cultivars under salt stress and re-watering. J Plant Interact. 2017;12(1):67–77. doi:10.1080/17429145.2017.1279356.
- Javed Q, Wu Y, Xing D, Ullah I, Azeem A, Rasool G. Salt-induced effects on growth and photosynthetic traits of Orychophragmus violaceus and its restoration through re-watering. Rev Bras Bot. 2018;41(3456789):29–41. doi:10.1007/s40415-017-0432-x(012.
- Lang T, Sun H, Li N, Lu Y, Shen Z, Jing X, Xiang M, Shen X, Chen S. Multiple signaling networks of extracellular ATP, hydrogen peroxide, calcium, and nitric oxide in the mediation of root ion fluxes in secretor and non-secretor mangroves under salt stress. Aquatic Botany. 2014;119:33–43. doi:10.1016/j.aquabot.2014.06.009.
- dos Santos Garcia J, Dalmolin ÂC, França MGC, Mangabeira PAO. Different salt concentrations induce alterations both in photosynthetic parameters and salt gland activity in leaves of the mangrove Avicennia schaueriana. Ecotoxicol Environ Saf. 2017;141:70–74. doi:10.1016/j.ecoenv.2017.03.016.
- Huang J, Zhu C, Hussain S, Huang J, Liang Q, Zhu L, Cao X, Kong Y, Li Y, Wang L. Effects of nitric oxide on nitrogen metabolism and the salt resistance of rice (Oryza sativa L.) seedlings with different salt tolerances. Plant Physiol Biochem. 2020;155:374–383. doi:10.1016/j.plaphy.2020.06.013.
- Tian X, He M, Wang Z, Zhang J, Song Y, He Z, Dong Y. Application of nitric oxide and calcium nitrate enhances tolerance of wheat seedlings to salt stress. Plant Growth Regul. 2015;77(3):343–356. doi:10.1007/s10725-015-0069-3.
- Kong X, Wang T, Li W, Tang W, Zhang D, Dong H. Exogenous nitric oxide delays salt-induced leaf senescence in cotton (Gossypium hirsutum L.). Acta Physiol Plant. 2016;38(3):61. doi:10.1007/s11738-016-2079-9.