
ABSTRACT
The NAC (NAM, ATAF1/2, and CUC2) transcription factor family is one of the largest families unique to plants and is involved in plant growth and development, organs, morphogenesis, and stress responses. The NAC family has been identified in many plants. As the main source of resistance genes for sugarcane breeding, the NAC gene family in the wild species Saccharum spontaneum has not been systematically studied. In this study, 115 SsNAC genes were identified in the S. spontaneum genome, and these genes were heterogeneously distributed on 25 chromosomes. Phylogenetic analysis divided the SsNAC family members into 18 subgroups, and the gene structure and conserved motif analysis further supported the phylogenetic classification. Four groups of tandemly duplicated genes and nine pairs of segmentally duplicated genes were detected. The SsNAC gene has different expression patterns at different developmental stages of stems and leaves. Further qRT–PCR analysis showed that drought, low-temperature, salinity, pathogenic fungi, and other stresses as well as abscisic acid (ABA) and methyl jasmonate (MeJA) treatments significantly induced the expression of 12 SsNAC genes, indicating that these genes may play a key role in the resistance of S. spontaneum to biotic and abiotic stresses. In summary, the results from this study provide comprehensive information on the NAC transcription factor family, providing a reference for further functional studies of the SsNAC gene.
Introduction
The NAC family is one of the largest transcription factor families unique to plants, and its name derives from the initials of the NAM of Petunia × atkinsiana, Arabidopsis thaliana activating factor 1 (ATAF1), ATAF2, and CUC2 genes.Citation1 NAC family members have significant structural characteristics. The N-terminus contains a highly conserved NAC domain consisting of approximately 150 amino acid residues.Citation2 This domain contains five subdomains (A-E), including conserved subdomains A, C, and D and diversified subdomains B and E; the C-terminus is the transcriptional activation domain (TAR), which is less conserved and has a high degree of diversity.Citation3,Citation4
NAC transcription factors play important roles in the regulation of plant growth and development,Citation4,Citation5 morphogenesis,Citation6,Citation7 leaf senescence,Citation8,Citation9 and tolerance to biotic and abiotic stresses.Citation10,Citation11 Studies have confirmed that many NAC genes play key roles in the regulation of drought tolerance, salt tolerance, low-temperature resistance, high-temperature resistance, and pathogen resistance in plants. Overexpression of maize (Zea mays) ZmNAC33 and ZmNAC77 in A. thaliana can improve the drought tolerance of transgenic A. thaliana.Citation12,Citation13 In rice (Oryza sativa), OsNAC041 mutants exhibited higher salt sensitivity,Citation14 and OsNAC2 overexpression inhibited the salt tolerance of transgenic O. sativa.Citation15 The ectopic expression of the CmNAC1 gene in Cucurbita moschata enhances the tolerance of transgenic A. thaliana to cold, salt, and drought stresses.Citation16 VvNAC17 gene overexpression in grape (Vitis vinifera L.) increased tolerance and the survival rate under freezing stress, increased the survival rate, and decreased the water loss rate under drought and dehydration stresses.Citation17 Overexpression of the drought tolerance gene HvNAC1 in barley (Hordeum vulgare) reduced the occurrence of Ramularia leaf spot symptoms and the colonization of R. collo-cygni fungi.Citation18 Furthermore, overexpression of Artemisia annua AaNAC1 in A. thaliana enhanced resistance to Botrytis cinerea and drought tolerance.Citation19
Since high-throughput sequencing technology was introduced in genomics research in 2005, an increasing number of plant genes have been sequenced, providing a platform for the analysis of gene families at the whole-genome level.Citation20 In recent years, NAC transcription factor families have been identified and analyzed in many species. Rice and A. thaliana contains 151 and 117 NAC genes, respectively.Citation21,Citation22 Based on the Z. mays genome sequence, 148 and 152 Z. mays NAC members have been identified, respectively.Citation23,Citation24 A total of 131 SbNAC genes have been identified in the sorghum genome,Citation25 108 DgNAC genes have been identified in the Dactylis glomerata genome,Citation26 and 132 AhNAC and 104 CaNAC genes have been identified in the cultivated peanut (Arachis hypogaea) and pepper (Capsicum annuum) genomes, respectively.Citation27,Citation28 Saccharum spontaneum L. is a wild relative of sugarcane. It is mainly distributed in tropical and subtropical regions between 8°S and 40°S. Because of its wide distribution, it can adapt to multiple adversities in nature and has been used for sugarcane crossbreeding since the 19th century. Currently, the vast majority of modern sugarcane cultivars contain S. spontaneum, the most important resource material for sugarcane resistance breeding.Citation29 However, no comprehensive systemic study of the NAC gene family in S. spontaneum has been conducted. In this study, we identified NAC gene family members in the S. spontaneum genome, constructed a phylogenetic tree for classification, further analyzed the characteristics of the gene structure and conserved motifs, and comprehensively analyzed gene replication events and collinearity. In addition, the tissue specificity of the SsNAC gene in the growth and development of S. spontaneum was analyzed. Finally, qRT–PCR was used to identify the differential expression patterns of 12 SsNAC genes under biotic and abiotic stresses and hormone induction. In summary, the results from this study provide comprehensive information on NAC genes in S. spontaneum, laying a foundation for in-depth studies of NAC gene function in S. spontaneum, and are expected to provide a source of candidate genes for molecular resistance breeding of sugarcane.
Materials and methods
Identification of NAC genes in S. spontaneum
The S. spontaneum genome was downloaded from the S. spontaneum AP85–441 genome database (http://www.life.illinois.edu/ming/downloads/Spontaneum_genome/),Citation30 the Arabidopsis thaliana NAC (AtNAC) family data were downloaded from The Arabidopsis Information Resource (TAIR) (www.Arabidopsis.org),Citation31 and the information for genes in the OsNAC family were downloaded from GenBank (http://www.ncbi.nlm.nih.gov).Citation32 Hidden Markov model (HMM) files for the NAC domain (PF01849) and the NAM domain (PF02365) were downloaded from Pfam (http://pfam.xfam.org/), and the hmmsearch command was used to query the NAC and NAM conserved domains in the genomic sequence of S. spontaneum. Duplicated SsNAC gene transcripts were removed. The conserved domain database (CDD, http://www.ncbi.nlm.nih.gov/cdd/) and the PFAM database (https://pfam.xfam.org) were used to confirm the obtained SsNAC genes, and sequences with the NAC or NAM domain were regarded as SsNAC genes and used in subsequent analyses.
Construction of the phylogenetic tree
The conserved domains of 115 SsNAC, 105 AtNAC, and seven OsNAC genes were used for evolutionary and phylogenetic analyses of the NAC gene family, and unrooted phylogenetic trees were generated using the neighbor-joining method in MEGA-X (https://www.megasoftware.net/). This method includes 1000 guided replications and paired detection.Citation33 SsNAC classification was determined based on the classification of the AtNAC and OsNAC gene families.Citation22
Analysis of protein characteristics, gene structure, and gene motifs
ExPASy (http://web.expasy.org/protparam/) was used to predict the physical and chemical characteristics of the SsNAC proteins. The subcellular localization of SsNAC protein was predicted using WoLF PSORT (https://wolfpsort.hgc.jp/). The structures of the SsNAC genes were determined using GSDS 2.0.Citation34 The default parameters were set using MEME tools (http://meme-suite.org/tools/meme) to identify the conserved motifs in the SsNAC protein, and the maximum number of conserved motifs was set to 10.Citation35
Chromosome localization, gene duplication, and collinearity analysis
Using the S. spontaneum genome annotations, Map Gene 2 Chrome (http://mg2c.iask.in/mg2c_v2.0/) was used to map SsNAC genes and conduct chromosome matching. Default parameters in MCScanX were used to detect SsNAC duplicate genes and collinear blocks.Citation36
Plant material and stress treatment
S. spontaneum clones were used as test materials. Drought treatment was applied as follows. Watering in the elongation period (5 months old) was stopped when the soil water content reached 17–20% (0 d), 12.5–15% (2 d), 10–12.5% (4 d), and 7.5–10% (6 d), which were defined as adequate water, mild drought, moderate drought, and severe drought, respectivelyCitation37 and +1 leaves were collected at these time points. Salt treatment was applied as follows. One liter of 150 mM NaCl was used to irrigate the seedlings (1-month-old). Low-temperature treatment was applied as follows. Clones at the 1-month-old of the seedling stage were placed in an incubator at 4°C, and +1 leaves were collected at 0 h, 3 h, 6 h, 12 h, and 24 h after the above treatment. Fusarium verticillioides treatment was applied as follows. An F. verticillioides spore suspension (1 × 10⁶ cells/mL) was inoculated into seedlings during the 1-month-old stage using a 1-mL syringe, and the leaf sheaths at the lower part of the inoculation site were collected at 0 h, 12 h, 24 h, and 48 h after inoculation. Hormone induction was conducted as follows. The leaves of 1-month-old seedlings were sprayed with 100 μM abscisic acid (ABA) and 100 μM methyl jasmonate (MeJA) until droplets were observed, and +1 leaves were collected at 0 h, 3 h, 6 h, 12 h, and 24 h later. Three independent biological replicates were set up for all treatments. The treated samples were immediately frozen in liquid nitrogen and stored at −80°C for subsequent analysis.
To investigate the expression patterns of SsNAC genes under different stresses and hormone treatments, we selected 12 SsNAC genes differentially expressed under drought stress according to RNA-seq data (Table S6) for further qRT–PCR analysis. Differentially expressed genes (DEGs) were defined by a log2|fold change| > 1 and a false discovery rate (FDR) < 0.05.
The expression patterns of SsNAC genes under different stress and hormone treatments
Total RNA was extracted using an OMEGA Plant RNA Kit (R6827-01) following the manufacturer’s protocol. Agarose gel electrophoresis was used to detect RNA integrity. RNA quality and quantification were assessed using a Thermo Fisher NanoDrop™ One/One c Microvolume UV–visible spectrophotometer. First-strand cDNA was synthesized from DNA-free RNA using a Star Script II First-strand cDNA Synthesis Kit with gDNA Remover (Gen Star) following the manufacturer’s protocol. Real-time fluorescence quantitative PCR was performed using an Applied Biosystems ABI 7500 instrument and SYBR Green, and GAPDH gene expression was used as an internal control. Primer 5.0 was used to design the primers (Table S1). The PCR system and procedures were performed in accordance with the 2 × Real Star Green Fast Mixture (with ROX II) (Gen Star) kit. Each reaction was performed three times, and the relative gene expression level was calculated using the 2−ΔΔCT method. Significance (P < 0.05) was calculated using the T-test.
Results
Identification and phylogenetic analysis of SsNAC genes
After searching using the HMM of the NAC domain and NAM domain and screening the CDD database and PFAM database, 115 SsNAC genes were identified in S. spontaneum. All SsNAC proteins have an NAC or NAM domain. The 115 SsNAC genes were named SsNAC 001 to SsNAC 115 according to the chromosome numbering of the S. spontaneum genome (Table S2).
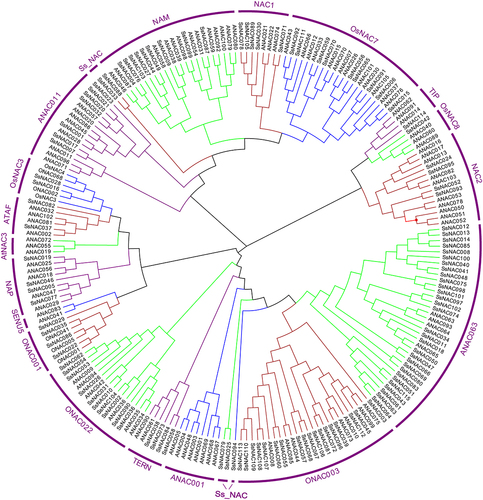
Phylogenetic analysis of NAC proteins in S. spontaneum, O. sativa, and A. thaliana was used to evaluate the evolutionary relationships among SsNAC proteins. Based on the branching and classification of the NAC gene family in O. sativa and A. thaliana, SsNAC proteins were divided into 18 subgroups. The ANAC063 subgroup contained the largest number of SsNAC proteins (30 proteins). The TIP subgroup contained only one SsNAC protein, and the other five SsNAC proteins were divided into specific subgroups and denoted Ss_NAC. No member of the SENU5 subgroup was identified in the SsNAC family ().
Figure 1. Phylogenetic analysis of NAC proteins in S. spontaneum, O. sativa, and A. thaliana. Clustal W was used to align the protein sequences, and phylogenetic trees were generated using the neighbor-joining method in MEGA-X; bootstrapping was repeated 1000 times.
Analysis of the characteristics and structure of SsNAC proteins
The analysis of the physicochemical properties of SsNAC proteins indicated that the length ranged from 159 to 3849 amino acids (aa), the molecular weight (MW) ranged from 17940.33 to 425609.23 Da, and the theoretical isoelectric point (pI) ranged from 4.56 to 10.31, with an average of 6.89. Seventy-one SsNAC proteins were acidic (pI < 7), and the predicted aliphatic amino acid indices ranged from 47.2 to 88.16. In the SsNAC family, 24 proteins were stable (instability index (II) < 40), and the rest were unstable. Fifty-six proteins were amphiphilic (grand average of hydropathicity index (GRAVY) = −0.5 to +0.5), and the remaining 59 SsNAC proteins were hydrophilic. The prediction of subcellular localization suggested that all SsNAC proteins were located in the nuclear region (Table S3).
Gene structure analysis (Figure S1B) indicated that the distribution of introns in SsNAC genes was diverse and that the number of introns ranged from 0 to 51, mainly with one to three introns. Forty-one SsNAC genes contained two introns, accounting for 35.6% of the genes identified, and nine SsNAC genes contained more than 10 introns; eight SsNAC genes had no introns. Therefore, the structure of SsNAC genes is very diverse.
Conserved motifs were used to analyze the structural characteristics of SsNAC proteins. As shown in Figure S1C, a total of 10 conserved motifs (motifs 1–10) were identified in all the SsNAC protein sequences using MEME, where motifs 2, 5, 9, 6, and 7 represent subdomains A, B, C, D, and E, respectively (Table S4). Most of the SsNAC proteins contained seven conserved motifs (motifs 1, 2, 3, 5, 6, 7, and 9), and the SsNAC proteins in the same group had similar motif compositions and positions. These results indicate that NAC family members in the same branch may have similar biological functions.
In summary, SsNAC family members in the same group on the phylogenetic tree have similar exon–intron gene structures and conserved motifs, further supporting the reliability of the classification.
SsNAC gene chromosome localization, gene replication, and collinearity analysis
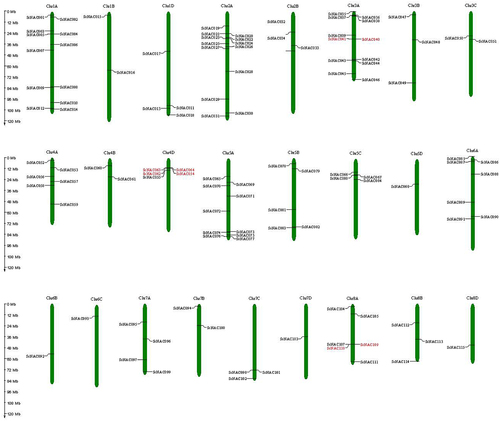
All SsNAC genes were unevenly distributed among the 25 chromosomes of S. spontaneum, and chromosome 2 (Chr2A) contained the largest number of SsNAC genes (13 genes), followed by chromosome 1 (Chr1A, 12 genes), chromosome 3 (Chr3A, 12 genes), and chromosome 5 (Chr5A, 10 genes) ().
Figure 2. The chromosome locations of SsNAC gene family members. Red indicates tandem-duplicated genes.
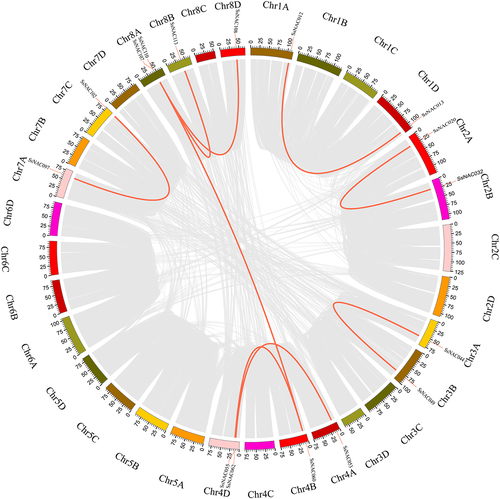
Collinearity analysis was performed using MCScanX software to identify duplicate SsNAC events. Nine pairs of segmental-duplicated genes and four groups of tandem-duplicated genes were identified (; ). Some SsNAC genes were generated by gene duplication, and segmental duplication events promoted the evolution of the NAC family.
Figure 3. Gene duplication events in the SsNAC gene family. The gray line represents the collinear region in the S. spontaneum genome, and the red line represents duplicated SsNAC gene pairs.
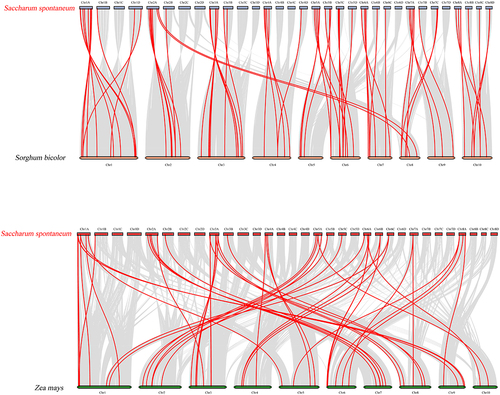
To further infer the phylogenetic mechanisms of SsNAC family members, we constructed a comparative alignment diagram of S. spontaneum with Sorghum bicolor and Zea mays. The SsNAC gene is highly homologous to the NAC genes of S. bicolor and Z. mays and exhibits collinearity and conservation. In S. bicolor, 69 homologous gene pairs were distributed on all chromosomes, and 49 homologous gene pairs in Z. mays were distributed on all chromosomes, 34 of which were shared by S. spontaneum, S. bicolor, and Z. mays ().
Figure 4. Collinearity analysis among S. spontaneum, S. bicolor, and Z. mays. The gray line represents collinear regions within the genome, and the red line represents collinear NAC gene pairs.
The expression patterns of SsNAC genes during the growth and development of different tissues
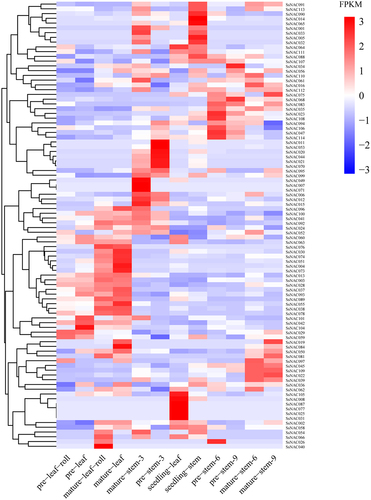
The RNA-seq data in the SGD database (http://sugarcane.zhangjisenlab.cn/sgd/html/mRNA.html) were used to analyze the expression patterns of SsNAC genes at different developmental stages of stems and leaves of S. spontaneum (Table S5). Thirty-six SsNAC genes were commonly expressed during the development of stems and leaves of S. spontaneum. SsNAC094 expression was high, suggesting that this gene plays an important role in the growth and development of S. spontaneum. Fifty-eight SsNAC genes were highly expressed during certain developmental periods of the stem and leaves, with low or no expression during some developmental periods. In addition, 21 SsNAC genes were not expressed at all stages of stem and leaf development (), indicating that SsNAC gene expression has tissue and time specificity.
Figure 5. The expression patterns of SsNAC genes in different tissues during the growth and development of S. spontaneum. Pre-leaf-roll represents immature leaf rolls, pre-leaf represents immature leaves, mature-leaf-roll represents mature leaf rolls, mature-leaf represents mature leaves, mature-stem-3 represents the third segment of mature stems, pre-stem-3 represents the third segment of immature stems, seedling-leaf represents seedling leaves, seedling-stem represents the seedling stem segment, pre-stem-6 represents the sixth segment of immature stems, pre-stem-9 represents the ninth segment of immature stems, mature-stem-6 represents the sixth segment of mature stems, and mature-stem-9 represents the ninth segment of mature stems. Hierarchical cluster analysis was performed using FPKM values to generate heatmaps. The scale represents the relative signal intensity of the FPKM value.
The expression patterns of SsNAC genes
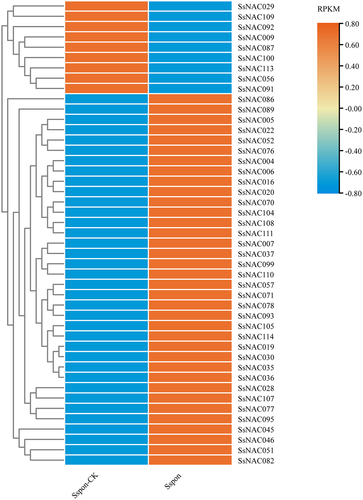
To analyze the response patterns of SsNAC genes under different biotic and abiotic stresses and the transcriptional expression characteristics of SsNAC genes under hormone induction, we selected SsNAC005, SsNAC016, SsNAC020, SsNAC028, SsNAC030, SsNAC037, SsNAC052, SsNAC077, SsNAC095, SsNAC107, SsNAC110, and SsNAC111 to conduct qRT–PCR ().
Figure 6. Expression patterns of SsNAC genes at the transcriptional level in response to drought stress. A heat map shows the relative expression of SsNAC genes at 0 d (Sspon-CK) and 7 d (Sspon) of drought stress. Analysis of RNA-seq data showed 45 differentially expressed SsNAC genes that exhibited either increased or decreased expression under drought stress. Red indicates a high expression level, and blue indicates a low expression level.
Under drought treatment, the expression levels of 12 SsNAC genes were upregulated with prolonged drought treatment. The SsNAC005, SsNAC016, SsNAC028, SsNAC030, SsNAC037, SsNAC052, SsNAC077, and SsNAC095 genes reached their peak expression levels at 6 d, and these levels were 3.26, 4.21, 5.88, 8.47, 4.13, 5.73, 4.36, and 4.88 times higher than those in the control condition (0 d), respectively (), indicating that these SsNAC genes exhibit drought stress-induced upregulation.
Figure 7. Expression profiles of SsNAC genes in S. spontaneum under drought treatment. Data represent the mean (± standard deviation (SD)) of three independent replicates. The bars represent the standard error of the mean. Asterisks indicate that the expression of the target gene was significantly upregulated or downregulated under different treatments (* P < 0.05, ** P < 0.01, Student’s t-test).
As shown in , SsNAC005, SsNAC028, SsNAC030, SsNAC052, SsNAC077, SsNAC095, SsNAC107, and SsNAC110 gene expression levels were rapidly upregulated at the early stage of low-temperature treatment (3 h). Additionally, the expression levels were significantly higher than those in the control condition (0 h) at the low-temperature treatment stage. In particular, at 3 h, the SsNAC077 gene expression level was 131.41 times higher than that at 0 h. Seven genes reached the highest expression level in the late stage of low-temperature treatment (24 h), showing significant or highly significant differences relative to the control (0 h). These SsNAC genes are more sensitive to low-temperature stress, and it is speculated that they may be specific factors in the signaling pathway of the low-temperature stress response in S. spontaneum.
Figure 8. Expression profiles of SsNAC genes in S. spontaneum under cold treatment. Data represent the mean (± standard deviation (SD)) of three independent replicates. The bars represent the standard error of the mean. Asterisks indicate that the expression of the target gene was significantly upregulated or downregulated under different treatments (* P < 0.05, ** P < 0.01, Student’s t-test).
The expression levels of the SsNAC016, SsNAC020, SsNAC028, SsNAC030, SsNAC037, SsNAC077, and SsNAC095 genes decreased between 3 h and 6 h in the early stage of salt stress. However, only expression of the SsNAC030 and SsNAC095 genes increased again in the late stage of salt stress (). After salt treatment, some SsNAC genes showed a consistent expression response, with low expression at 24 h compared to the control (0 h).
Figure 9. Expression profiles of SsNAC genes in S. spontaneum under salt treatment. Data represent the mean (± standard deviation (SD)) of three independent replicates. The bars represent the standard error of the mean. Asterisks indicate that the expression of the target gene was significantly upregulated or downregulated under different treatments (* P < 0.05, ** P < 0.01, Student’s t-test).
Most of the SsNAC gene expression levels were rapidly downregulated at the early stage of pathogenic fungi treatment (12 h). After 24 h of infection with a pathogenic fungus, some SsNAC genes (SsNAC005, SsNAC020, and SsNAC030) exhibited increased expression followed by a decrease in expression. However, other SsNAC genes (SsNAC037, SsNAC077, SsNAC095, SsNAC107, and SsNAC110) trended toward decreased expression followed by an increase in expression (). Therefore, SsNAC genes showed two different patterns in response to pathogenic fungal stress.
Figure 10. Expression profiles of SsNAC genes in S. spontaneum under pathogenic fungi treatment. Data represent the mean (± standard deviation (SD)) of three independent replicates. The bars represent the standard error of the mean. Asterisks indicate that the expression of the target gene was significantly upregulated or downregulated under different treatments (* P < 0.05, ** P < 0.01, Student’s t-test).
Most SsNAC genes (SsNAC016, SsNAC020, SsNAC030, SsNAC037, SsNAC107, SsNAC110, and SsNAC111) exhibited increased expression between 3 h and 12 h after induction by exogenous ABA, with peak expression levels at 12 h or 24 h (). However, after exogenous MeJA induction, only the SsNAC03 and SsNAC110 genes showed the same expression pattern as after ABA induction, and the expression levels of the remaining SsNAC genes were lower than those of the control at all stages ().
Figure 11. Expression profiles of SsNAC genes in S. spontaneum under ABA treatment. Data represent the mean (± standard deviation (SD)) of three independent replicates. The bars represent the standard error of the mean. Asterisks indicate that the expression of the target gene was significantly upregulated or downregulated under different treatments (* P < 0.05, ** P < 0.01, Student’s t-test).
Figure 12. Expression profiles of SsNAC genes in S. spontaneum under MeJA treatment. Data represent the mean (± standard deviation (SD)) of three independent replicates. The bars represent the standard error of the mean. Asterisks indicate that the expression of the target gene was significantly upregulated or downregulated under different treatments (* P < 0.05, ** P < 0.01, Student’s t-test).
In conclusion, although the intensity of the response of each gene to adverse stress conditions and hormone treatment varied, most SsNAC genes responded to drought, low-temperature, salt, and pathogenic fungal stresses and could be induced or repressed by ABA and MeJA.
Discussion
NAC genes play important roles in plant life activities and responses by plants to biotic and abiotic stresses.Citation38 Whole-genome analysis of the NAC gene family has been conducted in species that have been sequenced, including O. sativa,Citation22 Z. mays,Citation23,24 S. bicolor,Citation25 Triticum aestivum L.,Citation39 Musa acuminata,Citation40 Vaccinium corymbosum L.,Citation41 Juglans mandshurica,Citation42 Cleistogenes songorica, and Coffea canephora.Citation43,Citation44 The identification and analysis of S. spontaneum NAC gene families at the whole-genome level have not been reported. Therefore, the purpose of this study was to study the characteristics of SsNAC genes at the genomic level and to provide a reference for further analysis of the potential function of NAC genes.
In this study, 115 members were identified by searching for NAC genes in the S. spontaneum genome. Similar to other Gramineae crops, numerous NAC family members were evident, but fewer NAC genes than in S. bicolor (188) and Z. mays (189) were observed. Notably, the S. spontaneum genome used in this study was derived from the haploid AP85–441 (1 n = 4x = 32) produced by the cultivation of octoploid SES208. Therefore, octoploid S. spontaneum may contain more than 115 SsNAC genes. In genetic evolution and phenotypic evolution, gene duplication plays a crucial role in gene expansion and functional diversification. Homologous genes are generated through tandem duplication and segmental duplication, increasing the total number of genes.Citation45 The collinearity analysis of the SsNAC genes in this study revealed nine pairs of segmental-duplicated genes and four groups of tandem-duplicated genes, indicating that the expansion of the SsNAC gene family may be related to these duplication events. S. spontaneum has been reported to have undergone two whole-genome duplication (WGD) events, and its homologous chromosomes were duplicated from one to two and then to four.Citation30 SsNAC gene duplication is speculated to have occurred during these two WGD events.
SsNAC family proteins exhibit significant differences in their characteristics. Similarly, the SsNAC family has a very diversified gene structure, but SsNAC genes in the same subfamily have relatively conserved gene structures and protein motifs, which lays the foundation for further analyses of their biological functions. Phylogenetic analysis divided SsNAC family members into 18 subgroups. The distribution of SsNAC family members among the subfamilies was uneven, and some subfamilies did not have a wide distribution of SsNAC family members, indicating that the NAC gene family diverged after the differentiation of S. spontaneum and A. thaliana during evolutionary processes. The analysis of the conserved motifs of NAC proteins further confirmed the classification of SsNAC family members. The motifs at the N-terminus of NAC genes are highly conserved and are usually associated with protein interactions, transcriptional activity, and DNA binding ability,Citation46 indicating that these conserved motifs are very important for the function of NAC genes.
NAC transcription factors play a key role in the regulation of plant growth and development. For example, during cell division in A. thaliana, a membrane-bound NAC transcription factor, NTM1, is activated by proteolytic cleavage and mediates cytokinin signal transduction;Citation47 additionally, AtNAC1 and AtNAC2 participate in lateral root development by downregulating auxin signaling.Citation48 In addition, NST1 and NST3 are involved in the biosynthesis of the secondary wall in A. thaliana, including the production of lignin and interfascicular fibers and pod shattering.Citation49–51 Similarly, Gossypium spp GhFSN1 participates in fiber development by activating downstream secondary cell wall-related genes.Citation52 The SsNAC094 gene, which was highly expressed at different stages of the growth and development of the stems and leaves of S. spontaneum, is a member of the Ss_NAC subgroup, and this gene should be investigated as a key regulator of the growth and development of S. spontaneum.
Due to its remarkably high resistance and stress tolerance, S. spontaneum is recognized as a key source of stress resistance genes, and modern sugarcane cultivars all contain S. spontaneum.Citation53 In plants, studies on NAC gene regulation in response to drought, salinity, low-temperature, high-temperature, heavy metals, disease, and other stresses have been published.Citation54–59 However, few reports about SsNAC genes involved in responses to biotic and abiotic stresses are available. Therefore, this study further analyzed the expression patterns and potential functions of 12 SsNAC genes in response to various biotic and abiotic stresses. As determined by qRT–PCR, the 12 SsNAC genes showed varying degrees of response to drought, salinity, low-temperature, and pathogenic stresses. In particular, the same treatment simultaneously induced the expression of multiple SsNAC genes. For example, drought stress induced the simultaneous significant upregulation of the expression of the 12 genes studied, a finding that was also reflected in the RNA-seq data, indicating the reliability of the RNA-seq data. The study further showed that the expression of seven genes, SsNAC016, SsNAC020, SsNAC028, SsNAC030, SsNAC037, SsNAC077, and SsNAC110, changed significantly in response to salt and low-temperature stresses, indicating that these SsNAC transcription factors had a single-cause pleiotropic effect, a finding that has been confirmed in O. sativa,Citation21 Z. mays,Citation60 A. hypogaea,Citation61 and C. annuum.Citation28 The qRT–PCR results showed that the expression of SsNAC005 was highly induced by at least one stress factor, therefore, SsNAC005 can be used as a candidate gene for further studies on sugarcane stress. The expression levels of the 12 SsNAC genes after ABA and MeJA treatment varied. Therefore, NAC genes may play important roles in the adaptation and resistance of S. spontaneum to various environmental stresses.
Conclusions
In this study, whole-genome analysis was performed on the SsNAC gene family, and 115 SsNAC genes were identified. A phylogenetic tree analysis divided the SsNAC gene family into 18 groups, and the gene structures and protein motifs within the same group were similar. Evolutionary analysis indicated that segmental duplication and tandem duplication were the main evolutionary mechanisms contributing to the expansion of the NAC gene family. In addition, SsNAC genes had different expression patterns during different developmental stages of S. spontaneum. qRT–PCR analysis revealed that the expression patterns of SsNAC genes could be induced or repressed by ABA and MeJA, but that the expression patterns under biotic and abiotic stresses were different. In summary, these results provide a basis for further studies on the function of SsNAC genes and provide a theoretical basis for genetic improvements in sugarcane resistance to stresses.
Author contribution statement
QQS and FSL conceived and designed the experiments. QQS, XTZ, and SJG performed the bioinformatic analysis and data processing. XBR, RQZ, and SZL performed the stress tolerance assays and qRT–PCR analysis. QQS drafted the manuscript. ZFQ and TJW revised the manuscript. LLH and FSL provided the funding. All authors have read and approved the manuscript and agree to its publication.
Supplemental Material
Download Zip (986.2 KB)Disclosure statement
No potential conflict of interest was reported by the author(s).
Supplementary material
Supplemental data for this article can be accessed online at https://doi.org/10.1080/15592324.2022.2088665
Correction Statement
This article has been corrected with minor changes. These changes do not impact the academic content of the article.
Additional information
Funding
Related Research Data
References
- Souer E, Houwelingen AV, Kloos D, Mol J, Koes R. The no apical meristem gene of petunia is required for pattern formation in embryos and flowers and is expressed at meristem and primordia boundaries. Cell. 1996;85(2):159–16. doi:10.1016/S0092-8674(00)81093-4
- Aida M, Ishida T, Fukaki H, Fujisawa H, Tasaka M. Genes involved in organ separation in Arabidopsis: an analysis of the cup-shaped cotyledon mutant. Plant Cell. 1997;9(6):841–857. doi:10.1105/tpc.9.6.841.
- Kikuchi K, Ueguchi-Tanaka M, Yoshida KT, Nagato Y, Matsusoka M, Hirano HY. Molecular analysis of the NAC gene family in rice. Mol Gen Genet. 2000;262(6):1047–1051. doi:10.1038/s41380-021-01104-2.
- Olsen NA, Ernst HA, Leggio LL, Skriver K. NAC transcription factors: structurally distinct, functionally diverse. Trends Plant Sci. 2005;10(2):79–87. doi:10.1016/j.tplants.2004.12.010.
- Hibara KI, Takada S, Tasaka M. CUC1 gene activates the expression of SAM-related genes to induce adventitious shoot formation. Plant J. 2003;36(5):687–696. doi:10.1046/j.1365-313X.2003.01911.x.
- Mallory AC, Dugas DV, Bartel DP, Bartel B. MicroRNA regulation of NAC-domain targets is required for proper formation and separation of adjacent embryonic, vegetative, and floral organs. Curr Biol. 2004;14(12):1035–1046. doi:10.1016/j.cub.2004.06.022.
- Hendelman A, Stav R, Zemach H, Arazi T. The tomato NAC transcription factor SlNAM2 is involved in flower-boundary morphogenesis. J Exp Bot. 2013;64:5497–5507. doi:10.1093/jxb/ert324.
- Ma XM, Zhang YJ, Turečková V, Xue GP, Fernie AR, Mueller-Roeber B, Balazadeh S. The NAC transcription factor SlNAP2 regulates leaf senescence and fruit yield in tomato. Plant Physiol. 2018;177(3):1286–1302. doi:10.1104/pp.18.00292.
- Uauy C, Distelfeld A, Fahima T, Blechl A, Dubcovsky J. ANAC gene regulating senescence improves grain protein, zinc, and iron content in wheat. Science. 2006;314(5803):1298–1301. doi:10.1126/science.1133649.
- Nuruzzaman M, Sharoni AM, Kikuchi S. Roles of NAC transcription factors in the regulation of biotic and abiotic stress responses in plants. Front Microbiol. 2013;4:248. doi:10.3389/fmicb.2013.00248.
- Karanja BK, Xu L, Wang Y, Muleke EM, Jabir BM, Xie Y, Zhu XW, Cheng WW, Liu LW. Genome-wide characterization and expression profiling of NAC transcription factor genes under abiotic stresses in radish (Raphanus sativus L.). Peer J. 2017:5:e4172. doi:10.7717/peerj.4172.
- Liu WP, Zhao B-GW, Chao Q, Wang BC, Zhang Q, Zhang CX, Li SF, Jin FX, Yang DG, Li XH. Function analysis of ZmNAC33, a positive regulator in drought stress response in Arabidopsis. Plant Physiol Bioch. 2019;145:174–183. doi:10.1016/j.plaphy.2019.10.038.
- Mao HD, Yu LJ, Han R, Li ZJ, Liu H. ZmNAC55 a maize stress-responsive NAC transcription factor, confers drought resistance in transgenic Arabidopsis. Plant Physiol Bioch. 2016;105:55–66. doi:10.1016/j.plaphy.2016.04.018.
- Wang B, Zhong ZH, Zhang HH, Wang X, Liu BL, Yang LJ, Han XY, Yu DS, Zheng XL, Wang CG, et al. Targeted mutagenesis of NAC transcription factor gene, OsNAC041, leading to salt sensitivity in rice. Rice Sci. 2019;26(2):98–108. doi:10.1016/j.rsci.2018.12.005.
- Shen JB, Lv B, Luo LQ, He JM, Mao CJ, Xi DD, The MF. NAC-type transcription factor OsNAC2 regulates ABA-dependent genes and abiotic stress tolerance in rice. Sci Rep. 2017;7(1):40641. doi:10.1038/srep40641.
- Cao HS, Wang L, Nawaz MA, Niu ML, Sun JY, Xie JJ, Kong QS, Huang Y, Cheng F, Bie ZL. Ectopic expression of pumpkin NAC transcription factor CmNAC1 improves multiple abiotic stress tolerance in Arabidopsis. Front Plant Sci. 2017;8:2052. doi:10.3389/fpls.2017.02052.
- Ju YL, Yue XF, Min Z, Wang XH, Fang YL, Zhang JX. VvNAC17, a novel stress-responsive grapevine (Vitis vinifera L.) NAC transcription factor, increases sensitivity to abscisic acid and enhances salinity, freezing, and drought tolerance in transgenic Arabidopsis. Plant Physiol Bioch. 2020;146:98–111. doi:10.1016/j.plaphy.2019.11.002.
- McGrann GRD, Steed A, Burt C, Goddard R, Lachaux C, Bansal A, Corbitt M, Gorniak K, Nicholson P, Brown JKM. Contribution of the drought tolerance-related stress-responsive NAC 1 transcription factor to resistance of barley to Ramularia leaf spot. Mol Plant Pathol. 2015;16(2):201–209. doi:10.1111/mpp.12173.
- Lv ZY, Wang S, Zhang FY, Chen LX, Hao XL, Pan QF, Fu XQ, Li L, Sun XF, Tang KX. Overexpression of a novel NAC domain-containing transcription factor gene (AaNAC1) enhances the content of artemisinin and increases tolerance to drought and botrytis cinerea in Artemisia annua. Plant Cell Physiol. 2016;57(9):1961–1971. doi:10.1093/pcp/pcw118.
- Mardis ER. Next-generation DNA sequencing methods. Annu Rev Genom Hum G. 2008;9(1):387–402. doi:10.1146/annurev.genom.9.081307.164359.
- Nuruzzaman M, Manimekalai R, Sharoni AM, Satoh K, Kondoh H, Ooka H, Kikuchi S. Genome-wide analysis of NAC transcription factor family in rice. Gene. 2010;456(1–2):30–44. doi:10.1016/j.gene.2010.06.008.
- Ooka H, Satoh K, Doi K, Nagata T, Otomo Y, Murakami K, Matsubara K, Osato N, Kawai J, Carninci P, et al. Comprehensive analysis of NAC family genes in Oryza sativa and Arabidopsis thaliana. DNA Res. 2003;10(6):239–247. doi:10.1093/dnares/10.6.239.
- Shiriga K, Sharma R, Kumar K, Yadav SK, Hossain F, Thirunavukkarasu N. Genome-wide identification and expression pattern of drought responsive members of the NAC family in maize. Meta Gene. 2014;2:407–417. doi:10.1007/s00344-019-09984-z.
- Peng XJ, Zhao Y, Li XM, Wu M, Chai WB, Sheng L, Wang Y, Dong Q, Jiang HY, Cheng BJ. Genomewide identification, classification and analysis of NAC type gene family in maize. J Genet. 2015;94(3):377. doi:10.1007/s12041-015-0526-9.
- Sanjari S, Shirzadian-Khorramabad R, Shobbar ZS, Shahbazi M. Systematic analysis of NAC transcription factors’ gene family and identification of post-flowering drought stress responsive members in sorghum. Plant Cell Rep. 2019;38(3):361–376. doi:10.1007/s00299-019-02371-8.
- Yang ZF, Nie G, Feng GY, Han JT, Huang LK, Zhang XQ. Genome-wide identification, characterization, and expression analysis of the NAC transcription factor family in orchardgrass (Dactylis glomerata L.). BMC Genomics. 2021;22(1):178. doi:10.1186/s12864-021-07485-6.
- Li PX, Peng ZY, Xu PL, Tang GY, Ma CL, Zhu JQ, Shan L, Wan SB. Genome-wide identification of NAC transcription factors and their functional prediction of abiotic stress response in peanut. Front Genet. 2021;12:630292. doi:10.3389/fgene.2021.630292.
- Diao WP, Snyder JC, Wang SB, Liu JB, Pan BG, Guo GJ, Ge W, Dawood MHSA. Genome-wide analyses of the NAC transcription factor gene family in pepper (Capsicum annuum L.): Chromosome location, phylogeny, structure, expression patterns, Cis-Elements in the promoter, and interaction network. Int J Mol Sci. 2018;19(4):1028. doi:10.3390/ijms19041028.
- D’ Hont A, Grivet L, Feldmann P, Glaszmann JC, Rao S, Berding N. Characterisation of the double genome structure of modern sugarcane cultivars (Saccharum spp.) by molecular cytogenetics. Mol Gen Genet. 1996;250(4):405–413. doi:10.1007/BF02174028.
- Zhang JS, Zhang XT, Tang HB, Zhang Q, Hua XT, Ma XK, Zhu F, Jones T, Zhu XG, Bowers J, et al. Allele-defined genome of the autopolyploid sugarcane Saccharum spontaneum L. Nat Genet. 2018;50(11):1565–1573. doi:10.1038/s41588-018-0237-2.
- Rhee SY. The Arabidopsis information resource (TAIR): a model organism database providing a centralized, curated gateway to Arabidopsis biology, research materials and community. Nucleic Acids Res. 2003;31(1):224–228. doi:10.1093/nar/gkg076.
- Benson DA, Boguski MS, Lipman DJ, Ostell J, Francis Ouellette BF. GenBank. Nucleic Acids Res. 1997;26(1):1–6. doi:10.1093/nar/26.1.1.
- Kumar S, Stecher G, Li M, Knyaz C, Tamura K. MEGA X: molecular evolutionary genetics analysis across computing platforms. Mol Biol Evol. 2018;35(6):1547–1549. doi:10.1093/molbev/msy096.
- Hu B, Jin JP, Guo AY, Zhang H, Luo JC, Gao G. GSDS 2.0: An upgraded gene feature visualization server. Bioinformatics. 2015;31(8):1296–1297. doi:10.1093/bioinformatics/btu817.
- Bailey TL, Boden M, Buske FA, Frith M, Grant CE, Clementi L, Ren J, Li WW, Noble WS . MEME SUITE: Tools for motif discovery and searching. Nucleic Acids Res. 2009;37(Web Server):W202–W208. doi:10.1093/nar/gkp335.
- Wang YP, Tang HB, Debarry JD, Tan X, Li JP, Wang XY, Lee T-h, Jin HZ, Marler B, Guo H ,et al. MCScanX: a toolkit for detection and evolutionary analysis of gene synteny and collinearity. Nucleic Acids Res. 2012;40(7):e49 . doi:10.1093/nar/gkr1293.
- Du CZ. Physiological and molecular mechanisms of drought resistance of different sugarcane varieties. Nanning, China: Guangxi University; 2018.
- Puranik S, Sahu PP, Srivastava PS, Prasad M. NAC proteins: regulation and role in stress tolerance. Trends Plant Sci. 2012;17(6):369–381. doi:10.1016/j.tplants.2012.02.004.
- Ma JH, Yuan M, Sun B, Zhang DJ, Zhang J, Li CX, Shao Y, Liu W, Jiang LN. Evolutionary divergence and biased expression of NAC transcription factors in hexaploid bread wheat (Triticum aestivum L.). Plants. 2021;10(2):382. doi:10.3390/plants10020382.
- Li B, Fan RY, Yang QS, Hu CH, Sheng O, Deng GM, Dong T, Li CY, Peng XX, Bi FC, et al. Genome-wide identification and characterization of the NAC transcription factor family in Musa Acuminata and expression analysis during fruit ripening. Int J Mol Sci. 2020;21(2):634. doi:10.1016/j.plaphy.2020.10.009.
- Liang KH, Wang AB, Sun YJ, Yu MX, Zhang LY. Identification and expression of NAC transcription factors of Vaccinium corymbosum L. in response to drought stress. Forests. 2019;10(12):1088. doi:10.3390/f10121088.
- Li X, Cai KW, Pei XN, Li Y, Hu YB, Meng FJ, Song XS, Tigabu M, Ding CJ, Zhao XY. Genome-wide identification of NAC transcription factor family in Juglans mandshurica and their expression analysis during the fruit development and ripening. Int J Mol Sci. 2021;22(22):12414. doi:10.3390/ijms222212414.
- Zong XF, Yan Q, Wu F, Ma Q, Zhang JY. Genome-wide analysis of the role of NAC family in flower development and abiotic stress responses in Cleistogenes songorica. Genes. 2020;11(8):927. doi:10.3390/genes11080927.
- Dong XS, Jiang Y, Yang YN, Xiao ZW, Bai XH, Gao J, Tan SR, Hur YK, Hao SM, He FF. Identification and expression analysis of the NAC gene family in Coffea canephora. Agronomy. 2019;9(11):670. doi:10.3390/agronomy9110670.
- Flagel LE, Wendel JF. Gene duplication and evolutionary novelty in plants. New Phytol. 2009;183(3):557–564. doi:10.1186/s13059-019-1650-2.
- Liu MY, Ma ZT, Sun WJ, Huang L, Wu Q, Tang ZZ, Bu TL, Li CL, Chen H. Genome-wide analysis of the NAC transcription factor family in Tartary buckwheat (Fagopyrum tataricum). BMC Genomics. 2019;20(1):113. doi:10.1186/s12864-019-5500-0.
- Kim YS, Kim SG, Park JE, Park HY, Lim MH, Chua NH, Park CM. A membrane-bound NAC transcription factor regulates cell division in Arabidopsis. Plant Cell. 2006;18(11):3132–3144. doi:10.1105/tpc.106.043018.
- Guo HS, Xie Q, Fei JF, Chua NH. MicroRNA directs mRNA cleavage of the transcription factor NAC1 to downregulate auxin signals for Arabidopsis lateral root development. Plant Cell. 2005;17(5):1376–1386. doi:10.1105/tpc.105.030841.
- Zhong R, Richardson EA, Ye ZH. Two NAC domain transcription factors, SND1 and NST1, function redundantly in regulation of secondary wall synthesis in fibers of Arabidopsis. Planta. 2007;225(6):1603–1611. doi:10.1007/s00425-007-0498-y.
- Mitsuda N, Iwase A, Yamamoto H, Yoshida M, Seki M, Shinozaki K, Ohme-Takagi M. NAC transcription factors, NST1 and NST3, are key regulators of the formation of secondary walls in woody tissues of Arabidopsis. Plant Cell. 2007;19(1):270–280. doi:10.1105/tpc.106.047043.
- Mitsuda N, Ohme-Takagi M. NAC transcription factors NST1 and NST3 regulate pod shattering in a partially redundant manner by promoting secondary wall formation after the establishment of tissue identity. Plant J. 2008;56(5):768–778. doi:10.1111/j.1365-313X.2008.03633.x.
- Zhang J, Huang GQ, Zou D, Yan JQ, Li Y, Hu S, Li XB. The cotton (Gossypium hirsutum) NAC transcription factor (FSN1) as a positive regulator participates in controlling secondary cell wall biosynthesis and modification of fibers. New Phytol. 2018;217(2):625–640. doi:10.1111/nph.14864.
- Chen RK. 2011. Theory and practice of modern sugarcane breeding. Beijing: China Agricultural Press.
- Liang JH, Zheng J, Wu Z, Wang HQ. Strawberry FaNAC2 enhances tolerance to abiotic stress by regulating proline metabolism. Plants. 2020;9(11):1417. doi:10.3390/plants9111417.
- Zhang XM, Cheng ZH, Yao WJ, Zhao K, Wang XY, Jiang TB. Functional characterization of PsnNAC036 under salinity and high temperature stresses. Int J Mol Sci. 2021;22(5):2656. doi:10.3390/genes9100494.
- Zhuo XK, Zheng TC, Zhang ZY, Zhang YC, Jiang LB, Ahmad S, Sun LD, Wang J, Cheng TR, Zhang QX. Genome-wide analysis of the NAC transcription factor gene family reveals differential expression patterns and cold-stress responses in the woody plant Prunusmume. Genes. 2018;9(10):494. doi:10.3390/genes9100494.
- Hu XL, Xie FF, Liang WW, Liang YH, Zhang ZK, Zhao JT, Hu GB, Qin YH. HuNAC20 and HuNAC25, two novel NAC genes from Pitaya, confer cold tolerance in transgenic Arabidopsis. Int J Mol Sci. 2022;23(4):2189. doi:10.3390/ijms23042189.
- Hu SB, Shinwari KI, Song YXR, Xia JX, Xu H, Du BB, Luo L, Zheng LQ. OsNAC300 positively regulates cadmium stress responses and tolerance in rice roots. Agronomy. 2021;11(1):95. doi:10.3390/agronomy11010095.
- Xu Y, Zou SH, Zeng H, Wang W, Wang B, Wang H, Tang DZ. A NAC transcription factor TuNAC69 contributes to ANK-NLR-WRKY NLR-mediated stripe rust resistance in the diploid wheat Triticum urartu. Int J Mol Sci. 2022;23(1):564. doi:10.3390/ijms23010564.
- Lu M, Sun QP, Zhang DF, Wang TY, Pan JB. Identification of 7 stress-related NAC transcription factor members in maize (Zea mays L.) and characterization of the expression pattern of these genes. Biochem Bioph Res Co. 2015;462(2):144–150. doi:10.1016/j.bbrc.2015.04.113.
- Yuan CL, Li CJ, Lu XD, Zhao XB, Yan CX, Wang J, Sun QX, Shan SH. Comprehensive genomic characterization of NAC transcription factor family and their response to salt and drought stress in peanut. BMC Plant Biol. 2020;20(1):454. doi:10.1186/s12870-020-02678-9.