
ABSTRACT
Microspore transfers the developmental fate into embryogenesis in vitro regulated by determinant factors of stress-induced. However, the key regulators of microspore embryogenesis (ME) are still largely undiscovered to reveal the mechanism of cell fate transition. Here, we report that Phospholipase C (PLC) is involved at the early stages of ME in Nicotiana tabacum. NtPLC2/3/4 are expressed at the initial stages of ME. The expression levels of NtPLC2/3 are transient activated after 3 days in culture, while the expression level of NtPLC4 maintains relatively stable. Inhibition of PLCs induces the decrease in NtPLC2/3/4 expression level and decline of ME yield. We confirm that lipids in microspore are degraded and then re-accumulate at first embryonic division stage. Inhibition of PLCs suppresses the lipids metabolism at the early stages of ME. Thus, we propose that PLCs-mediated lipid metabolism is a novel regulator at the early stages of ME.
Introduction
Microspores can be reprogrammed by stress treatment in vitro to shift from gametophytic development toward a sporophytic pathway, a process known as androgenesis,Citation1 or microspore embryogenesis (ME). It has been extensively exploited in plant-breeding programs to increase the speed and efficiency with which homozygous lines can be obtained.Citation1 Due to the advantages of convenient access to materials and easy operation, ME has been exploited for planting breedingCitation2 and as a model of studying cell fate transitionCitation3 in recent decades. Usually, microspores required to induce embryogenic growth are the application of stress treatment like osmotic, temperature, or nutrient stress, either alone or in combination.Citation4 Although several regulators of ME have been found in previous researches, such as chromatin regulation,Citation5 small RNA,Citation6 calcium signaling,Citation7 and hormones,Citation8 the mechanism underlying the decision in microspore cell fate is still largely unknown, and the signaling pathways activated by stress-induced need to be further explored.
Phospholipids are important components of cytoplasmic membranes, and phospholipases are responsible for the hydrolysis of phospholipids. Based on the target position of hydrolysis of glycerophospholipid, plant phospholipases are classified into phospholipase A (PLA), phospholipase C (PLC), and phospholipase D (PLD).Citation9 Five phosphoinositide-specific phospholipase C (PI-PLC) isoforms, β, γ, δ, ε, and ζ, have been identified in mammals, and the structure of plant PI-PLCs is highly similar to mammalian PI-PLC-ζ isoform.Citation9 PLC pathway is a mainly synthesis pathway of phosphatidic acid in plants, which acts as a lipid second messenger and is involved in a wide range of defense responses.Citation10 These studies report that transcriptional activation of the PI-PLC gene family is important for adapting plants to stress environments.Citation10
To date, four PLC genes, NtPLC1, NtPLC2, NtPLC3, and NtPLC4, have been identified in the tobacco.Citation11 The tobacco ME is a typical stress-induced cell fate transition. Therefore, it is worth to study whether PLC plays a role at the early stages of ME. Here, we report PLC as a novel regulator in ME and provide evidences for that NtPLC2/3/4 are involved at the early stages of ME and inhibition of PLCs could suppress ME.
Results and Discussion
NtPLCs were expressed at the early stages of ME
The microspore population in the late unicellular stage which with big vacuoles and peripherally located nucleus were used for ME culturing (). The initial stage of tobacco ME is induced by heat shock in combination with starvation treatment. Cultured in B-starvation medium for 5 days at 32°C, microspores were transferred into a sugar-containing AT3 medium at 25°C in the dark for embryogenesis. The first sporophytic division (FD) of starvation and heat shock-induced embryogenic microspores were observed after 5–7 days of culture in AT3 medium (). The pattern of subsequent division was similar to that of the zygotic embryo. Rapid cell divisions continued in vitro for 5–6 weeks and resulted in the formation of heart-shaped embryos ().
Figure 1. NtPLCs were expressed at the early stages of microspore embryogenesis. (a) Late-mononuclear stage. (b) First equally division. (c) Second equally division. (d-e) Globular embryo. (f) Cotyledon embryo. (g) The initial stages of ME in tobacco. D0, microspore; D1, D3, D5 (1, 3, and 5 days in B medium); AT3-D3, AT3-D5 (3 and 5 days in AT3 medium); FD, First division. (h) Relative expression levels of NtPLCs at the early stages of ME. nd, no detected. Data are the means ± SD (standard deviations). Letters indicate statistical groups deduced from One-Way ANOVA analysis (Tukey test, P < 0.05) performed on the data. Bars: 10 μm in (a-e) and 100 μm in (f).
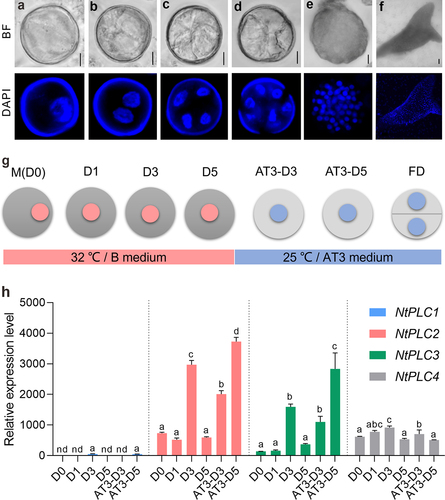
The cell fate transition process is divided into several developmental stages (), including unicellular microspores (D0), 1, 3, 5 day(s) in B medium (D1, D3, and D5), and 3 and 5 days in AT3 medium (AT3-D3 and AT3-D5). qRT-PCR approach was applied to investigate the expression pattern of each NtPLC at different stages of early ME. The dynamic expression changes of NtPLCs showed different trends. NtPLC1 was hardly detected in the all stages, indicating that it was not involved at the early stages of ME (). And the expression of NtPLC4 showed relatively stable during the culture (). In contrast, the expression of NtPLC2 and NtPLC3 significantly increased at D3 stage, then decreased at D5 stage. After transferred into AT3 medium, the expression of NtPLC2 and NtPLC3 gradually increased again at AT3-D3 and AT3-D5 stages (). Taken together, these data imply the involvement of NtPLC2/3/4 at the early stages of ME in tobacco.
Sequence analysis of NtPLCs
To analyze the evolutionary relationships of PLC proteins, the PLC protein sequences from tobacco and common organisms that have been reported to undergo MECitation2 were aligned and used for a phylogenetic analysis. The PLCs from tobacco, rice, wheat, rape, barley, and Arabidopsis (Table S1) were used for the construction of the phylogenetic tree. According to the evolutionary relationships, these PLCs could be grouped as four distinct clusters: two dicotyledon groups and two monocotyledon groups (Figure S1). In terms of evolutionary relationship, the four NtPLCs were more closely related to BnaPI-PLC7Cnn-1, BnaPI-PLC7A9, BnaPI-PLC7Cnn-2, BnaPI-PLC2C1, BnaPI-PLC2C5, BnaPI-PLC2A5, BnaPI-PLC6C4, BnaPI-PLC6C3, BnaPI-PLC6A3, AtPI-PLC2, AtPI-PLC6, and AtPI-PLC7. Thus, we speculate that these BnPI-PLCs may be involved in ME of Brassica napus.
Furthermore, the conserved regions of the cluster containing NtPLCs were carried out (Figure S2). Three conserved regions distributed on the front, middle, and rear segments of the protein sequence, and they were X domain of catalytic part (PI -PLC X-box), Y domain of catalytic part (PI-PLC Y-box), and C2 domain in PI-PLC, respectively. In these conserved domains, some specific amino acid sites of NtPLCs were different from other PI-PLC protein in the clade, and these amino acid sites might be unique in tobacco (Figure S2).
During the early stages of ME, NtPLC2 and NtPLC3 exhibited significant transcriptional levels increase at D3 stage, and then they reduced at D5 stage. However, expression of NtPLC4 was tended to stabilize during the whole stages. In addition, NtPLC2 and NtPLC3 showed a higher similarity of protein sequence than NtPLC4 (Figure S2). It implies that NtPLC2 and NtPLC3 may have different functions from NtPLC4 during the early stages of ME.
Suppressing PLC activity induce decline of ME
To investigate the role of PLCs in the ME, studying the effects of the PCL-inhibitor neomycin was carried out. Neomycin is a positively charged aminoglycoside binding to PtdInsP2 and is used as an inhibitor of PLC.Citation12 To eliminate the negative effects on cell vivacity, 2.5 μM, 5 μM, 7.5 μM, 10 μM, and 20 μM of neomycin were added to B medium and tested cell survival with FDA staining, respectively (). In 2.5 μM, 5 μM, and 7.5 μM of neomycin treatment groups, there were no significant differences (P > 0.05, One-Way ANOVA) in cell survival, respectively. Decreased cell survival occurred with over 10 μM of neomycin treatment at D5 stage (). Next, the effects of PLC inhibition on the expression level of NtPLCs were also evaluated. At D3 stage, qRT-PCR analysis showed that the expression level of NtPLC2/3/4 in cultures treated with neomycin was significantly lower than control (). These results clarify that inhibition of PLCs can induce decrease of NtPLC2/3/4 expression at the early stages of ME.
Figure 2. Effects of PLC inhibition on microspore survival, transcription of NtPLCs and embryogenesis induction efficiency. (a) Statistics of the percentage of survival cells with 0–20 μM of neomycin treatment at D0 – D5 stages, respectively. (b) Relative expression levels of NtPLCs with 5 μM of neomycin treatment for 3 days. (Student’s t-test; **P < 0.01). nd, no detected. (c) Statistics of microspore embryogenesis initiation with neomycin treatment at AT3-D6 stage. (d-g) Microspore-derived embryos after 20 d in culture with 2.5 μM (d), 5 μM (e), 7.5 μM (f), and 10 μM (g) of neomycin, respectively. Data are the means ± SD. Letters indicate statistical groups deduced from One-Way ANOVA analysis (Tukey test, P < 0.05) performed on the data.
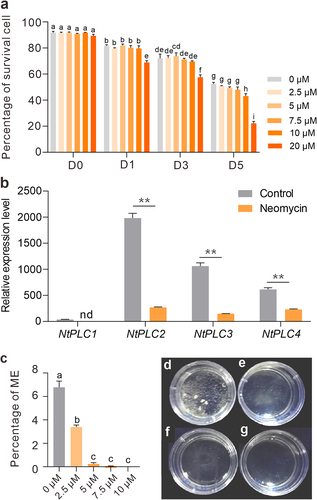
Furthermore, we examined the effects of PLC inhibition on ME initiation. After 6 days in AT3 medium, the number of proembryos was determined as an indicator of initiation of ME. In control, 6.78% microspores could be undergoing embryogenesis (). However, in 2.5 μM of neomycin treatment group, the production was dropped to 3.39%, and proembryos were barely detectable in over 5 μM of neomycin treatment groups (). The results demonstrate a significant decrease in ME treated with the PLC inhibitor.
In summary, these data indicate that inhibition of PLCs decline embryogenesis initiation during ME. However, it is still far to know PLCs-mediated signaling in ME to date. In previous studies, it provides some clues about PLCs-mediated signaling in stress responses and plant innate immunity, including protein phosphorylation, alteration in the composition of membrane phospholipids, increase in cytosolic Ca2+, NO, and ROS generation, the activities of transporters, protein kinases and transcription factors, and pH in cytoplasm.Citation13 Therefore, it is worth to test these downstream effects of PLCs signaling pathway during ME in the near future.
PLCs play a role in ME via lipid degradation
Phospholipases mediate the membrane lipid remodeling as they catalyze the initial step of phospholipid breakdown and generate multiple lipid derived second messengers.Citation14 PLCs are involved in lipids signaling and hydrolyze membrane-associated phospholipid, phosphatidylinositol-4,5-bisphosphate to produce two second messengers, inositol-1,4,5-trisphosphate and diacylglycerol.Citation15 In ME, the cell fate transition occurs before the cell division, accompanying with a series of cellular component remodeling processes.Citation16 We observed lipids in both developmental pathway of gametogenesis and ME. In gametophytic pathway, mature pollen showed a clear and consistent increase as comparing to microspore using Nile red staining (). In contrary, in ME pathway, lipid metabolism presented a dynamic process of first degradation and then re-accumulation, accompanied by typical cytological changes (). In B medium, lipids in the microspores were gradually degraded (). At D5 stage, there were almost no obvious lipid droplets remaining in the cells and showing a star-like morphology formed by the typical cytoplasmic inner membrane remained, and it was considered as the first sign of embryogenic induction. Lipid droplets were observed to re-accumulate within the microspores in AT3 medium ().
Figure 3. PLC inhibition suppresses lipid metabolism in ME. (a) Nile red staining of microspores in two different developmental pathways. A star-like morphology has been shown in D5. MP, mature pollen; D0, microspore; D3, D5 (3 and 5 days in B medium); AT3-D3, AT3-D5 (3 and 5 days in AT3 medium); FD, first division. (b) The comparative morphology of microspores with Nile red staining. Compared with the control, the B medium of the treatment group contained 5 μM and 7.5 μM of neomycin, respectively. Relative fluorescence intensity of lipid droplets (n = 29–40). Data are the means ± SD. Letters indicate statistical groups deduced from One-Way ANOVA analysis (Tukey test, P < 0.05) performed on the data. Bars: 10 μm.
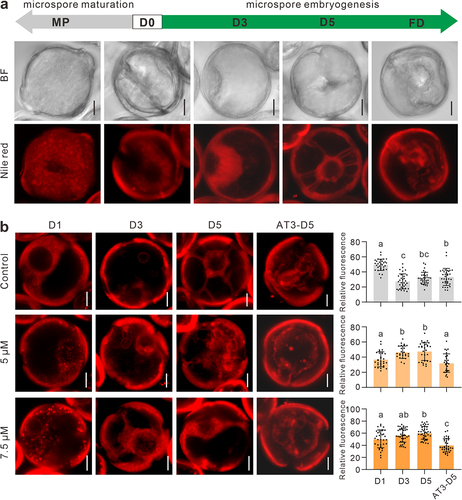
Next, to examine the effect of PLC inhibition on lipid metabolism at the early stages of ME, we treated microspores with 5 μM and 7.5 μM of neomycin, respectively. At D1 – D5 stages, neomycin treatment clearly reduced the lipid metabolism by Nile red staining (). In the treatment groups, the accumulation of lipid droplets at D1 stage increased compared with control, and this phenotype aggravated with the increase in the neomycin concentration (). In B medium, lipid degradation was delayed, and the residual amount of lipid droplets was also higher after transfer into AT3 medium (). During the culture, star-like microspores were not observed in neomycin treatment groups (). Therefore, we infer that PLCs inhibition reduces lipid metabolism, which may make a negative effect on the initiation of ME. Remarkably, lipids were abundant when the microspore is developed into a mature pollen, however, they were required to be metabolized when microspore turned to embryogenic development pathway (). Thus, the mechanism of PLCs-mediated lipids metabolism in ME will need further work to reveal.
Conclusion
In conclusion, NtPLC2/3/4 could be expressed at early stages of ME, and inhibition of PLCs could reduce ME productivity and lead to lipid accumulation in microspore. We preliminarily studied the expression and role of PLCs in ME, and found PLC as a novel regulatory factor of ME in tobacco. These findings could provide a new opportunity to reveal PLCs-mediated cell developmental transition during microspore embryogenesis.
Materials and methods
Materials
Tobacco plants (Nicotiana tabacum L., cv. Petite Havana SR1) were grown under a 16/8 h light/dark cycle at 25°C in green house.
Phylogenetic analysis
The PLC protein sequences were obtained from NCBI or Uniport (Table S1). For the phylogenetic analysis, the protein sequences were used for multiple sequence alignment with Clustal X 2.0 software. A phylogenetic tree was constructed to analyze the evolutionary relationships of the PLCs by MEGA 5.2 software with the Neighbor-Joining method.
Microspore isolation and culture
The tobacco buds of 11–12 mm represented unicellular microspores. Anthers were gently dissected from the buds sterilized with 75% ethyl alcohol for 3 min, after three washes with sterilized water, then microspores were released into a dish (706001, NEST) containing B mediumCitation17 (pH 7.0). Following washing in the same isolation medium twice, microspores were cultured in 2.5 mL B medium in dishes at a density of 5 × 10⁴ grains mL−1 and incubated in the dark at 32°C for 5 days. The induced microspores were collected by centrifugation and then transferred into a sugar-containing AT3 mediumCitation18 (pH 5.6). The microspores were incubated for progression of embryogenesis at 25°C in the dark.
Quantitative real-time PCR analysis (qRT-PCR)
Total RNA was extracted from in vitro samples using the EZNA® HP Plant RNA Kit (R6837, Omega) according to the manufacturer’s instruction. cDNA was obtained from 2 µg of RNA using the HiScript® II 1st Strand cDNA Synthesis Kit (R211-01, Vazyme). 0.2 μL of resulting first-strand cDNA was used as a PCR template for qRT-PCR. Quantitative PCR analysis were performed using ChamQ SYBR qPCR Master Mix (Q321-02, Vazyme) with a CFX ConnectTM Real-Time System (Bio-Rad). The primers used in this study were listed in Table S2. Ubiquitin-conjugating enzyme 2 (UBI) and Glyceraldehyde-3-phosphate dehydrogenase (GAPDH) were used as the internal references to normalize the relative level of each transcript. Each experiment was repeated three times and each time the experiment included duplicate samples.
DAPI and FDA staining
Microspores culture were stained with 1 mg mL−1 DAPI (D9542, Sigma) for 10 min and analyzed by confocal laser microscopy. To evaluate cell viability, we stained microspores with FDA (fluorescein diacetate, F7378, Sigma). Microspores or microspore embryos were incubated in the solution containing 2 μg mL−1 FDA for 10 min at room temperature and washed twice with PBS before observation.Citation19
Neomycin treatment
2.5 μM, 5 μM, 7.5 μM, 10 μM, and 20 μM of neomycin (N6386, Sigma) were added to the microspore culture plates at the time of stress treatment, respectively. Same volume of water was added as a control. After stress treatment, the microspores were transferred into a sugar-containing AT3 medium without neomycin.
Visualization of lipids
Microspores were collected by centrifugation at 1000 × g for 5 min and resuspend by 5% mannitol. Lipids were visualized after the staining with 25 μg mL−1 Nile red (RS1294, RYON) dissolved in acetone. Nile red was excited at 546 nm and detected at wavelengths 560–615 nm.
Confocal microscopy and image analysis
Microspores fluorescence was visualized using a laser scanning confocal microscope (LSM710, Zeiss). The statistics of microspore embryos and cell viability were calculated using ImageJ.
Quantification and statistical analysis
Mean percentage of the embryos was quantified from random samples of three independent experiments. The fluorescence intensity was calculated as integrated density – (area of selected lipid droplet × mean background fluorescence). Statistical analysis was analyzed using GraphPad Prism 7 software.
Supplemental Material
Download MS Word (1.4 MB)Disclosure statement
No potential conflict of interest was reported by the author(s).
Supplementary material
Supplemental data for this article can be accessed online at https://doi.org/10.1080/15592324.2022.2094618.
Additional information
Funding
References
- Soriano M, Li H, Boutilier K. Microspore embryogenesis: establishment of embryo identity and pattern in culture. Plant Reprod. 2013;26(3):181–7. doi:10.1007/s00497-013-0226-7.
- Testillano PS. Microspore embryogenesis: targeting the determinant factors of stress-induced cell reprogramming for crop improvement. J Exp Bot. 2019;70(11):2965–2978. doi:10.1093/jxb/ery464.
- Radoeva T, Weijers D. A roadmap to embryo identity in plants. Trends Plant Sci. 2014;19(11):709–716. doi:10.1016/j.tplants.2014.06.009.
- Islam SS, Tuteja N. Enhancement of androgenesis by abiotic stress and other pretreatments in major crop species. Plant Sci. 2012;182:134–144. doi:10.1016/j.plantsci.2011.10.001.
- Li H, Soriano M, Cordewener J, Muiño JM, Riksen T, Fukuoka H, Angenent GC, Boutilier K. The histone deacetylase inhibitor trichostatin a promotes totipotency in the male gametophyte. Plant Cell. 2014;26(1):195–209. doi:10.1105/tpc.113.116491.
- Seifert F, Bössow S, Kumlehn J, Gnad H, Scholten S. Analysis of wheat microspore embryogenesis induction by transcriptome and small RNA sequencing using the highly responsive cultivar “Svilena”. BMC Plant Biol. 2016;16(1):1–6. doi:10.1186/s12870-016-0782-8.
- Tian H, Yao CY, Sun MX. High frequency conversion of microspore-derived embryos of Brassica napus cv. Topas by supplemental calcium and vitamins. Plant Cell Tissue Organ Cult. 2004;76(2):159–165. doi:10.1023/B:TICU.0000007292.10767.54.
- Żur I, Dubas E, Krzewska M, Janowiak F. Current insights into hormonal regulation of microspore embryogenesis. Front Plant Sci. 2015;6:424. doi:10.3389/fpls.2015.00424.
- Wang X. P LANT P HOSPHOLIPASES. Annu Rev Plant Biol. 2001;52(1):211–231. doi:10.1146/annurev.arplant.52.1.211.
- Canonne J, Froidure-Nicolas S, Rivas S. Phospholipases in action during plant defense signaling. Plant Signal Behav. 2011;6(1):13–18. doi:10.4161/psb.6.1.14037.
- Wang L, Zhu X, Liu J, Chu X, Jiao J, Liang Y. Involvement of phospholipases C and D in the defence responses of riboflavin-treated tobacco cells. Protoplasma. 2013;250(2):441–449. doi:10.1007/s00709-012-0426-2.
- Ruelland E, Cantrel C, Gawer M, Kader JC, Zachowski A. Activation of phospholipases C and D is an early response to a cold exposure in Arabidopsis suspension cells. Plant Physiol. 2002;130(2):999–1007. doi:10.1104/pp.006080.
- Ali U, Lu S, Fadlalla T, Iqbal S, Yue H, Yang B, Hong Y, Wang X, Guo L. The functions of phospholipases and their hydrolysis products in plant growth, development and stress responses. Prog Lipid Res. 2022;5:101158. doi:10.1016/j.plipres.2022.101158.
- Tuteja N, Sopory SK. Plant signaling in stress: g-protein coupled receptors, heterotrimeric G-proteins and signal coupling via phospholipases. Plant Signal Behav. 2008;3(2):79–86. doi:10.4161/psb.3.2.5303.
- Rupwate SD, Rajasekharan R. Plant phosphoinositide-specific phospholipase C: an insight. Plant Signal Behav. 2012;7(10):1281–1283. doi:10.4161/psb.21436.
- Touraev A, Pfosser M, Vicente O, Heberle-Bors E. Stress as the major signal controlling the developmental fate of tobacco microspores: towards a unified model of induction of microspore/pollen embryogenesis. Planta. 1996;200(1):144–152. doi:10.1007/BF00196662.
- Kyo M, Harada H. Control of the developmental pathway of tobacco pollen in vitro. Planta. 1986;168(4):427–432. doi:10.1007/BF00392260.
- Touraev A, and Heberle-Bors E. Microspore embryogenesis and in vitro pollen maturation in tobacco. Plant Cell Culture Protocols. 1999;(111):281–291. doi:10.1385/1-59259-583-9:281.
- Shi C, Luo P, Du YT, Chen H, Huang X, Cheng TH, Luo A, Li HJ, Yang WC, Zhao P, et al. Maternal control of suspensor programmed cell death via gibberellin signaling. Nat Commun. 2019;10(1):1–12. doi:10.1038/s41467-019-11476-3.