
Abstract
We present a calibration method which allows single shot dual wavelength online shape measurement in a disturbed environment. Effects of uncontrolled carrier frequency filtering are discussed as well. We demonstrate that phase maps and speckle displacements can be recovered free of chromatic aberrations. To our knowledge, this is the first time that a single shot dual wavelength calibration is reported by defining a criteria to make the spatial filtering automatic avoiding the problems of manual methods. The procedure is shown to give shape accuracy of 35 µm with negligible systematic errors using a synthetic wavelength of 1.1 mm.
NOMENCLATURE
| CAD | = |
Computer-Aided Design |
| 2-D | = |
2 Dimension |
| FFT | = |
Fast Fourier Transform |
| IFFT | = |
Inverse Fast Fourier Transform |
| CCD | = |
Charge-Coupled Device |
| NA | = |
Numerical Aperture |
| ROI | = |
Region of Interest |
1. INTRODUCTION
In the manufacturing industry there is a high demand for on line quality control to minimize the risk of incorrectly produced objects. Interferometry and digital holography in combination with computers become faster, more reliable and highly accurate as a well-established technique for industrial shape measurement.[ Citation1-5 ] For example[ Citation 6 , Citation 7 ] has recently presented a method where a single shot shape evaluation has been used for real-time evaluation of free-form objects in comparison with their prescribed CAD-model. Digital holography allows defining numerical optics to perform optical processing of the recorded data.[ Citation8-11 ] Conventional single wavelength profiler techniques can only handle smooth profiles with step heights of less than half a wavelength. Therefore, multi wavelength interferometry has been introduced. On the other hand, use of several wavelengths in the same optical apparatus can lead to the occurrence of severe chromatic aberrations.[ Citation 12 ] For the measurement of the shape of optically rough surfaces, dual wavelength digital holography, produces a longer synthetic wavelength[ Citation 13 ] for retrieving the phase without ambiguity over an extended range. However, disturbances in the form of phase aberration will result in erroneous results and need to be corrected. One possible solution is mechanical adjustment of the set-up or using adaptive focus optics to compensate the focal shift of the image plane. However, the intrinsic flexibility of digital holography gives a possibility to compensate these aberrations and remove errors, fully numerically without mechanical movements.
The spatial frequency content in a hologram, depends on the wavelength and angular content of object and reference light, respectively. Then different spatial frequency filters are needed to filter out the corresponding holograms in the Fourier plane.[ Citation 14 ] Furthermore, if the optics are not totally achromatic, the reconstruction distance for each hologram will change and different image shift and magnification could occur in the reconstruction.[ Citation 15 ] Valuable solutions of spatial frequency filtering for multi wavelength measurements have been discussed in.[ Citation 8 , Citation 16 ] By calculating the scale of spatial frequency in different wavelengths with respect to each other, the filter size is controlled to extract the holograms. Furthermore, they compensate the phase aberration by using polynomial fitting on flat areas or by using a reference hologram. However, these methods fail when a single shot measurement is used for online quality control purposes as the frequency components of each wavelength are embedded in different places of the image spectrum.[ Citation17-19 ] Different laser sources in the single shot measurements, induce extra aberration and pseudo phase changes that can be suppressed by applying the modified flat fielding method.[ Citation 9 , Citation 11 , Citation 20 ] In the flat fielding method they use a single dark frame and a flat frame captured from the system containing dual wavelengths to calibrate the measured data. One possible problem with the flat fielding method is an increase of the noise level because of division with intensity values close to zero. In this article, we use only phase subtraction to prevent magnification of noise. However, this compensation itself can lead to some errors if it is done out of focus.
This article is a continuation of the work presented in.[ Citation 6 , Citation 21 ] In this method the correspondence between speckle displacements and phase gradients is utilized to find the shape without problems with phase unwrapping. However, for this method to work properly it is necessary to have a well collimated set-up. In previous single shot calibrations, spatial frequency filtering is performed manually without any definite criteria.[ Citation 11 , Citation 16 ] Here we present the effect of uncontrolled carrier frequency filtering in the reconstruction process. The objective is to determine a calibration process that allows single shot dual wavelength online shape measurement in a disturbed environment. We demonstrate that a single shot dual wavelength phase map and speckle displacements can be recovered free of chromatic aberrations. A flowchart of the proposed method is shown in Figure . The method consists of a loop that includes three main steps. The loop starts with initial guesses of masks in the spectral domain to extract the holograms. Secondly, curvature of the fields is corrected and the fields are then numerically propagated to the focus plane. Thirdly, the phase map is calculated by suppressing the aberration terms. The loop iterates until it finds the best estimation of the mask.
Figure 1 Flowchart of the proposed algorithm for calibrated single shot dual wavelength digital holography. IFFT and ΔA represent inverse Fourier transform and average speckle displacements, respectively.
In the following, we describe the experimental set-up and the calculation procedure to do the calibration The procedure is demonstrated by a test object including a step height. In the comparison a CAD-model which describes the ideal shape of the measured object is utilized.
2. EXPERIMENTAL SET-UP
The single shot dual wavelength experimental set-up is shown in Figure left. The light source is a dual core diode pumped fiber laser that produces pulsed light with wavelengths λ1 = 1030.44 nm and λ2 = 1031.4 nm, respectively. This gives a synthetic wavelength of 1.1 mm. A flat metal object is used as a reference plane and the test object is a cylinder with a diameter of 48 mm. A trace of depth 3 mm is machined off the cylinder. We are measuring a 18 mm × 18 mm section including the trace and the cylindrical section (see Figure right). The two beams are combined using a mirror and a beam splitter and are adjusted to be collinear. Afterwards, a negative lens is used to diverge the combined collinear beam to illuminate the object. A 12 bit CCD camera (pco. Sensicam) with a resolution of 1280 × 1024 pixels and a pixel size of 6.45 × 6.45 µm is used to record the image. A circular aperture with a diameter of 4 mm is used to regulate the spatial frequency content of the object light passed on to the detector. The reference beams are taken from a beam splitter (10/90). The angle of each of the reference beams to the detector is adjusted by separate mirrors. These angles are adjusted in a way to have whole and separate spatial frequencies of each hologram in the spectrum of the single shot recorded image. Then all necessary information of two holograms are resolved in a single image.
Figure 2 Set-up (left). Test object (Right).
3. CALCULATION PROCEDURE
The principle of dual wavelength single shot off-axis digital hologram acquisition is shown in Figure . Define as the object waves and
as the reference waves in the detector plane, where i is 1 or 2, representing the two different wavelengths. The recorded image can then be represented by
Figure 3 The recording of single shot dual wavelength digital holography.
Consider the third and fourth terms in Equation (Equation1). A modified version,
of the object waves are retrieved as
3.1. Carrier Frequency Calibration
The first step of the reconstruction procedure consists of applying a careful spatial frequency filter in the Fourier domain to filter out the corresponding interference terms. To do this, two masks P i (ν k , ν l , r i ) defining the spatial filtering are introduced where ν k , ν l are the spatial frequency coordinates and r i is the radius of the cut area. These masks should be of sufficient size to cover the carrier frequencies of the lobes given the numerical aperture NA of the imaging system. The radius of the filters is given by
To meet those requirements, a technique that sets the speckle displacements between the two reconstructed speckle patterns to zero in the focus plane is utilized.[ Citation 21 , Citation 23 , Citation 24 ] First the focus plane needs to be found. This is done manually by cutting out the frequency components of the holograms and search for the maximum correlation along the optical axis in the reconstructed holograms.[ Citation 25 ] Since the purpose of this step is only to determine the focus plane position there is no need to accurately cut out the lobes. Once the focus plane is found the exact position of the lobe centers should be found. This is the procedure of estimating the term (ax + by) in Equation (Equation3) which in general includes four unknowns, two for each wavelength. However, as only the difference in central positions is of importance one of the centers is fixed and we search for the correct position of the other. For this purpose the correction vector Δ P c = (k 0, l 0) as a miss-match between the two hologram contents, is introduced (red arrow in Figure ).
Figure 4 Fourier transform of the recorded image. Arrow in the right image corresponds to a miss-match of Δ P c when the centered frequency components of λ1 and λ2 do not match each other.
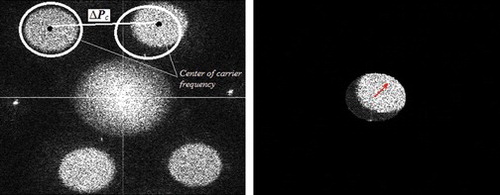
According to the shift properties of the Fourier transform, Δ P c = (k 0, l 0) will introduce phase and spatial shift in the retrieved holograms f(x,y):
Figure 5 Effect of carrier frequency matching on the speckle displacement (left) and corresponding measured phase (right) of flat reference plane in the focus plane. Results of matched and unmatched carrier frequencies are shown in top and bottom rows, respectively. It is expected that both the speckle displacements and the phase are zero.
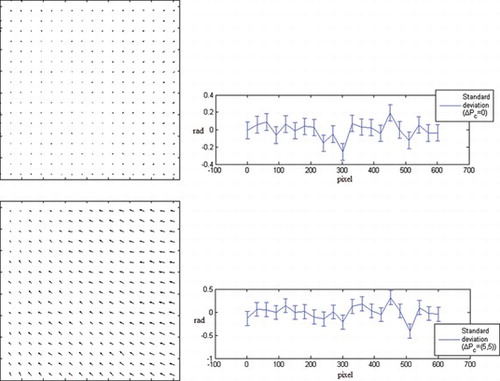
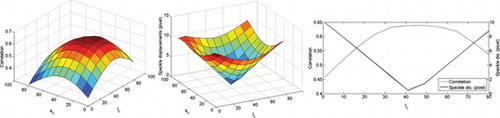
The automatic procedure is as follows: We first start to define a mask P 1 (ν k , ν l , r) manually where subscript 1 refers to the shorter wavelength. The objective is then to estimate P 2 (ν k + k 0, ν l + l 0, r) where reasonably good starting estimates of (k 0, l 0) are obtained manually. We then search for the set of (k 0, l 0) that gives the minimum speckle displacements in the focus plane. See Figure . Notice, that possible small errors caused by the manual definition of the first mask will be canceled by the loop iteration to find the second mask. Figure shows two different criteria to find the best shift values of k 0 and l 0. A typical shift value of k 0 = 49 pixels and l 0 = 41 pixels relative to the original guess of the second mask, was calculated for the mask used in our experimental data. Comparison of the correlation value and the speckle displacements, shows that the speckle displacements represent a sharp minimum for proper mask definition while the correlation has a much more flat profile. The speckle displacements hence provide a more liable norm for defining the best mask position.
Figure 6 The correlation values (left) and absolute speckle displacements (center) from a measurement of the flat reference object for different shift values of k 0 and l 0. In the case of k 0 = 49 pixels, a 2-D plot of both correlation and speckle displacements as a function of l 0 are shown to the right.
3.2. Curvature of the Reference Waves
In many applications, as in this one, there is a need to propagate the wave and refocus the holograms in different planes. Here we follow the procedure described in.[ Citation 26 ] The term C(x 2 + y 2) in Equation (Equation3), will act as a positive lens on the object wave, with a focal length f 1 equal to the distance between the reference wave point source and the detector.[ Citation 27 ] Figure represents the geometry of the reconstruction configuration where z and z i are distances in object and image space, respectively, while l is the distance between the detector plane and the exit pupil of the imaging system having effective focal length f 0. Then a numerical lens f 1 = l − f 0 is directly determined from the set-up and used to compensate for the curvature of the reference wave as well as to make the refocusing telecentric. In this way a constant magnification is reassured for the refocused holograms and the effect of the term C(x 2 + y 2) in Equation (Equation3) is cancelled.
Figure 7 Geometry of the reconstruction configuration.
3.3. Phase Aberration Compensation
Assume that the specimen does not introduce aberration but only a phase delay for each wavelength. For the known flat area, these terms,
are constant for any plane, neglecting the diffraction pattern due to defocus. Therefore, assuming that the steps in the previous two sections are properly performed only a small phase aberration will remain. The final phase difference map will simply be calculated by suppressing the aberration term
from the reference flat. Figure shows the flowchart of our method. With the calibration properly performed the final phase map will be
Figure 8 Phase calibration using Equation (Equation9). The final phase of the measured object is calculated by the subtraction of the reference phase difference from the object phase (top right) in the focus plane. The standard deviation of the measured phase has improved from 1.81 radians to 0.38 radians using the proposed method.
4. SHAPE MEASUREMENT
In order to find the shape deviations between the measured surface and a prescribed CAD-model we are using the method described in.[ Citation 6 ] A rigid body transformation, that is a rotation and a translation, is to be found such that the transformed CAD-model is matched to the shape gradients, obtained from the speckle displacements, and the phase map. This is an iterative method based on a combination of the iterative closest point algorithm and a phase unwrapping algorithm. It results in that the shape gradients and the phase map are aligned to the CAD-model which is in an orientation given from the obtained transformation. The values in the phase map represent wrapped height values of the measured object. Using the phase map and the transformed CAD-model an accurate shape representation of the measured object can be obtained.
Figure shows the results of the shape measurement using the CAD-model, before and after calibration, respectively. In the second and third column the importance of doing the phase calibration (last step of Figure ) is presented. Before calibration (first column) the phase and speckle displacements include aberration and consequently the standard deviation of the measurement from the CAD-model is too high. In the second column, phase subtraction has been done without propagating the holograms to the focus plane. The phase map is improved but speckle displacements differ from the direction of the fringes, which introduce noise. The highest accuracy of the measurement and highest agreement between speckle displacements and phase map are achieved when the calibration is done after propagating the image to the focus plane. The standard deviation of the measurement without calibration is 200 µm which is improved to 69 µm and 35 µm when the calibration has been done before and after propagating the holograms to the focus plane, respectively. Furthermore, the random errors in speckle correlation calculation for the used data equals to 0.264 pixel which can be the source of errors.
Figure 9 Experimental results using the method described in Bergström et al.[ Citation 6 ] The upper row shows the measured phase difference, the central row the corresponding speckle displacements in the focus plane and the lower row the estimated shape. The left column are results from an uncalibrated system, the central column are results from when the calibration is performed out-of-focus, and the right column are results from using the calibration procedure described in this article.
![Figure 9 Experimental results using the method described in Bergström et al.[ Citation 6 ] The upper row shows the measured phase difference, the central row the corresponding speckle displacements in the focus plane and the lower row the estimated shape. The left column are results from an uncalibrated system, the central column are results from when the calibration is performed out-of-focus, and the right column are results from using the calibration procedure described in this article.](/cms/asset/1bc800f9-44d7-4361-92ba-c26ef16f95d3/uopt_a_942932_o_f0009g.gif)
5. DISCUSSION AND CONCLUSIONS
In this article we have described a method for dual wavelength single shot holography to compensate and calibrate phase aberration and speckle displacements, which can be used in shape measurement applications. Speckle displacements in the focus plane are used to define a mask in the Fourier plane that gives the correct phase compensation between the reconstructed waves. Since the correlation peak search is broad, and in contrast, the speckle displacement is sharp, we rely on localization of the minimum speckle displacements. In general, interference terms recorded with different wavelengths require different mask sizes. For our recorded image where the wavelength difference is less than 1 nm we have kept the mask size constant.
We need to emphasize that, it is of great importance to do the calibration in the focus plane. Even if the image is recorded out of focus, it should be propagated numerically to the focus plane. Firstly, we have accurate expectation of phase and speckle displacements in the focus plane and secondly, in the focus plane, the calibration avoids unknown error sources.
In summary, the shape measurement method that we are using is based on a single-shot dual-wavelength holographic acquisition. In contrast to what is customary the shape estimate is based on speckle displacements as well as phase difference. In that way, problems associated with the phase wrapping is avoided and objects with larger depth can be measured. In addition, if a CAD-model of the object to be measured is used, it is important to have a good correspondence between the speckle displacements and the phases. If we are having a constant drift between the speckle displacements and the phases, then we will measure or estimate the wrong shape as is seen in Figure -bottom row and Figure -left column. So in our method that first uses speckle displacements and then the phases, it is much important than in the normal cases to have a calibrated system. In this paper we calibrate both phase and speckle displacements for single shot measurements. The standard deviation of the measurement without calibration is 200 µm which is improved to 69 µm and 35 µm when the calibration has been done before and after propagating the holograms to the focus plane, respectively.
ACKNOWLEDGMENTS
The Authors would also like to thank Dr. Henrik Lycksam, Dr. Per Gren and Dr. Erik Olsson for valuable discussions.
Notes
Color versions of one or more of the figures in the article can be found online at www.tandfonline.com/uopt.
REFERENCES
- Seebacher , S. ; Osten , W. ; Jueptner , W.P.O. Measuring shape and deformation of small objects using digital holography. Proc. SPIE 3479, Laser Interferometry IX: Applications, 104 (July 6, 1998); doi:10.1117/12.316439; http://dx.doi.org/10.1117/12.316439 .
- Osten , W. Application of optical shape measurement for the nondestructive evaluation of complex objects . Opt. Eng. 2000 , 39 , 232 – 243 .
- Yamaguchi , I. ; Ida , T. ; Yokota , M. ; Yamashita , K. Surface shape measurement by phase-shifting digital holography with a wavelength shift . Appl. Opt. 2006 , 45 , 7610 – 7616 . doi: 10.1364/AO.45.007610.
- Poon , T-C. Digital Holography and Three-Dimensional Display: Principles and Applications . Springer : New York , 2006 .
- Khodadad , D. ; Hällstig , E. ; Sjödahl , M. Dual-wavelength digital holographic shape measurement using speckle movements and phase gradients . Opt. Eng. 2013a , 52 , 101912 – 101912 . doi: 10.1117/1.OE.52.10.101912.
- Bergström , P. ; Khodadad , D. ; Hällstig , E. ; Sjödahl , M. Dual-wavelength digital holography: single-shot shape evaluation using speckle displacements and regularization . Appl. Opt. 2014 , 53 , 123 – 131 . doi: 10.1364/AO.53.000123.
- Bergström , P. ; Khodadad , D. ; Hällstig , E. ; Sjödahl , M. Single shot shape evaluation using dual-wavelength holographic reconstructions and regularization . In Fringe ; Osten , W. , Ed.; Springer : Berlin , Heidelberg , 2013 ; pp. 103 – 108 .
- Colomb , T. ; Charrière , F. ; Kühn , J. ; Montfort , F. ; Depeursinge , C. A complete digital optics applied to digital holographic microscopy: Application to chromatic aberration compensation , Proc. SPIE 6616, Optical Measurement Systems for Industrial Inspection V, June 18, 2007, 66161C1-66161C8; doi:10.1117/12.726052 .
- Ferraro , P. ; Miccio , L. ; Grilli , S. ; Paturzo , M. ; De Nicola , S. ; Finizio , A. ; Osellame , R. ; Laporta , P. Quantitative phase microscopy of microstructures with extended measurement range and correction of chromatic aberrations by multiwavelength digital holography . Opt. Express 2007 , 15 , 14591 – 14600 . doi: 10.1364/OE.15.014591.
- Sjödahl , M. ; Olsson , E. ; Amer , E. ; Gren , P. Depth-resolved measurement of phase gradients in a transient phase object field using pulsed digital holography . Appl. Opt. 2009 , 48 , H31 – H39 . doi: 10.1364/AO.48.000H31.
- Abdelsalam , D.G. ; Magnusson , R. ; Kim , D. Single-shot, dual-wavelength digital holography based on polarizing separation . Appl. Opt. 2011 , 50 , 3360 – 3368 . doi: 10.1364/AO.50.003360.
- Millán , M.S. ; Otón , J. ; Pérez-Cabré , E. Dynamic compensation of chromatic aberration in a programmable diffractive lens . Opt. Express 2006 , 14 , 9103 – 9112 . doi: 10.1364/OE.14.009103.
- Wagner , C. ; Osten , W. ; Seebacher , S. Direct shape measurement by digital wavefront reconstruction and multiwavelength contouring . Opt. Eng. 2000 , 39 , 79 – 85 .
- Cuche , E. ; Marquet , P. ; Depeursinge , C. Spatial Filtering for zero-order and twin-image elimination in digital off-axis holography . Appl. Opt. 2000 , 39 , 4070 – 4075 . doi: 10.1364/AO.39.004070.
- Leclercq , M.; Picart P. “Method for chromatic error compensation in digital color holographic imaging” . Opt. Express 2013 , 21 , 26456 – 26467 . doi: 10.1364/OE.21.026456.
- Colomb , T. ; Montfort , F. ; Kühn , J. ; Aspert , N. ; Cuche , E. ; Marian , A. ; Charrière , F. ; Bourquin , S. ; Marquet , P. ; Depeursinge , C. Numerical parametric lens for shifting, magnification, and complete aberration compensation in digital holographic microscopy. J. Opt. Soc. Am. 2006, 23, 3177–3190. doi: 10.1364/JOSAA.23.003177.
- Kühn , J. ; Colomb , T. ; Montfort , F. ; Charrière , F. ; Emery , Y. ; Cuche , E. ; Marquet , P. ; Depeursinge , C. Real-time dual-wavelength digital holographic microscopy with a single hologram acquisition . Opt. Express 2007 , 15 , 7231 – 7242 . doi: 10.1364/OE.15.007231.
- Fu , Y. ; Pedrini , G. ; Hennelly , B.M. ; Groves , R.M. ; Osten , W. Dual-wavelength image-plane digital holography for dynamic measurement . Opt. Lasers Eng. 2009 , 47 , 552 – 557 . doi: http://dx.doi.org/10.1016/j.optlaseng.2008.10.002.
- Tankam , P. ; Picart , P. Use of digital color holography for crack investigation in electronic components . Opt. Lasers Eng. 2011 , 49 , 1335 – 1342 . doi: http://dx.doi.org/10.1016/j.optlaseng.2011.05.018.
- Baumbach , T. ; Osten , W. ; von Kopylow , C. ; Jüptner , W. Remote metrology by comparative digital holography . Appl. Opt. 2006 , 45 , 925 – 934 . doi: 10.1364/AO.45.000925.
- Khodadad , D. ; Hällstig , E. ; Sjödahl , M. Shape reconstruction using dual wavelength digital holography and speckle movements . In SPIE Optical Metrology 2013b, pp. 87880I – 87880I . doi: 10.1117/12.2020471.
- Sjödahl , M. Accuracy in electronic speckle photography . Appl. Opt. 1997 , 36 , 2875 – 2885 . doi: 10.1364/AO.36.002875.
- Sjödahl , M. ; Hallstig , E. ; Khodadad , D. Multi-spectral speckles: Theory and applications, In SPECKLE 2012: V International Conference on Speckle Metrology, Wigo, Spain, Sep 10, 2012, pp. 841306–841306 . doi: 10.1117/12.981665.
- Sjodahl , M. Dynamic properties of multispectral speckles in digital holography and image correlation . Opt. Eng. 2013 , 52 ( 10 ): 101908 – 101908 .
- Yang , Y. ; Kang , B.-S. ; Choo , Y.-J. Application of the correlation coefficient method for determination of the focal plane to digital particle holography . Appl. Opt. 2008 , 47 , 817 – 824 . doi: 10.1364/AO.47.000817.
- Johansson , E.-L. ; Benckert , L. ; Sjodahl , M. Evaluation of phase objects by pulsed TV holography and defocused speckle displacement , SPIE - International Society for Optical Engineering, 2003, Optical Measurement Systems for Industrial Inspection III; Munich, Germany, May 28, 2003, pp. 556–561; doi:10.1117/12.500582 .
- Goodman , J.W. Introduction to Fourier Optics . Roberts and Company Publishers , McGraw-Hill : New York , 1968.
- Color versions of one or more of the figures in the article can be found online at www.tandfonline.com/uopt.