
ABSTRACT
A method and setup are proposed for trapping and detecting nanoparticles dispersed in a nanocomposite solution using periodically localized light generated by a subwavelength transmission grating. By numerical simulations, it is shown that there is an optimum duty ratio of the grating to produce the periodically localized light. Experimental results are presented for Au/γ-Fe2O3 composite nanoparticles having a diameter of 21.0 nm trapped on a silicon subwavelength rectangular grating and detected ellipsometrically. The technique should prove useful for evaluating optical and mechanical properties of nanocomposite materials.
Nomenclature
| λ | = | wavelength of trapping light |
| D | = | a period of grating |
| d | = | duty ratio of grating |
| h | = | depth of grating |
| Δ | = | phase difference of detection light |
| Ψ | = | amplitude ratio of detection light |
| α | = | normalized Fourier coefficient |
| β | = | normalized Fourier coefficient |
| A1 | = | integrated light intensity when analyzer rotate from 45° to 90° |
| A2 | = | integrated light intensity when analyzer rotate from 90° to 135° |
| A3 | = | integrated light intensity when analyzer rotate from 135° to 180° |
| A4 | = | integrated light intensity when analyzer rotate from 180° to 225° |
| P | = | power of trapping light |
| I | = | light intensity of periodically localized light in FDTD simulation |
| I0 | = | light intensity of trapping light in FDTD simulation |
1. Introduction
Nanocomposite materials have many interesting applications, particularly for photonic devices, by taking advantage of their novel optical and mechanical properties[Citation1–Citation3]. Since their refractive index, and scratch and abrasion resistance, among other properties, can be controlled, they have widespread industrial potential. In order to fully evaluate their optomechanical properties, it is desirable to deposit the nanostructures on a substrate in an aligned manner. In the present article, a method is proposed to extract numerous nanoparticles from a nanocomposite solution and to detect them simultaneously.
The nanocomposite materials are usually made by dispersing a large number of nanoparticles in a solution homogenously. However, it is difficult to evaluate the optical and mechanical properties of such liquid-phase materials due to aggregation of the nanoparticles. On the other hand, a dynamic scattering method would only provide information on the size distribution of the particles if one knew the shapes of the particles[Citation4].
Therefore, it is necessary to prepare a nanostructure on an appropriate substrate by orienting the particles. Such a nanostructure has to be formed without contact so that the particles are not altered, and be detected with high sensitivity. One method to manipulate the nanoparticles is to use an optical trapping technique[Citation5]. Optical tweezers have become a popular tool for noncontact trapping of macromolecules, polymers, and biological particles. The technique traps submicron particles by light radiation pressure that generates a gradient force. When the trapping light is incident on a transparent nanoparticle, the particle is attracted in the direction of the gradient force toward the focal point. However, this technique cannot be used to trap a large number of nanoparticles at a time because a tightly focused laser beam is required, thus the trapping volume is small, where only a few particles are selectively manipulated.
A new technique can trap a large number of DNA strands using localized evanescent light[Citation6]. However, a large volume is required to trap many nanoparticles[Citation7]. Therefore, a periodically localized evanescent light generated on a subwavelength grating was considered. By using a subwavelength transmission grating having a period shorter than the wavelength of the incident light, the trapping region can be enlarged. High-order diffracted light that cannot propagate into the surrounding medium forms a periodically localized optical field near the surface of the grating. Nanoparticles are trapped and oriented on this subwavelength grating, depending on the strength of the periodically localized light, so that they can be readily detected. The trapped particles can be measured ellipsometrically with high sensitivity. Using ellipsometry, monodisperse silica particles of 25-nm diameter at an oil-water interface have been reported[Citation8].
2. Principles
2.1. Trapping nanoparticles by periodically localized light
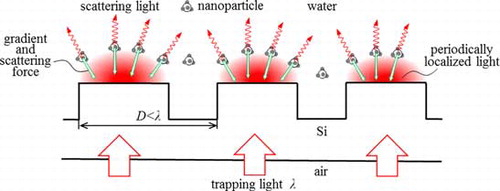
presents a schematic that explains the principle behind trapping nanoparticles by periodically localized light. A rectangular silicon transmission grating with a period of D is illuminated by an optical plane wave from below. The period D is shorter than the wavelength λ, so that high-order diffracted components cannot propagate upward to form an evanescent field on the top surface of the grating. Instead the evanescent light is periodically localized. If the surface of the grating is in contact with a nanosolution, particles in it will be attracted to and trapped by the modulated localized light because two trapping forces are generated; one due to optical radiation pressure and the other to the gradient force[Citation9]. The optical radiation pressure arises from the difference in the refractive indices of a nanoparticle and its medium. When a nanoparticle comes into contact with localized light, the optical field begins to propagate by scattering and it travels through the particle by refraction. As a result of conservation of momentum, a radiation pressure is thereby exerted on the nanoparticle. On the other hand, the gradient force is generated by the interaction between the spatial gradient of the electric field strength of the periodically localized light and the electric dipole of the nanoparticle induced by that light. Overall, the vector sum of these two forces periodically traps the nanoparticles on the surface of the subwavelength grating.
Figure 1. Schematic explaining the principle of the trapping of nanoparticles by periodically localized light generated on a subwavelength grating of period D < λ, where the wavelength of the incident light is λ.
2.2. Detection of the trapped nanoparticles
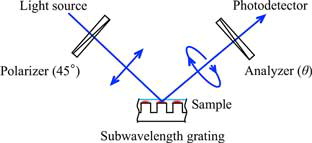
illustrates the scheme for detecting the nanoparticles trapped on the grating. A rotating-analyzer ellipsometer is employed, consisting of a light source, a polarizer, the sample, an analyzer, and a photodetector. The orientation of the transmission axis of the polarizer is fixed at 45°, and the intensity of the light reflected from the sample is measured as a function of the angle of the rotating analyzer. The two ellipsometric parameters, namely the phase difference Δ and the amplitude ratio Ψ, are given by[Citation10]
Figure 2. Ellipsometric scheme for detecting nanoparticles trapped on a subwavelength grating.
3. Experimental setup
shows the experimental setup for the optical trapping and detection which consists of an optical trapping unit, a detection unit, and a sample stage control unit. The light source is a laser diode (model PJ980P330 J-FC/APC-SP from Thorlabs) with emission wavelength λ = 980 nm and maximum output power P = 330 mW. The laser light is collimated and magnified to a diameter of ϕ = 3.5 mm by the pair of lenses L1 and L2, and then focused onto the bottom of an n-type silicon subwavelength grating (from Mitsubishi Materials Electronic Chemicals), having a thickness of 0.5 mm and orientation of <100>, by an oil-immersion objective lens (model CDI4390 from Nikon) with a 100 × magnification factor and a numerical aperture (NA) of 1.25. Three kinds of silicon subwavelength gratings are used with duty ratios d of 0.650, 0.675, and 0.700 fabricated by electron beam lithography. The cross section of each grating is examined by a secondary electron microscope. Each shape is nearly rectangular. The number of grooves is 1230 lines/mm and the depth of the grooves is h = 490 nm, corresponding to D = 0.83λ and h = 0.5λ at λ = 980 nm.
Figure 3. Optical setup of the trapping and detection system.
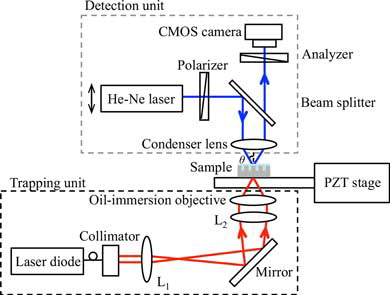
The detection unit consists of a probe light source, a polarizer, a beam splitter, a wide-diameter condenser lens, an analyzer, and a CMOS camera. The source is a He-Ne laser with λ = 632.8 nm and P = 0.5 mW. The light transmitted through the polarizer (model LPVIS100 from Thorlabs having an extinction ratio of 10−4) is reflected by the 50/50 beam splitter and focused onto the surface of the grating by a condenser lens (model CDI4391 from Nikon with a focal length of f = 5 mm and an NA of 0.9). It is then reflected back to the same condenser lens, and finally fed into a CMOS camera (model DMK21BCU03 from The Imaging Source having a resolution of 640 × 480 and a pixel size of 6.0 × 6.0 μm) through the analyzer (of the same model as the polarizer). The incident angle θ of the probe light is adjusted by shifting the position of the He-Ne laser vertically. By rotating the transmission axis of the analyzer, the polarization state of the reflected light can be obtained by the ellipsometric method. Since the power of the probe light is thirty times lower than that of the trapping light, it does not disturb the trapping of the nanoparticles. In order to obtain a two-dimensional x-y image of the sample and to make fine adjustments along the z-axis, a three-axis PZT stage controller (model MAX301/M from Thorlabs) is used with a step size of 20 nm.
The nanocomposite sample prepared for a proof-of-principle experiment is a magnetic composite of Au/γ-Fe2O3 with a particle diameter of 21 nm at a concentration of 1.1 g/L, dispersed in an 0.5-mM aqueous solution of HAuCl4, γ-Fe2O3 nanoparticles of 1.0 g/L, polyvinyl alcohol of 10 g/L, and 2-propanol of 1.0 g/L. This solution is irradiated at room temperature by a γ-ray source of 60Co having a dose rate of 3 kGy/h for 6 hours[Citation12].
4. Results and discussion
4.1. Numerical simulations
The intensity distribution of the periodically localized light generated on the silicon subwavelength grating is numerically calculated by the finite-difference time-domain (FDTD) method[Citation13]. (a) presents the model used in the calculation. The upper part of the silicon grating is in contact with water. The relative permittivity of silicon and water at λ = 980 nm are 12.0 and 1.77, respectively. The period of the grating, the depth of the grooves, and the wavelength are D = 0.83λ = 810 nm, h = 0.50λ = 490 nm, and λ = 980 nm, respectively. The calculation area is 5.0 × 5.0 µm and the thickness of the grating substrate is 2.5 μm. The area is enclosed by a perfectly matched layer (PML) to avoid reflections. A 980-nm plane wave is incident on the surface of the grating from below. The reason that the depth of the grooves is chosen to be 0.5λ is that previous calculations indicate that h has no influence on the intensity distribution of the localized light if its value is in the range 0.1λ to 0.5λ. The illuminated region of the subwavelength grating in the experiment is 11.4 µm in diameter, which is wide enough that the incident light can be approximated as a plane wave.
Figure 4. Simulated relative light intensity distribution for subwavelength gratings. Panel (a) presents the FDTD model. Panels (b) to (g) are the results for the region inside the dotted square in panel (a) for the indicated duty ratios d.
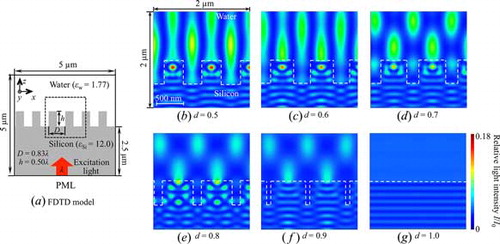
(b)–(g) show the relative light intensity I/I0 distributions calculated for various values of the duty ratio d ranging from 0.5 to 1.0. (The last value corresponds to a flat surface having no groove.) In each case, the electric field is squared and averaged over 300 computational steps, corresponding to a relative intensity averaged over time from 0 to 0.11 fs. During this time interval, the light wave travels from the bottom of the grating to the top boundary. In panels (b) through (f) one observes periodically localized light near the grooves, whereas only a uniform intensity pattern is seen in panel (g). However, in all six cases, standing waves occur below the surface of the grating due to reflections at the boundary between the grating and water. Except in panel (g), the standing wave pattern is distorted by diffraction from the grating. Above the grating, a bright and dark background pattern is observed. It arises from interference by the +1 and −1 order diffraction. The spatial intensity patterns directly above the surface of the grating suggest that the efficiency of the generation of localized light depends on d, even when the condition D < λ is satisfied.
graphs the relative light intensity I/I0 at z = 10 nm = 0.01λ (just above the grating) as a function of horizontal position x, for the values of d in . The intensity at the upper surface of the grating can thus exceed that at the lower surface. The intensity attains a maximum when d = 0.8 and therefore that grating is best for trapping nanoparticles.
Figure 5. Plot of the light intensity just above the grating as a function of distance along the x axis for various duty ratios d. The intensities are normalized relative to that of the incident light.
4.2. Optical trapping and ellipsometric detection
To verify the performance of the ellipsometric detection system and of the subwavelength grating, the structural anisotropy of the grating is measured. That is, the polarization depends on the spatial alignment of the grating, i.e., on whether the grooves are parallel or perpendicular to the incident light. A grating having d = 0.7 is used without nanocomposite solution on it. The polarization of the incident light is fixed at 45°, and the grating is rotated by angle α in the x-y plane from 0° to 180° in steps of 15°. When α = 0 and 90°, the direction of the grooves is perpendicular and parallel to the incident plane, respectively. As plotted in , the phase difference is Δ = 88.9° when α = 0°, it increases to a maximum value of Δ = 98.0° when α = 90°, and it then decreases back to Δ = 88.9° when α = 180°. This effect arises from the increased reflection of the s-polarized compared to the p-polarized component of the light at an angle of α = 90°.
Figure 6. The phase difference Δ and the amplitude ratio Ψ as a function of the rotation angle α of the subwavelength grating without any sample on it. When α = 90°, the grooves are perpendicular to the incident plane.
Next, the ellipsometric parameters of the nanocomposite solutions are measured by varying the incident light power for gratings with d = 0.650, 0.675, and 0.700 at α = 90°.The power of the trapping light is 27 mW in all cases. The left-hand graph in plots the dependence of the amplitude ratio Ψ on the trapping light power. It appears that it is difficult to detect nanoparticles based on the value of Ψ. The right-hand graph shows the dependence of the phase difference Δ on the power of the trapping light. When d = 0.650, the difference in the value of Δ for P = 27 mW and P = 0 mW is 0.04°. When d = 0.675 and 0.700, the differences are 0.02° and 0.05°, respectively. These differences may be due to structural changes in the grating when nanoparticles are trapped. However, significant changes in Δ do not occur until many nanoparticles are trapped. Based on Fresnel reflections, the change in Δ by 0.05° for d = 0.700 corresponds to an average film thickness of 0.04 nm, assuming that its refractive index is 2.61. In the illuminated volume, a thickness of 0.04 nm and an area of 100 µm2 implies that 850 nanoparticles (each 21 nm in diameter) are trapped.
Figure 7. Ellipsometric measurements of nanoparticles trapped on gratings having d = 0.650, 0.675, and 0.700. Panel (a) plots Ψ measured as a function of the incident light power P. Panel (b) graphs Δ measured as a function of P.
5. Conclusion
A method has been proposed for optically trapping nanoparticles in solution by periodically localized light generated by a subwavelength transmission grating. The particles are detected using an ellipsometric technique. Through numerical simulations based on FDTD analysis, the optimal duty ratio of the grating giving maximum intensity for the periodically localized light was found to be about 0.8λ. In experiments, Au/γ-Fe2O3 composite nanoparticles with a diameter of 21.0 nm were successfully trapped and changes in the phase difference Δ due to the trapped particles were measured. Since the method can manipulate many nanoparticles at a time, it should prove a useful tool for analysis of nanocomposite solutions.
References
- Hajji, P.; David, L.; Gerard, J.F.; Pascault, J.P.; Vigier, G. Synthesis, structure, and morphology of polymer–silica hybrid nanocomposites based on hydroxyethyl methacrylate. Poly. Phys. 1999, 37, 3172–3187.
- Sabzi, M.; Mirabedini, S.M.; Zohuriaan-Mehr, J.; Atai, M. Surface modification of TiO2 nano-particles with silane coupling agent; and investigation of its effect on the properties of polyurethane composite coating. Progress in Organic Coatings 2009, 65, 222–228.
- Omura, K.; Tomita, Y. Photopolymerization kinetics and volume holographic recording in ZrO2 nanoparticle-polymer composites at 404 nm. J. Appl. Phys. 2010, 107, 1.
- Pecora, R. Dynamic light scattering measurement of nanometer particles in liquid. J. Nanoparticle Res. 2000, 2, 123–131.
- Ashkin, A.; Dzidzic, J.M.; Bjorkholm, J.E.; Chu, S. Observation of a single-beam gradient force optical trap for dielectric particles. Opt. Lett. 1986, 11, 288–290.
- Yang, A.H.J.; Moore, S.D.; Schmidt, B.S.; Klug, M.; Lipson, M.; Erickson, D. Optical manipulation of nanoparticles and biomolecules in sub-wavelength slot waveguides. Nature 2009, 457, 71–75.
- Mellor, C.D.; Bain, C.D. Array formation in evanescent waves. Chem. Phys. Chem. 2006, 7, 329–332.
- Binks, B.P.; Clint, J.H.; Dyab, A.K.F.; Fletcher, P.D.I.; Kirkland, M.; Whitby, C.P. Ellipsometric study of monodisperse silica particles at an oil-water interface. Langmuir 2003, 19, 8888–8893.
- Lester, M.; Vesperinas, M.N. Optical force on microparticles in an evanescent laser field. Opt. Lett. 1999, 24, 936–938.
- Nguyen, N.V.; Pudliner, B.S.; An, I.; Collins, R.W. Error correction for calibration and data reduction in rotating-polarizer ellipsometry: Application to a novel multichannel ellipsometer. J. Opt. Soc. Am. 1991, 8, 919–931.
- Niklasson, C.G.A.; Granqvist, C.G.; Hunderi, O. Effective medium models for the optical properties of inhomogeneous materials. Appl. Opt. 1981, 20, 26–30.
- Seino, S.; Konoshita, T.; Otome, Y.; Okitsu, K.; Nakagawa, T.; Yamamoto, T.A. Magnetic composite nanoparticle of Au/γ-Fe2O3 synthesized by gamma-ray irradiation. Chem. Lett. 2003, 32, 690–691.
- Oskooi, A.F.; Roundy, D.; Ibanescu, M.; Bermel, P.; Joannopoulos, J.D.; Johnson, S.G. MEEP: A flexible free-software package for electromagnetic simulations by the FDTD method. Computer Physics Communications 2010, 181, 687–702.