ABSTRACT
We studied the lateral forces arising during the vertical indentation of the cell membrane by an optically trapped microbead, using back focal plane interferometry to determine force components in all directions. We analyzed the cell-microbead interaction and showed that indeed the force had also lateral components. Using the Hertz model, we calculated and compared the elastic moduli resulting from the total and vertical forces, showing that the differences are important and the total force should be considered. To confirm our results we analyzed cells from two breast cancer cell lines: MDA-MB-231 and HBL-100, known to have different cancer aggressiveness and hence stiffness.
Nomenclature
| OT | = | optical tweezers |
| AFM | = | atomic force microscopy |
| BFP | = | back focal plane |
| QPD | = | quadrant photo diode |
| ECM | = | extra cellular matrix |
| Id | = | indentation |
| F | = | total force |
| Fz | = | vertical force |
| v | = | Poisson ratio |
| BD | = | bead displacement |
| k | = | trap stiffness |
| β | = | force angle with z-axis |
| α | = | force angle with x-axis |
| t | = | time |
| pN | = | pico newton |
| SD | = | stage displacement |
| 3D | = | 3 dimensional |
| E | = | elastic modulus |
1. Introduction
In the last two decades, cell mechanics has been acknowledged as a possible biomarker for numerous diseases, most importantly cancer[Citation1,Citation2]. The mechanical properties of a cell play a pivotal role in many cellular processes like cell motility, adhesion, cell division and proliferation[Citation3Citation4Citation5]. The cell continuously feels the mechanical changes in its microenvironment and alters its biochemical response accordingly. Cell mechanics play a significant role in tumorigenesis, cancer invasion, and metastasis[Citation6]. Metastasis is the most common cause of death in cancer patients and the main obstacle in cancer treatment[Citation7,Citation8]. The transient journey of metastatic cells from a primary tumor to the secondary sites exhibits a mechanical character[Citation9,Citation10]. Thus, studying the mechanical alterations that cancer cells acquire or induce in the surrounding environment (extracellular matrix (ECM)) at different level of aggressiveness is fundamental to elucidating cancer metastasis.
Microtubules, microfilaments and intermediate filaments are the main load bearing components of a cell cytoskeleton and give structural stability to the cell. These cytoskeletal constituents along with other cytoplasmic components account for the viscoelastic behaviors of a cell[Citation11]. Actin filaments are the most prominent components of cell cytoskeleton[Citation12]. The process of actin polymerization and depolymerization makes the cell responsive to external stress. The cell stiffness, a widely measured property for cell viscoelastic characterization, can be viewed at molecular level as actin/myosin perturbation and cytoskeletal deformation[Citation13]. Regarding cancer, it is widely accepted that cancer cells are softer than non-transformed cells while the tumor by itself is stiffer[Citation14,Citation15]. The cellular processes, which orchestrate cytoskeletal mechanical components, are sensitive to forces in the pN range. Therefore, this property is exploited to establish various biophysical techniques capable of generating forces and measuring the mechanical properties of cancer cells.
A variety of biophysical methods such as microplate or optical stretchers, micropipette aspiration, magnetic twisting, atomic force microscopy (AFM) and optical tweezers (OT) are being used to study mechanical nature of cells, as reviewed in[Citation2,Citation11]. In the past two decades, AFM and OT emerged as strong candidates to study cells cultured on substrates. These techniques offer a novel mechanism to probe the elasticity (stiffness) at different sites of the cell, using the same axial cell indentation scheme[Citation16Citation17Citation18Citation19]. In the AFM techniques, the forces range from 10 to 103 pN with a cantilever stiffness larger than 10 pN/nm. Although AFM is not a high throughput technique, it offers the advantage to measure and map with high spatial resolution the local elasticity of the cells in liquid media[Citation20]. However, there are some restrictions that limit its use in small force domain. The thermal noise of the cantilever in a liquid, which is of the order of tens of pN[Citation18], limits the minimum applied force. Furthermore, as an example, if the stiffness of the cantilever is 100 pN/nm (normally used in biological experiments), any small error in indentation of 1 nm will induce a force of 100 pN, which is critical for many of the biological processes. To overcome these limitations, OT can be employed to characterize cell mechanics at small forces (<10 pN). OT, in general, impart forces in the range of 10−1 −102 pN with a spring constant of 10−3 −1 pN/nm, which makes OT ideal for low mechanical force regimes[Citation21]. The higher sensitivity of OT over AFM lies in the different kinds of probes through which they apply forces. In the case of OT, the probe is a micron size bead held tightly in a laser trap[Citation22], which is more sensitive than a mechanical cantilever. Moreover, using OT one can also probe the cell laterally, as we also have shown recently by pulling membrane tethers and locally measuring the viscoelastic properties of the membrane[Citation23]. When analyzed with AFM in axial/vertical indentation, the cells show elastic modulus values even three orders of magnitude higher than those obtained with OT. This highlights the fact that the cells are sensitive to the applied forces and the loading rates (measured in N/s)[Citation24] because of their viscoelastic, inhomogeneous and anisotropic nature. Therefore, for characterization of different cell lines it is important to complement AFM vertical indentation measurements by OT measurements following the same scheme[Citation25Citation26Citation27].
In AFM and OT techniques, where the cells are indented axially for elasticity measurements, only the axial force is taken into account. We introduce here, the concept of total force which comprises both axial and lateral force components. Axial indentation in OT can be monitored using video tracking[Citation28] or a photo diode QPD[Citation26]. In both of these approaches, a trap bead is moved against the stationary cell and only the axial component of the force is monitored. We have previously demonstrated[Citation19] the axial indentation of a cell by moving the cell against the trapped bead while monitoring the axial as well as the lateral components of displacements using QPD. This mechanism is more reliable than the trap movement since it avoids possible drifts and changes in trap focusing size.
Since the cytoskeletal architecture is not uniform, the bead indentation is not perfectly axial even at the center of the cell. We monitored the lateral components of the bead displacement and found that indeed the indentation force was not perfectly axial. The axial force that accounts for cell vertical indentation appears to be just a component of the total force, applied to the cell. We propose an approach to calculate the total force generated during cell indentation and the direction of the indentation.
Following our previous work[Citation19], we have studied the elastic modulus of HBL-100 and MDA-MD-231 using OT with axial indentation and 3-D force monitoring mechanism. We have studied also the effect of lateral components of the applied force on elastic modulus that are being lost during most of the cell indentation experiments. The combination of axial and lateral components of the total force leads to a more accurate measurement.
2. Experimental approach and data analysis
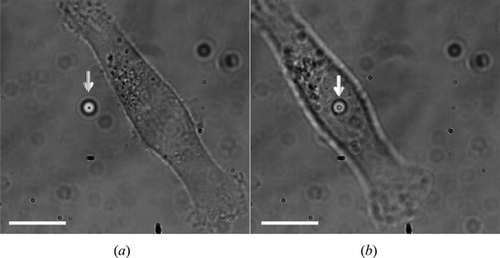
Cell stiffness, expressed by the elastic modulus, is measured locally by vertical indentation using a trapped microbead as probe. The relative position between the trapped microbead and the cell to be probed is shown in in two optical microscope images taken at two different instances before the measurement.
Figure 1. Optical microscope image of an HBL-100 cell and of a trapped microbead. (a) A microbead (indicated by the white arrow) is first trapped near the HBL-100 cell (cell is in focus) cultured on the coverslip; (b) the cell is displaced vertically and laterally to get the microbead in contact with the cell membrane (microbead is in focus). The scale bar represents 10 µm.
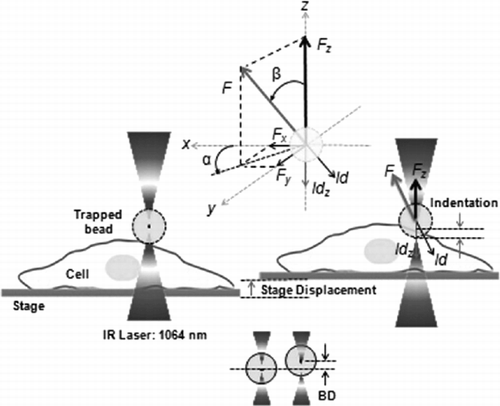
The experimental approach is illustrated in . The microbead is optically trapped above the cell, without touching it (left image). Then the stage is displaced vertically, first down and then up following one period of a sinusoidal wave (amplitude = 1 µm, period T = 5 s). When the cell intercepts the bead, it exerts a force causing a displacement BD of the bead from the trap equilibrium position. The bead also begins to push the cell, inducing an indentation Id in the cell membrane. Since the displacement of the stage, SD, is known, it means that by measuring the bead displacement BD one can easily derive the indentation Id as follows:
To measure the bead displacement we employed BFP interferometry[Citation29], which considers the interference pattern formed by the trapping laser beam scattered by the bead in the BFP of the microscope lens. Using a convergent lens, this pattern is imaged then on a QPD. The lateral displacement of the pattern corresponds to the lateral displacement of the bead, while the change of the fringe radius is related to the vertical displacement of the bead[Citation19]. The displacement of the bead in all the three directions can thus be measured with nanometer precision at tens of kHz. This allows tracking the small and fast position changes that characterize the thermal motion of the bead in the trap and its interaction with the cell.
The optical setup to implement this experimental approach has been described in detail in our recent paper[Citation19]. Here we will describe the procedure to calculate the local elastic modulus of the cell starting from the bead displacement data. Throughout the tracking of the bead in the trap, free of any other perturbation, we determine the trap stiffness, k, with its axial components k = (kx, ky, kz)[Citation22]. Since the bead in the trap behaves as in a harmonic potential well, the force F = (Fx, Fy, Fz) exerted on the bead is proportional to its displacement BD = (BDx, BDy, BDz):
So, measuring the bead displacement, BD, serves both to calculate the cell indentation, Id, and the force F, exerted by the bead on the cell. The force-indentation (F-Id) curve is then used to determine the elastic moduli, using the Hertz model[Citation26]:
Since the displacement of the stage is vertical, one expects the displacement of the bead to be also vertical. However, the experiments show that the bead is moving also laterally. This is due to the specific interaction of the bead with the cell, which is a soft body and has a non-uniform shape. As a consequence, the force exerted by the cell on the bead has a direction slightly deviated from vertical. The situation is similar for the indentation direction, as indicated in . Since with our setup we can measure bead displacements and calculate the force components in all the three directions, we analyze how much different the values calculated for the elastic modulus are when only the vertical component of the force is considered, with respect to the values obtained when the total force is considered.
The trapped bead is positioned at a small distance above the cell (left image: ). The stage (and hence the cell) is moved vertically to intercept the bead (right image: ). The force exerted by the bead on the cell produces the cell indentation. This force is determined from the displacement of the bead (down image: ). If the bead displacement is vertical, the force has only one component, Fz(upper image: ) and the indentation, Idz is only vertical. However due to the bead-cell interaction, the bead is displaced also laterally, which corresponds to lateral force components and hence the direction of the total force, F and of the indentation, Id are deviated from the vertical direction.
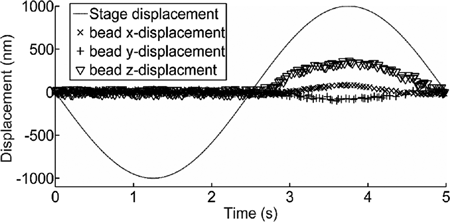
shows an example of the stage displacement together with the bead displacement in the trap during the vertical indentation experiment. The stage is set to follow a sinusoidal movement first vertically downward and then upward. In the first half of the period the cell moves off from the trap position and thus the microbead freely moves in the trap (Brownian motion). The tracking of the microbead displacement at high frequency (e.g., 10 kHz for ) allow us to calculate the trap stiffness k = (kx, ky, kz) considering the real experimental conditions. For instance, for the case shown in , using a laser power of 30 mW (at the sample plane) and a silica microbead with a radius r = 1.5 µm, we obtain a stiffness kx = ky = 0.02 pN/nm and kz = 0.015 pN/nm. These trap stiffness values confirm that the optical trap stiffness is lower vertically[Citation22]. For the second half of the period, the cell intercepts the microbead and pushes it up (, z (∇) until the stage/cell begins to move back to the initial position. However, even if the movement of the cell is only in the vertical direction, from the figure one can observe also lateral x and y displacements of the microbead.
Figure 3. Displacement of the stage (cell) and of the microbead in the trap during the experiment. The sinusoidal movement of the stage make the microbead displacements: in x, y and z. In the first half of the period, the cell moves down and hence the microbead moves freely in the trap. At the beginning of the second half of the period, when the cell intercepts the microbead and pushes it up, the displacement of the bead in z begins to be significant and it is accompanied by smaller lateral displacements in x and y.
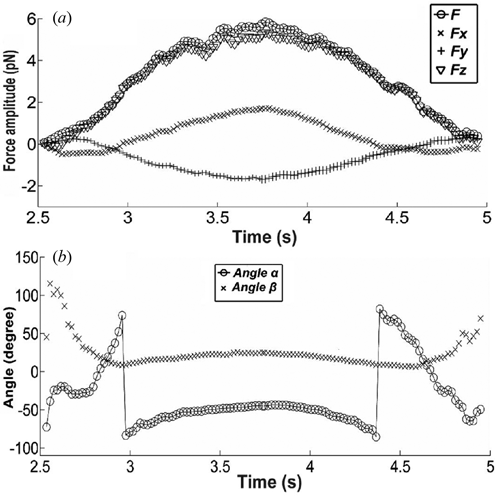
Using the force formula (2) we can calculate the force components, the total force and its orientation. The force amplitude and orientation are represented in . All the force components increase during the indentation and decrease during the retraction phase due to the cell-bead interaction. The total force F (◯) is however larger than the vertical force Fz (∇), due to the lateral components Fx(x) and Fy(+). The orientation of the total force is not vertical and changes considerably, as indicated by the excursion of α and β ((b)). The amplitude and direction fluctuations of the force indicate that the total force is a more adequate parameter than the vertical component only.
Figure 4. Force excursion vs time during the vertical indentation. (a) Total force F and force components: Fx, Fy and Fz; (b) The orientation of the total force F: angle α and angle β (angles defined in Figure 1).
The next step is to analyze the force-indentation curve. We assume that the indentation is the same for the two cases, total force and vertical force. The total force–indentation and vertical force–indentation curves are represented in . They are different mainly in the regions of minimum and maximum forces. To determine the elastic modulus from the force-indentation curve we select a range of forces going from the 0.1Fmax to 0.9Fmax, to eliminate the effect of force saturation. This prevents the need to define the point of contact during cell-bead interaction and excludes the last part of the stage movement. The procedure is similar to data processing in AFM experiments. The elastic modulus formula (3) can be expressed as a function of indentation Id:
Figure 5. Force-indentation curve for total force F, and the vertical force Fz. The dashed lines define the force range where the fit is applied.
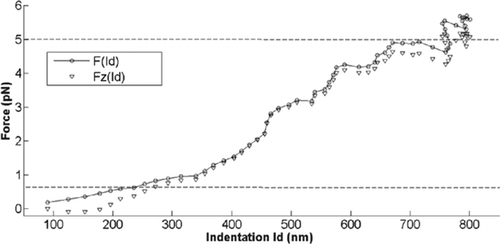
In section 3 we present cell preparation followed by results and discussion in section 4, where we will discuss the results obtained from measurements from two types of breast cancer cell lines: MDA-MB-231 (basal aggressive cancer cells) and HBL-100 (normal myoepithelial cells).
3. Cells preparation
HBL-100 is an immortalized human cell line, which was developed from the milk of a 27-year-old Caucasian woman with no evidence of breast cancer lesions[Citation30]. One the other hand, MDA-MB-231 is a basal breast cancer cell from metastasis. MDA-MB-231 and HBL-100 cell lines (ATCC numbers HTB-26, HTB-124 respectively) were cultured in adhesion using low glucose Dulbecco’s Modified Eagle Medium (DMEM) with L-glutamine (MDA-MB-231) or Roswell Park Memorial Institute (RPMI) 1640 medium with L-glutamine (HBL-100), all supplemented with 10% (v/v) Fetal Calf Serum, 50 IU/ml of penicillin- streptomycin and 1 mM gentamycin. Cell cultures were maintained in 25 cm 2 flasks at 37°C in 5% CO 2. Cell splitting was performed every 2–3 days, as soon as the cultures reached the confluence, using 1:10 diluted 0.05% trypsin-EDTA. Cells were seeded overnight on 30 mm glass-bottom Petri dishes at a density of 2.5 × 10⁵ cells/ml in 2 ml of medium, washed three times in PBS and rinsed with medium prior to each measurement session. All the reagents for cell culture were purchased from Gibco Life Technology. The cell culture flasks and petri dishes were purchased from Sigma-Aldrich.
4. Results and discussion
We investigated the elastic modulus of HBL-100 and MDA-MB-231 cell lines considering the optical tweezers indentation experiment described in section 2. In order to measure their elasticity, the cells were indented in the vertical direction by a 3 µm diameter silica bead that was held in the optical trap. The stage was then moved with a sine function with an amplitude of 1 µm and a period of 5 s. We considered indentation in the region above the nucleus in order to have a good reproducibility, as shown in for a representative HBL-100 cell.
By moving the cell against the trapped bead in the vertical direction, the bead displacements in axial and lateral directions were measured simultaneously by BFP interferometry. From the BD data, using Equation (2) we calculated the total force, F and its vertical component, Fz during the cell-bead interaction. As one can note from , due to the presence of lateral forces Fx and Fy, the total force F is different from the vertical component Fz. Assuming the indentation Id in vertical and that in the direction of the total force are equal and using the Hertz model and the linearized fitting procedure explained in section 2, we calculated then the elastic moduli corresponding to the total force F, and the vertical force Fz. We considered both the indentation and the retraction interactions between cell and bead (see ) and calculated the indentation elastic moduli Ei, and retraction moduli Er,
correspondingly. We measured and compared the elastic moduli of 10 cells from MDA-MB 231 cell line and of 10 cells from HBL-100 cell line. The cells from each type of cell line were selected from two different cultures prepared in different days. The obtained elastic modulus values are presented in .
Table 1. Elastic moduli of HBL-100 and MDA-MD-231 cells measured for indentation and retraction, resulting from the total and vertical forces; SD – standard deviation; cell number for each cell line n = 10.
As expected, the elastic moduli corresponding to the total force are bigger than those corresponding to the vertical force only, for both types of cells and for both indentation and retraction. The maximum difference between the mean value of the elastic modulus corresponding for total force and the elastic modulus corresponding to the vertical force is observed for HBL-100 cells. One can note from the standard deviation (SD), the values are quite dispersed. This is typical for local measurements on live cells due to the variability of the cells: each cell is different from the other cells. Therefore, a larger number of cells should be considered when the investigation will be performed to provide relevant statistical analysis for cancer cell mechanics. Nevertheless, the values from already indicate that HBL-100 cells are stiffer than MDA-MB-231 cells. This confirms the results of other studies reported in the literature[Citation14], which show that basal aggressive cancer cells are softer than the non-neoplastic cells.
summarizes the results (mean-values). For HBL-100 cell line, the elastic modulus is larger for indentation than retraction by 17% when calculated from the total force. However no significant difference is observed for the axial force (only 2%). For indentation, HBL-100 cells appear to be stiffer by 22% when the total force is considered than considering only the axial force component. For retraction the difference is smaller (7.8%). In case of MDA-MB-231 cells, the indentation and retraction values for elastic modulus for both total force and axial force are almost the same, indicating a clear elastic regime. Nevertheless for indentation, the elastic modulus calculated with the total force is 19% higher than that obtained from the axial force. Similarly, the value is about 16% higher for the total force than the axial force during retraction.
Figure 6. Elastic modulus values calculated for HBL-100 and MDA-MB-231 cells during (a) Indentation and (b) Retraction, using total force (F) and vertical force (Fz). (t-test: ***p < 0.001).
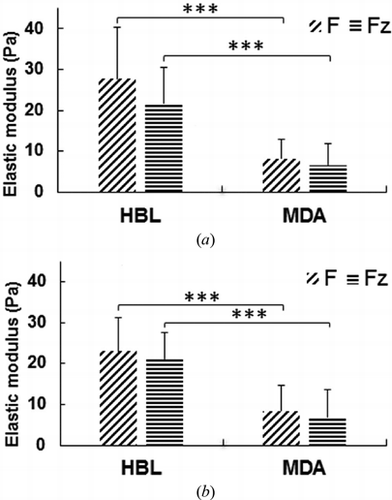
The elastic modulus calculated for HBL-100 cells is larger than MDA-MB 231 cells for both indentation and retraction when estimated for total force and axial force. These measurements confirm that the metastatic MDA-MB-231 cells are softer as compared to HBL-100 cells. On the other hand, both cell types appear to be stiffer when probed with total force. This gives evidence of the contributions of lateral forces in cell bead interaction. These results suggest that considering the lateral forces provides a more accurate measurement of the effective elastic modulus, allowing a better analysis of the cell mechanics. All our measurements have been performed on the top of the cell, in a region above the nucleus. In a recently published paper[Citation27], using also AFM measurements at different positions of the cell, we have indicated this region as the most reliable to make a comparison between different cell lines in terms of cell elasticity. However, we expect that the differences between the cell elasticity results obtained when the total forces are considered instead of the vertical forces, be considerably bigger in the transition regions between the nucleus and the leading edge. These aspects will be studied in detail in the next future by our group.
5. Conclusions
In this work, we used OT to study the effects of the lateral components of the forces on the elastic modulus of the cells. These lateral components are mostly ignored in many biophysical indentations experiments. We used the linearized Hertz model to calculate and compare the vertical and total indentations resulting from axial and total forces, respectively. We selected two breast cancer cell lines i.e. HBL-100 (transformed) and MDA-MD-231 (metastatic) and show that the interior architecture of the cells cytoskeleton influence the elastic modulus when we are in a low force regime. Our results show that MDA-MB 231 is softer than HBL-100 cells. Moreover, elastic modulus found from total force are larger than its vertical component, suggesting that for more rigorous analysis, the total force should be considered rather than only the vertical force.
Additional information
Funding
References
- Hanahan, D.; Weinberg, R.A. Hallmarks of cancer: The next generation. Cell 2011, 144, 646–674.
- Hoffman, B.D.; Crocker, J.C. Cell mechanics: Dissecting the physical responses of cells to force. Annual Review of Biomedical Engineering 2009, 11, 259–288.
- Cheng, G.; Tse, J.; Jain, R.K.; Munn, L.L. Micro-environmental mechanical stress controls tumor spheroid size; and morphology by suppressing proliferation and inducing apoptosis in cancer cells. PLoS one 2009, 4, e4632.
- Ladoux, B.; Nicolas, A. Physically based principles of cell adhesion mechanosensitivity in tissues. Reports on Progress in Physics 2012, 75, 116601.
- Fu, J.; Wang, Y.-K.; Yang, M.T.; Desai, R.A.; Yu, X.; Liu, Z.; Chen, C.S. Mechanical regulation of cell function with geometrically modulated elastomeric substrates. Nature Methods 2010, 7, 733–736.
- Mierke, C.T. The fundamental role of mechanical properties in the progression of cancer disease and inflammation. Reports on Progress in Physics 2014, 77, 076602.
- Jemal, A.; Bray, F., Center, M.M.; Ferlay, J.; Ward, E.; Forman, D. Global cancer statistics. CA: A Cancer Journal for Clinicians 2011, 61, 69–90.
- Siegel, R.; Ma, J.; Zou, Z.; Jemal, A. Cancer statistics, 2014. CA: A Cancer Journal for Clinicians 2014, 64, 9–29.
- Geiger, T.R.; Peeper, D.S. Metastasis mechanisms. Biochimica et Biophysica Acta (BBA)-Reviews on Cancer 2009, 1796, 293–308.
- Makale, M. Cellular mechanobiology and cancer metastasis. Birth Defects Research Part C: Embryo Today: Reviews 2007, 81, 329–343.
- Suresh, S. Biomechanics and biophysics of cancer cells. Acta Materialia 2007, 55, 3989–4014.
- Pollard, T.D.; Cooper, J.A. Actin, a central player in cell shape and movement. Science 2009, 326, 1208–1212.
- Ketene, A.N.; Roberts, P.C.; Shea, A.A.; Schmelz, E.M.; Agah, M. Actin filaments play a primary role for structural integrity and viscoelastic response in cells. Integrative Biology 2012, 4, 540–549.
- Wirtz, D.; Konstantopoulos, K.; Searson, P.C. The physics of cancer: the role of physical interactions and mechanical forces in metastasis. Nature Reviews Cancer 2011, 11, 512–522.
- Bissell, M.J.; Hines, W.C. Why don’t we get more cancer? A proposed role of the microenvironment in restraining cancer progression. Nature Medicine 2011, 17, 320–329.
- Andolfi, L.; Bourkoula, E.; Migliorini, E.; Palma, A.; Pucer, A.; Skrap, M.; Scoles, G.; Beltrami, A.P.; Cesselli, D.; Lazzarino, M. Investigation of adhesion and mechanical properties of human glioma cells by single cell force spectroscopy and atomic force microscopy. PLoS one 2014, 9, e112582.
- Li, Q.; Lee, G.; Ong, C.; Lim, C. AFM indentation study of breast cancer cells. Biochemical and Biophysical Research Communications 2008, 374, 609–613.
- Bodensiek, K.; Li, W.; Sánchez, P.; Nawaz, S.; Schaap, I.A. A high-speed vertical optical trap for the mechanical testing of living cells at piconewton forces. Review of Scientific Instruments 2013, 84, 113707.
- Yousafzai, M.S.; Ndoye, F.; Coceano, G.; Niemela, J.; Bonin, S.; Scoles, G.; Cojoc, D. Substrate-dependent cell elasticity measured by optical tweezers indentation. Optics and Lasers in Engineering 2016, 76, 27–33.
- Neuman, K.C.; Nagy, A. Single-molecule force spectroscopy: optical tweezers, magnetic tweezers and atomic force microscopy. Nature Methods 2008, 5, 491–505.
- Zhang, H.; Liu, K.-K. Optical tweezers for single cells. Journal of The Royal Society Interface 2008, 5, 671–690.
- Neuman, K.C.; Block, S.M. Optical trapping. Review of Scientific Instruments 2004, 75, 2787–2809.
- Tavano, F.; Bonin, S.; Pinato, G.; Stanta, G.; Cojoc, D. Custom-built optical tweezers for locally probing the viscoelastic properties of cancer cells. International Journal of Optomechatronics 2011, 5, 234–248.
- Chiou, Y.-W.; Lin, H.-K.; Tang, M.-J.; Lin, H.-H.; Yeh, M.-L. The influence of physical and physiological cues on atomic force microscopy-based cell stiffness assessment. PLoS ONE 2013, 8(10), e77384.
- Yehoshua, S.; Pollari, R.; Milstein, J.N. Axial optical traps: a new direction for optical tweezers. Biophysical Journal 2015, 108, 2759–2766.
- Nawaz, S.; Sánchez, P.; Bodensiek, K.; Li, S.; Simons, M.; Schaap, I.A. Cell visco-elasticity measured with AFM and optical trapping at sub-micrometer deformations. PLoS ONE 2012, 7(9), e45297.
- Coceano, G.; Yousafzai, M.; Ma, W.; Ndoye, F.; Venturelli, L.; Hussain, I.; Bonin, S.; Niemela, J.; Scoles, G.; Cojoc, D. Investigation into local cell mechanics by atomic force microscopy mapping and optical tweezer vertical indentation. Nanotechnology 2016, 27, 065102.
- Dy, M.-C.; Kanaya, S.; Sugiura, T. Localized cell stiffness measurement using axial movement of an optically trapped microparticle. Journal of Biomedical Optics 2013, 18, 111411–111411.
- Gittes, F.; Schmidt, C.F. Interference model for back-focal-plane displacement detection in optical tweezers. Optics Letters 1998, 23, 7–9.
- De Fromentel, C.C.; Nardeux, P.; Soussi, T.; Lavialle, C.; Estrade, S.; Carloni, G.; Chandrasekaran, K.; Cassingena, R. Epithelial HBL-100 cell line derived from milk of an apparently healthy woman harbours SV40 genetic information. Experimental Cell Research 1985, 160, 83–94.

