
ABSTRACT
This paper reports a micromirror-based real image laser automotive head-up display (HUD), which overcomes the limitations of the previous designs by: (1) implementing an advanced display approach which is able to display sharp corners while the previous designs can only display curved lines such as to improve the display fidelity and (2) Optimizing the optical configuration to significantly reduce the HUD module size. The optical design in the HUD is simulated to choose the off-the-shelf concave lens. The vibration test is conducted to verify that the micromirror can survive 5 g. The prototype of the HUD system is fabricated and tested.
Nomenclature
| ΔT | = | amount of time to scan through each segment |
| f | = | refreshing rate |
| N | = | total number of scanning points |
| LLshort | = | short length threshold for visible segments |
| LLlong | = | long length threshold for visible segments |
| LL′short | = | short length threshold for invisible segments |
| LL′long | = | long length threshold for invisible segments |
| n(i) | = | scanning point number of the ith segment |
| w(i) | = | point number weight factor for ith segment |
| J | = | total number of segments including both visible and invisible segments |
| K | = | coefficient of visible segment weight factor |
| K′ | = | coefficient of invisible segment weight factor |
| lvisible_max | = | maximum lengths of visible segments |
| linvisible_max | = | maximum lengths of invisible segments |
| l(i) | = | length of ith segment |
| LW1, LW2 and LW3 | = | parameters used to determine K |
| LW′1, LW′2, and LW′3 | = | parameters used to determine K′ |
| Pn(i) | = | the nth scanning point on ith segment |
| E(i) | = | extension length |
| Δtr | = | rise time of the micromirror when steering the laser beam across each segment |
| θ(i) | = | turning angle between i-1th segment to ith segment |
| LT | = | length threshold value |
| α and β | = | parameters used to control the extension length |
| E′(i)max | = | maximum extension for invisible segment |
1. Introduction
The automotive head-up display (HUD) is a driving aiding system displaying the critical driving information such as the speed and turning direction on or in front of the windshield through real or virtual image[Citation1,Citation2]. Thus, the driver does not need to lower his/her head to check the dashboard and therefore can have longer eyes-on-road time to improve the driving safety and comfort[Citation3,Citation4]. Studies have shown that using HUD, the driver’s response speed to emergency is 75–80% faster depending on the driving load[Citation5]. General motors first introduced HUD to passenger cars in late 1980s. A lot of other luxury cars started to be equipped with HUD afterward such as BMW, Audi, Mercedes-Benz, etc. HUD is becoming a major safety feature in automobiles. The HUD technology currently dominating the market is based on LCD’s virtual image type, which has not been widely used in general cars due to its high cost ($1000–1500) and bulky size (4 L). Microsystem technology and MEMS (microelectromechanical systems) micromirrors have been intensively developed in the past 2 decades and have found various applications due to its high integration, small size, and suitability for low-cost batch production[Citation6Citation7Citation8Citation9Citation10Citation11Citation12]. Micromirror-based laser vector scanning automotive HUDs were previously developed[Citation13Citation14Citation15Citation16] with the core component to be an electrostatic repulsive-force-driven micromirror[Citation17Citation18Citation19Citation20Citation21Citation22]. Micromirrors’ development has made significant progress with the major application in projectors[Citation23]. The micromirror automotive HUD significantly reduces the cost and size of conventional design by more than 10 times. The disadvantage of the micromirror-based HUD is that the distance between the image and the driver is shorter than that in a conventional HUD and subsequently the driver needs to adjust the focus slightly from the road to see the HUD image. This should be acceptable considering the huge benefits in size and cost reduction. However, there is still a lot of room for further improving the micromirror HUD’s performance, i.e., (1) The display method (it is named as generic display method hereafter) previously developed cannot display sharp corners. Instead, all sharp corners are curved in the display, which leads to low display fidelity; (2) The HUD module has a diode laser module which is positioned 45° with the output optical path to make sure the output beam is parallel with one cardinal direction of the device. Consequently, due to this configuration, the whole device has a relative large size. Thus there is a lot of room for further size reduction. This paper reports a micromirror-based HUD which has significant improvement over the previous designs such as to overcome the limitations, i.e., (1) implementing an advanced display approach which can display sharp corners to improve the display fidelity; (2) optimizing the optical configuration to significantly reduce the size. In addition, the optical design is simulated to help choosing the concave lens, and the vibration test is conducted to verify the micromirror can survive the vibration of a traveling vehicle on various road conditions.
In Section 2, the working principle of the micromirror-based real image laser HUD is introduced. The advanced display approach is explained in Section 3. The optical design of the HUD is simulated in Section 4 and the vibration test is given in Section 5. Section 6 shows the prototype and the display results of the advanced display approach. Conclusions are summarized in Section 7.
2. Micromirror-based real image laser automotive HUD
As shown in , laser beam shoots onto the micromirror plate which reflects and steers the laser beam to a translucent film attached on the windshield. The laser is modulated to be turned on and off with high frequency such that it is on when the micromirror scans the laser beam following the information pattern (the red pattern in ) and off when scanning through the transitional line (blue lines in ). The micromirror periodically steers the laser beam to trace the vector graphics of the critical driving information such as the speed, route, car location, and turning direction in with a refreshing rate larger than 30 Hz. With that refreshing rate, a steady laser pattern can be formed. A double-side concave lens is used to: (1) compensate for the convergence of the laser beam reflected by the micromirror plate due to its curvature; (2) amplify the scanning angle of the micromirror. By controlling the quasi-static 2D rotation of the micromirror and modulating the laser, the laser beam can realize a vector display showing driving critical information as shown in .
Figure 1. Laser pattern formation through micromirror vector scanning and its application in HUD.
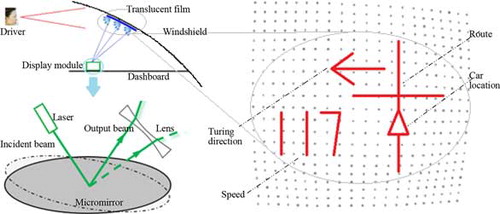
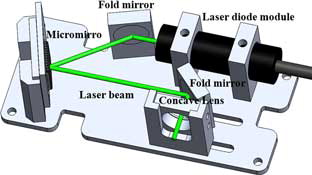
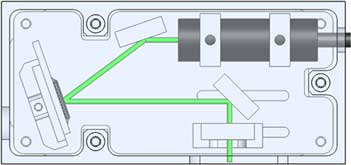
The HUD is composed of a laser diode module, a micromirror, a double concave lens and twofold mirrors as shown in . The micromirror is described in Ref.[Citation14]. In the micromirror, four actuators drive a circular mirror plate of 1 mm diameter. The four actuators are independently controlled to realize quick 2D rotation of the mirror plate.
Figure 2. Micromirror-based HUD display module.
The challenges for the micromirror-based HUD lie in: (1) the output light power should be >0.1 mW, so that it is bright enough when projected on the film attached to the windshield; (2) the optical scanning angle should be >10° to have large display area; (3) the quasi-static scanning speed needs to be high, i.e., the settling time from 0 ∼ 1° mechanical rotation before amplification should be in the range of a few milliseconds, to display speed information and simple map with the refreshing rate of ≥30 Hz; and (4) being able to display patterns with sharp corners which are needed for legibly showing numbers.
3. Advanced display approach
3.1. Generic display approach
A generic display approach has been developed previously to control the 2D rotation of the micromirror which steers the laser beam to any desired position on the display film. There are 3 steps in the generic display approach:
Step (1) calibration: the relationship between the location of the steered laser spot on the display film and the four driving voltages (four actuators) needed to drive the micromirror to move the laser spot to that location is to be established. Various combinations of voltages are applied to the micromirror and the corresponding laser spot on the display screen is recorded. One example of the calibration pattern is shown as the grey dots in . Thus the relation between the location of an arbitrary point on the display screen and the corresponding driving voltages is established. Driving voltages to move the laser spot to any location other than the calibrated points can be obtained through linear interpolation.
Step (2) point allocation and voltage extraction: Points (>100 ∼ few hundreds) are allocated along the display information pattern evenly. The 4 voltages corresponding to each point are obtained from the calibration.
Step (3) scanning: driving the micromirror periodically by the sequential voltages obtained in (2) with a certain refreshing rate.
Hence a steady laser pattern showing critical driving information is formed. Experiments showed that the generic display approach cannot display patterns with sharp corners without losing fidelity, since the scanning speed is not fast enough, i.e., micromirror’s response lags behind the driving signal. It curves the sharp corners as shown in Refs.[Citation13Citation14Citation15Citation16]. However, in a HUD system, numbers for speed, arrow for tuning direction, and triangle showing the current car location are preferred to be formed with straight lines and sharp corners, so that they are very legible as shown in . A low fidelity display is generated when using the previously developed generic display approach. Hence an advanced display approach is highly desired, which leads to faster scanning speed and is able to display sharp corners such as to achieve high display fidelity.
Figure 3. Elementary patterns of the HUD display information.
3.2. Advanced display approach
The advanced display approach consists of the similar three steps as the previously developed generic display approach, i.e., (1) calibration, (2) scanning point allocation, and (3) voltage extraction, and scanning. The difference lies in the second step. Instead of distributing scanning points evenly on the display lines as is the case of generic display approach, scanning points are distributed unevenly according to the following method, which is expressed in two parts, i.e., determination of the number of points on each segment and point distribution.
3.2.1. Number of points on each segment
The variables are defined as follows to explain the determination of the number of points on each segment.
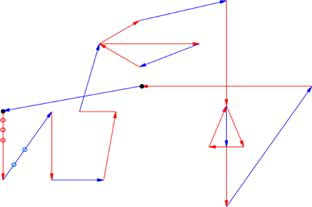
Visible segment: straight line between two turning/corner points of information pattern, as the red lines shown in .
Invisible segment: transitional line connecting two unconnected visible segments as blue lines shown in .
Scanning points: points on the display pattern, by scanning through which the display pattern is formed, shown as the circles on the line of “1” in , which schematically shows a few examples of scanning points on two segments.
Figure 4. Information display pattern, in which red lines are information pattern and blue ones are transitional line.
Visible section: Section between two neighboring scanning points on visible segment.
Invisible section: Section between two neighboring scanning points on invisible segment. The micromirror steer laser beam to scan through points on each segment sequentially, i.e., section by section with the same time interval. The time interval is defined as:
l(i) is the length of ith segment. LW1, LW2, and LW3 are parameter values for visible segment. ,
, and
are parameter values for invisible segment. The determination of above parameters is to be explained in Section 3.3.3:
3.2.2. Point allocation
Normally each segment contains at least several scanning points. Assuming on ith segment, there are n(i) scanning points P1, P2, … Pm, … Pn(i)−2, Pn(i)−1, Pn(i) as shown in , which shows an example of a segment with 6 scanning points assuming the scanning point number has been determined in the last section. Pn(i)−1 is on the extension of the segment. Points P1, to Pn(i)−2 are evenly distributed between the two points P1 and Pn(i)−1, such that the voltage interval between two neighboring points is larger than that of the case when the same number of points are evenly distributed between P1 and Pn(i) as is the case of previously developed generic display approach. Hence, the exact scanning point distribution depends on the distance between Pn(i) and Pn(i)−1, which is defined as the extension length E(i).
Figure 5. Scanning point distribution.
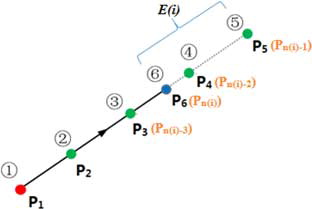
Each point corresponds to one combination of four voltages applied to the four actuators to drive the micromirror. The voltages are determined according to the calibration. If Δtr is the rise time of the micromirror when steering the laser beam across each section, ΔT according Eq. (1) is designed to be smaller than Δtr,
3.3.3. Determination of parameters
There are 15 parameters in the advanced display approach, i.e., LLshort, LLlong, LW1, LW2, LW3, ,
,
,
,
, LT, N, α, β, E′(i)max. Thus far an optimization algorithm has not been developed to find out the best values for above 15 variables. Instead those parameters are determined following the guidance of the Eqs. (1)–(8) and trial and error method according to a large number of experiments. The chosen values may not be the optimized ones. Experimental results are used to verify them, i.e., being able to display the required critical driving information (speed, turning direction and car location as shown in ) with the fidelity much better than that of the previous generic display approach, since the HUD information has definite number of combinations based on the elementary display units such as 10 numbers, arrows, triangles, and straight lines as shown in . It is possible to experimentally exhaust all main combinations, which are the most difficult to display in terms of causing distortion and time consuming. The chosen values are listed in . The experimental results are presented in Section 5.
Table 1. Parameters of the advanced display approach.
4. Optical design of the HUD
A collimated laser beam is generated by the laser diode module and directed by a fold mirror to shoot onto the micromirror as shown in . The scanning pattern generated by the micromirror is reflected by the second fold mirror and then pass through a concave lens.
Figure 6. Optical design of the HUD.
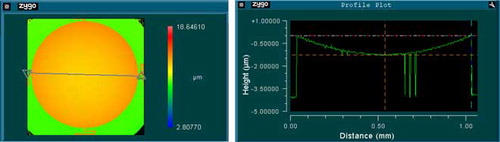
The double concave lens is used for two objectives: (1) compensating for the curvature of the micromirror; and (2) amplifying the scanning angle of the laser beam coming out of the micromirror. A double concave lens was empirically used previously in Fan & He (2016), Fan et al. (2015), Chong et al. (2012), and Fan et al. (2011) based on a lot of trials. No model has been established to choose the three parameters of the concave lens, which are (1) the distance from the double concave lens to the micromirror, (2) radius, and (3) thickness of the concave lens. The optical model and then the concave lens’ parameters are simulated in this paper using Zemax[Citation24]. The following inputs are used in the simulation: (1) 1 mm is the diameter of the micromirror plate; (2) 125 mm is the radius of curvature of the micromirror which is measured using a 3D optical surface profiler as shown in . The radius of the curvature varies in the range 90–135 mm with different prototypes due to the variation in the micro fabrication process. shows the measurement of one prototype using the 3D profiler; (3) 200 mm is the distance between the display screen to the concave lens, which is similar to the distance between the HUD to the windshield in reality. The shape of the displayed pattern is not very sensitive to the small distance variation since the output laser beam is well collimated; and (4) mechanical scanning angle of the micromirror is ±1.5°.
Figure 7. Profile of the micromirror plate.
Concave lens with diameters of 9 and 12 mm are simulated in Zemax as shown in . Two criteria are used to choose the lens. The first is the small average divergence angles of the laser beam at tilt angles of +1.5°, 0°, and −1.5° to ensure the collimation of the laser beam coming out of the lens. Smaller geometric radius of the spots on the image plane means smaller divergent angle. The second criterion is the large amplification of the scanning angle of the laser beam. It leads to a larger image on the display screen. A larger scanning line-distance on the image plane indicates a larger amplification. The parameters of the most common off-the-shelf double concave lenses are used in optical simulations. The simulation results are listed in , which show that the lens with parameter 12 × −12 mm (diameter × focal length) is the most suitable one according to the above two criteria. Its amplification factor is estimated to be 5.7. However, since the actual micromirror curvature and the distance of the lens from the micromirror changes, this factor may vary in the range from 3 to 6. The lens distance to the micromirror is designed to be adjustable. For batch production, micromirrors need to be classified into various groups according to the radius of curvature of the mirror plate, such that lens with different parameters and distances are used for different micromirror groups, to achieve the same amplification factor for all HUDs.
Figure 8. Simulation of the concave lens.
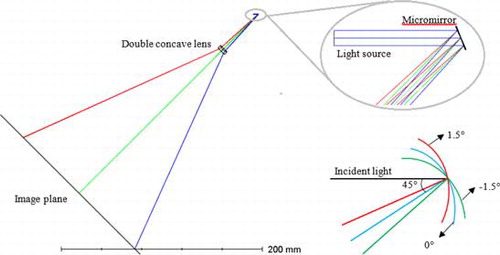
Table 2. Optimization of concave lens.
5. Vibration test of the micromirror
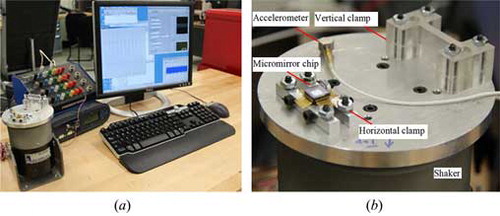
It is important to find out under how much vibration the micromirror can still survive considering it has thin supporting beams (2 µm thick) and large lateral dimension (1 mm mirror plate and approximately 3.5 × 3.5 mm of overall size including actuators and supporting springs). The micromirror vibration test is conducted using the setup shown in . An aluminum circular plate with two clamp fixtures is used to fix the micromirror. The plate is attached to a shaker. The two fixtures are used to fix the micromirror horizontally and vertically, respectively. Before the vibration test, the performance of the micromirror is tested first. It is driven to steer the laser beam to form a few straight lines which are marked on a screen. After each vibration test which last for about 30 s, the micromirror is taken off the shaker and applied the same voltages to try to scan the same straight lines marked on the screen. If the scanned laser line matches the marked line, it is proceeded to test the micromirror with higher acceleration level. The same vibration test is performed in both horizontal and vertical directions of the micromirror by mounting it on the two fixtures. The maximum acceleration without affecting the micromirror’s performance is 5 g. Further vibration test will be conducted in the future when the voltage is applied to the micromirror.
Figure 9. Vibration test. (a) Micromirror vibration test system (b) Micromirror on the shaker.
6. HUD prototype and test results
6.1. HUD module
The prototype of HUD is shown in . The micromirror is packaged in a CQFP44 chip and is soldered on a small PCB board for wire connection, which is described in Ref.[Citation14]. There is an antireflective (AR) coated glass bonded on the top of the CQFP44 chip to seal the micromirror. According to the optical simulation using Zemax, the 9 × −12 mm double concave lens has similar performance with 12 × −12 mm lens while having a smaller size. As a result, it is used in the prototype to help achieve a smaller device profile. Using twofold mirrors, the laser beam before and after the micromirror is parallel rather than at 45° angle such as to save the space wasted in the previous configuration in Ref.[Citation13Citation14Citation15Citation16]. The HUD’s enclosure top is covered by a black tape to avoid the reflection of HUD module by windshield. The overall dimension of the HUD module (without control circuit) is 84 mm × 40 mm × 35 mm. Compared to the previously developed HUD module, the size has been significantly reduced.
Figure 10. HUD system. (a) Micromirror HUD mounted on dashboard. (b) Display pattern by HUD. (c) Prototype of micromirror HUD display module.
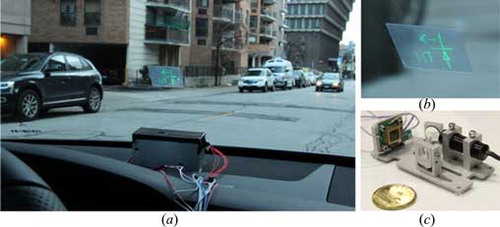
A real image HUD is constructed as shown in . The HUD module is facing toward the windshield and can be positioned either on the dashboard or buried under it. A translucent film is attached on the inner surface of the windshield with a diffuse-reflective transparent film stacked on top of it to partial diffuse-reflect the laser pattern. As a result, the pattern can be observed from a large viewing angle. The display film needs to be improved to reflect more light since the pattern becomes less visible when the outside light is strong. Further research on this is ongoing.
6.2. Display result comparison
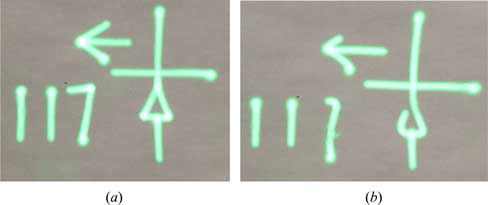
Both the previously developed generic and the presently proposed advanced display approaches are applied to display the HUD information with the refreshing rate from 30 to 50 Hz, as shown in . It can be observed that sharp corners can be well displayed by the advanced display approach such as those in digit “7” and the triangle shape. However, the corners are all rounded when using generic display approach. With the refreshing rate increase, it can be concluded that the display results using the generic display approach deteriorate significantly. However, the advanced display approach has the flexibility to adjust the design parameters to obtain good quality displays under different refreshing rates (especially in high frequencies), which cannot be achieved using generic display approach.
Figure 11. Display in 30 Hz. (a) Advanced display approach. (b) Generic display approach.
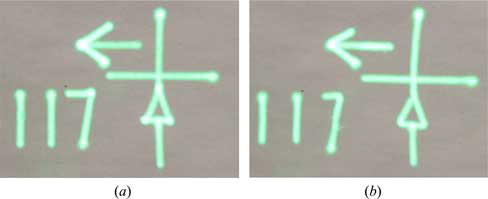
Figure 12. Display in 40 Hz. (a) Advanced display approach. (b) Generic display approach.
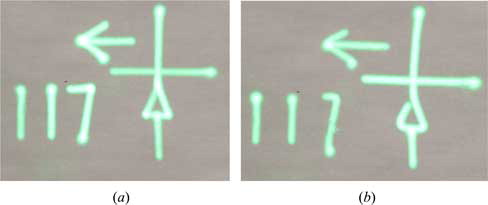
Figure 13. Display in 50 Hz. (a) Advanced display approach. (b) Generic display approach.
In traditional HUDs, there is no problem of accurately displaying sharp corners. But its price and size are the serious limitations in comparison to micromirror-based HUD, which is more than one order of magnitude superior in size and cost. Other vector scanning micromirror HUD uses extra filter/controller to increase the response speed of the micromirror to be able to display sharp corners[Citation25].
7. Conclusion
This paper reported an improved design of micromirror-based real image laser automotive HUD, which implements an advanced display approach to improve the display fidelity. In addition, the HUD has an optimized optical configuration to reduce the size significantly in comparison to previous designs. The vibration test has been conducted to verify that the micromirror can survive 5 g acceleration. The prototype of the HUD system is fabricated and tested.
References
- Okabayashi, S. Visual Optics of Head-Up Displays (HUDs) in Automotive Applications, 1st ed., Taylor & Francis: Philadelphia, PA, 1996.
- Chu, K.-H.; Brewer, R.; Joseph, S. Traffic and Navigation Support through an Automobile Heads Up Display (A-HUD), Technical Report, Information and Computer Sciences Dept., Univ. of Hawaii at Manoa, 2008.
- Kiefer, R. Quantifying head-up display (HUD) pedestrian detection benefits for older drivers. In Proceedings of 16th International Technical Conference on the Enhanced Safety of Vehicles. Windsor, NHTSA, 1998, pp. 428–437.
- Ablajimeier, M.; Poitschke, T.; Bengler, F.W.K.; Rigoll, G. Eye gaze studies comparing head-up and head-down displays in vehicles. In Proc. of ICME., IEEE, 2007; pp. 2250–2252.
- Liu, Y.-C.; Wen, M.-H. Comparison of head-up display (HUD) vs. head-down display (HDD): driving performance of commercial vehicle operators in Taiwan. International Journal of Human-Computer Studies, 2004, 61(5), 679–697.
- Tao, X.; Cho, H. Variable view imaging system: An optomechatronic system for the observation of micro objects with variable view direction. International Journal of Optomechatronics, 2009, 3, 91–115.
- Tao, X.; Cho, H. Increasing the visibility for observing micro objects with the variable view imaging system. International Journal of Optomechatronics, 2012, 6, 71–91.
- Pan, C.; Liao, W. A new two-axis optical scanner actuated by piezoelectric bimorphs. International Journal of Optomechatronics, 2012, 6, 336–349.
- Bai, Y.; Yeow, J.; Wilson, B. A Characteristic study of micromirror with sidewall electrodes. International Journal of Optomechatronics, 2007, 1, 231–258.
- Espinosa, A.; Rabenorosoa, K.; Clévy, C.; Komati, B.; Lutz, P.; Zhang, X.; Samuelson, S.R.; Xie, H. Piston motion performance analysis of a 3DOF electrothermal MEMS scanner for medical applications. International Journal of Optomechatronics, 2014, 8, 179–194.
- Wu, Z.; Li, Y.; Wang, P.; Liu, M. Dynamic head-disk interface modeling and adaptive control of a hybrid actuator for optical data storage systems. International Journal of Optomechatronics, 2015, 9, 62–88.
- Kudryavtsev, A.; Laurent, G., Clévy, C.; Tamadazte, B.; Lutz, P. Analysis of CAD model-based visual tracking for microassembly using a new block set for MATLAB/Simulink. International Journal of Optomechatronics, 2015, 9, 295–309.
- Fan, C.; He, S. Micromirror based virtual image automotive head-up display. Microsystem Technologies, 2016, pp. 1–6. Available at: https://doi.org/10.1007/s00542-016-2955-7.
- Fan, C.; He, S. A two-row interdigitating-finger repulsive-torque electrostatic actuator and its application to micromirror vector display. Journal of Microelectromechanical Systems, 2015, 24(6), 2049–2061.
- Chong, J.; He, S.; Mrad, R.B. Development of a vector display system based on a surface-micromachined micromirror. IEEE Transactions on Industrial Electronics, 2012, 59(12), 4863–4870.
- Fan, C.; He, S.; Chong, J.; Mrad, R.B.; Feng, L. Development of a micromirror based laser vector scanning automotive HUD. In IEEE International Conference on Mechatronics and Automation, IEEE: Beijing, China, 2011; 75–79.
- He, S.; Mrad, R.B. Development of a novel translation micromirror for adaptive optics. In Proc. of SPIE., SPIE: Providence, RI, 2003, pp. 154–161.
- He, S.; Mrad, R.B. Large-stroke microelectrostatic actuators for vertical translation of micromirrors used in adaptive optics. IEEE Transactions on Industrial Electronics, 2005, 52(4), 974–983.
- He, S.; Mrad, R.B. Design, modeling, and demonstration of a MEMS repulsive-force out-of-plane electrostatic micro actuator. Journal of Microelectromechanical Systems, 2008, 17(3), 532–547.
- He, S.; Chang, J.S. Experimental verification of an out-of-plane repulsive-force electrostatic actuator using a macroscopic mechanism. Microsystem Technologies, 2008, 15(3), 453–461.
- He, S.; Mrad, R.B.; Chang, J.S. Development of a high-performance microelectrostatic repulsive-force rotation actuator. Journal of Microelectromechanical Systems, 2010, 19(3), 561–569.
- He, S.; Mrad, R.B.; Chong, J. Repulsive-force out-of-plane large stroke translation micro electrostatic actuator. Journal of Micromechanics and Microengineering, 2011, 21(7), 75002.
- Van Kessel, P.F.; Hornbeck, L.J.; Meier, R.E.; Douglass, M.R. A MEMS-based projection display. Proceedings of the IEEE, 1998, 86(8), pp. 1687–1704.
- Radiant ZEMAX LLC, 2015. Zemax OpticStudio. Available at: http://www.zemax.com/.
- Milanović, V.; Castelino, K. Sub-100 µs settling time and low voltage operation for gimbal-less two-axis scanners. IEEE/LEOS Optical MEMS 2004, Takamatsu, Japan, August, 2004.