
 ?Mathematical formulae have been encoded as MathML and are displayed in this HTML version using MathJax in order to improve their display. Uncheck the box to turn MathJax off. This feature requires Javascript. Click on a formula to zoom.
Abstract
Visual tracking is an essential process for performing automated cell manipulation tasks. However, Real-time accurate cell tracking in FluidFM is challenging due to probe occlusion during manipulation. This study presents a correlation filtering-based tracking method for real-time, high-precision position tracking of cells and probes. In this method, a target template update strategy is proposed to realize cell tracking under probe occlusion, which abandons the use of pixel values in the occlusion area and reduces the interference of the occlusion area in model learning. Cell tracking and automated manipulation experiments were carried out to validate the proposed method. The Experimental results show that the proposed tracking method can accurately measure the positions of occlusion cells and probe. Furthermore, combined with the precise force control of the FluidFM’s probe, the automated cell Pick & Place experiments was accomplished with high accuracy and robustness.
1. Introduction
Cell manipulation has attracted a lot of interest since it provides the foundation for artificial insemination,[Citation1,Citation2] developing drug treatment,[Citation3] investigating the features of single cells,[Citation4–6] and understanding multicellular interactions.[Citation7] As a result, researchers have proposed a wide range of methods for micromanipulation, including contact-type nanoprobes or microgrippers,[Citation8,Citation9] non-contact optical traps,[Citation10,Citation11] magnetic fields,[Citation12,Citation13] and acoustic fields.[Citation14] Meanwhile, how to complete the desired cell actions quickly and accurately is a crucial issue for the promotion and implementation of these applications.
Traditionally, the operator manually manipulates the cells using visual information provided by the optical microscope, which makes the operator heavily dependent on their vision. At the same time, manual operation requires long training, is a complex process, and tends to cause operator fatigue. As a result, manual manipulation suffers from inefficiency, limited reproducibility, and a high risk of cell contamination, contradicting the need for rapid cell growth and batch manipulation. A promising approach to this challenge is to automate the cell manipulation process using visual servo, further increasing experimental efficiency and throughput.[Citation15–17]
However, achieving automated cell manipulation is still a challenge. Two factors primarily cause this difficulty: (1) liquid perturbations in cell culture environments produce interfering signals that hinder accurate static force measurements, and (2) the presence of invisible cells beneath the probe prevents automatic visual-based positioning. The advent of fluidic force microscopy (FluidFM) has solved the first problem well and opened up new avenues for studies at the single-cell level.[Citation18–20] FluidFM combines Atomic Force Microscope (AFM)’s force sensitivity and positional accuracy with Cytosurge’s microfluidic technology. Its force feedback hollow probe can accurately measure static force in liquids to avoid excessive contact while enabling common cell operations like Pick & Place, Injection & Sampling. Therefore, the key to automated cell manipulation on the FluidFM system is to precisely position the probe and the cell and complete rapid alignment to avoid inaccurate operation positions.[Citation21]
Since the FluidFM system is configured with an inverted vision system, the probe inevitably obscures the cells during operation, interfering with vision-based automatic positioning and making it difficult to track cells in real time. One possible solution to this problem is to change or add a side view vision system. However, these methods require a relatively large number of additional components (e.g., optics and detectors), which necessitate space and alignment, causing higher complexity and cost. Furthermore, the projective distortion will be involved, complicating target pose measurement. Therefore, it is an ideal solution to propose a tracking algorithm that can simultaneously obtain the location of cells and probes and deal with overlapping under microscopic vision.
Target tracking has made great progress as a hot research topic in computer vision. Mainstream tracking algorithms are divided into two categories: the tracking algorithm based on deep learning, which is mainly based on the framework of deep neural network.[Citation22] However, the current deep learning tracking algorithm has a large network and lacks training data, resulting in poor real-time performance. The other is the tracking algorithm based on correlation filtering,[Citation23–25] which obtains a correlation filter by training the initial template, establishes the model of the target’s features, and finds the maximum correlation of adjacent frames in the frequency domain by Fourier transform, to achieve effective tracking of the target. In the current stage, correlation filtering algorithms can consider real-time performance and accuracy among numerous tracking algorithms. Three strategies are proposed to solve the occlusion problem: part-to-whole, hypothesize-and-test, and buffer-and-recover.[Citation26,Citation27] Because the occlusion in our application is local (the probe will only overlap a portion of the cell), the part-to-whole strategy is the ideal way to deal with it. Once the occlusion processing strategy has been determined, the next issue is constructing an appearance model of the tracked object. Local features (e.g., corners, edges, KandeLucas-Tomasi features) and regional features (e.g., histograms, raw pixel templates) are commonly used for target appearance models.[Citation28,Citation29] We chose templates as features to achieve simultaneous tracking of probes and cells because region-based tracking methods are more robust and extensive than feature-based tracking methods. Unlike traditional template matching methods, which employ an exhaustive search strategy to find the best match, we use the correlation of the filtering algorithm to improve matching speed and accuracy significantly.
The rest of this paper is structured as follows. Section 2 describes the automation framework for cell manipulation, focusing on the process of automatic probe-cell alignment. Section 3 describes the foundation for detecting object location and dealing with occlusion is detailed. Section 4 validates the effectiveness and performance of the suggested approach. Finally, Section 5 concludes this paper.
2. Vision-servo-based alignment method for cell manipulating
Alignment is the key process for accomplishing cell manipulation. shows the schematic diagram of the cell picking and placing procedure, which is performed as follows. Firstly, the probe is aligned with the cells to be manipulated in the selected focusing area, with the red arrow representing the probe’s movement direction. Once aligned, the probe gradually approaches the cell and makes contact. After full contact, a negative pressure () is applied to the probe to complete the aspiration and fixation of the cells, where the green arrow represents the direction of pressure application. The probe then moves away from the substrate along the z-axis, eventually separating the selected cells from the substrate. Subsequently, the mobile platform completes the cell and destination alignment to transport cells. After contact detection, positive pressure is applied to complete cell release and attachment to the substrate. As can be seen, the alignment operation runs throughout the entire cell operation process.
Figure 1. Schematic of cell pick and place process. The red arrow represents the direction of movement of the probe, and the green arrow represents the direction of pressure application.
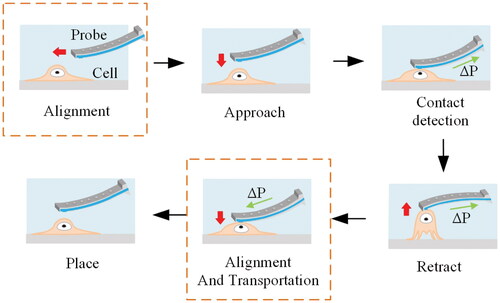
As shown in , the contact position between the probe and the cell directly determines the success rate of the manipulation. Incorrect contact position will not only affect the experimental results but also cause damage to the cell. At the same time, to reduce the impact on cells, the probe aperture size is generally much smaller than the cell’s surface. This constraint on the target scale makes it time-consuming for the operator to align the probe with the cell manipulation position. The above factors all put forward higher requirements for the alignment accuracy and speed of probes and cells. An ideal solution to this problem is to use a visual servo to automate the alignment process, enhancing experimental efficiency and throughput.
The key issue in automation is the continuous acquisition of probe and cell positions and their feedback to the controller to complete the alignment of the probe and cells. Therefore, a visual servo control method is presented to automate the cell manipulation process, as shown in . In the FluidFM system, the 3-D coordinates of the probe and cell are determined by a bottom-view system. The system controls the X-Y translation stage to maintain the cell at the center of the field of view and then controls the probe to achieve manipulation of the cells.
Figure 2. The flowchart of visual-servo-based alignment for cell manipulating with FluidFM.
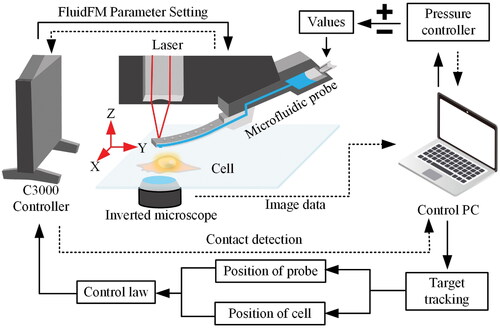
The image-based visual servo (IBVS) is used to automate the alignment step in this case. Here the camera is fixed, and the relationship with the probe is Eye-to-hand. Assume that the coordinate of the target feature point in the camera space is After being imaged by the vision system, the current image coordinates and the expected coordinates are
and
The IBVS attempts to optimize the error function e(r):
(1)
(1)
Where r and contain the current and desired values of the features,
represents the probe pose that minimizes the error function e(r).
In the optimization process, it is necessary to establish the relationship between the image parameters and the probe position. Suppose the velocity vector of the probe relative to the camera coordinate system is Then the point
in probe relative to the camera coordinate system can be obtained by the velocity matrix conversion:
(2)
(2)
And its mapping in the image coordinate system can be obtained from the camera keyhole imaging model. Therefore, the conversion relationship from the velocity vector to the differential
of the image feature point position can be described as:
(3)
(3)
where Je is the image Jacobian matrix that relates the world coordinates, image coordinates, and probe spatial velocity, and f is the normalized camera focal length.
The control law can be developed on the basis of an exponentially decoupled decrease in the error pose denoted by
(4)
(4)
Where λ denotes a proportional gain in feedback.
Due to the configuration of FluidFM, the depth information on the Z-direction can be obtained from the force-displacement curve, and the scale factors of the bottom-view microscope can be considered a constant (it is 0.36 µm/pixel here). At the same time, the movement of the operating probe can also ignore the influence of the angular velocity. They are allowing the above control law to be simplified.
It is worth noting that contact detection is required when the probe touches and releases the cells, which gives cell protection and makes it easier for the cells to attach to the substrate during the operation. In our experiments, the force applied by the probe to the cell is limited to 15 nN, while the force of the cell contacting the substrate when it is released is limited to 5 nN. Because the positive pressure given to the hollow probe by the pressure controller is also applied to the cell during the release process, the contact force needs to be reduced to protect the cell better.
3. Correlation filtering-based tracking methods
3.1. Basic principle
The Correlation Filtering-based Tracking (CFT) Methods aims to learn a correlation filter based on ridge regression, which can be employed to determine the target’s position in the search window. The target’s position corresponds to the correlation filter’s maximum response. Assume that the original image input training set then its linear regression function
w is the column vector representing the weight coefficient. The ridge regression problem is defined as follows:
(5)
(5)
where
is the regularization parameter, which is for control of overfitting. Solving of this optimization problem gives a closed-form solution:
(6)
(6)
where I is an identity matrix,
is data matrix, y is the regression target. The sample capacity of the data matrix X can be greatly expanded through cyclic shift of the raw image. Meanwhile, because of the circulant matrix X’s diagonalization property, the optimization processes of w can be sped up using the fast Fourier transform (FFT) pair, F and
(7)
(7)
Where we use to represent the Discrete Fourier Transform of a variable,
to denote the complex conjugate,
means to element-wise multiplication. Then, for the next frame’s search window
the tracking response map can be expressed as:
(8)
(8)
The fundamental principle is depicted in . A stable correlation filter is generated on the first frame, an adaptive correlation filter is used to model the target’s appearance, and the tracking process is done with a convolution operation. The maximum response of the correlation filter corresponds to the target’s position. After obtaining the optimal filter in frame
the filter model
is updated using a linear recursion form:
(9)
(9)
Figure 3. The basic principle of target tracking based on correlation filters methods.
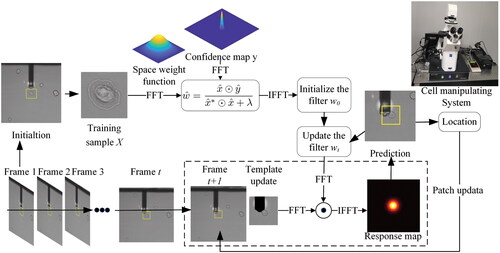
Where α is the learning rate, the most recent frame has more weight, and the impact of previous structures decays exponentially over time. Here, we set the α = 0.075 allows the filter to quickly adapt to changes in appearance while remaining robust. The predicted locations are extracted for training and updating the model. Simultaneously, the obtained position is fed back to our cell operating system, providing posture information for automatic cell alignment operation.
Here, the Peak-to-Sidelobe Ratio (PSR) was used to measure the strength of the correlation peaks to evaluate occlusion or tracking failures. The PSR is calculated by dividing the correlation output fM into two parts: the peak, which represents the maximum value, and the sidelobe, which means the remaining pixels excluding the size of the output window around the peak. The PSR is defined as:
(10)
(10)
Where is the peak values and
and
are the mean and standard deviation of the sidelobe.
3.2. Template update strategy
Although the filter model coefficients are linearly interpolated in the algorithm as EquationEquation (9)(9)
(9) , once several frames block the target, errors gradually accumulate and the model parameters are no longer identifiable. There are two main sources of occlusion. The first is that the probe overlaps a portion of the cell during the alignment process, as illustrated in the schematic diagram shown in . Generally, the contrast between cells and transparent substrates is low, while the probe contrast is high. When the probe and cell overlap, the image shows that the probe occludes the cell. Another challenge comes from the cell’s micro-environment. Many environmental particles, including dead cells, bacteria, and other organic matter, also inevitably occlude or overlapping cells. Therefore, for the above occlusion problem, we propose a template update strategy.
In the traditional correlation filtering algorithm, the linear recursive form is used to update the filter model and tracking template. Still, once the target is blocked for a few frames, the error gradually builds up, and the result drifts or the tracking fails. Because the model will be disturbed by the occlusion area, introducing redundant features, our strategy for dealing with occlusion is to forgo using the pixel values corresponding to the intersection area. Only the template features after removing occlusions are retained to reduce the interference of redundant features on tracking results and make the tracking results more accurate. The following are the specific strategies for dealing with the occlusion, as shown in .
Figure 4. Template update schematic for current frame. (I) Calculate the optical flow of the adjacent two frames and
(II) Obtain our occlusion mask
(III) Update new template design
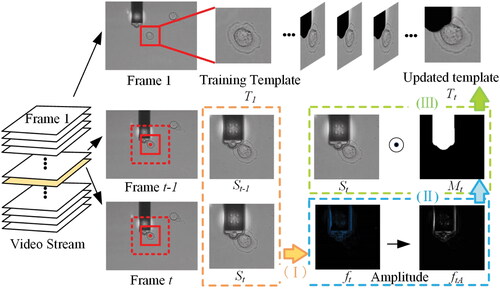
To begin, for cells, we get the cell search window of the current frame based on the previous frame’s response. To calculate the optical flow of images in the cell search window of adjacent two frames
and
Horn-Schunck boundary conditions were used:
(11)
(11)
Where and
are the spatio-temporal image brightness derivatives. The spatial derivatives of the optical velocity component u, v are
and
and the global smoothness term is scaled by a. The Horn-Schunck method minimizes the previous equation to obtain the velocity field
for each pixel in the current frame as the image
shows. the amplitude image
is extracted from the optical flow image
obtained by the above method.
Then, to process amplitude images and obtain our occlusion mask
as step II shown in . We used the image morphology method and the connected domain method, which set the value of the mask corresponding to the probe area to one once intersecting occurred. The main operations are as follows: (1) use linear structural elements to expand the image to highlight the occluded contour; (2) then label the connection components of the image to obtain the probe object connected to the image boundary and fill the probe object. The condition of the contiguous regions used here is 4-connection components; (3) use rhombus structural elements to erode the image, smooth the processing object, and remove interference noise.
Finally, complete the template update operation in step III. Multiply the mask and the cell search image
to obtain the search area of the updated cell template, and intercept the new template design
of the same size as the initial template, which is shown in . The updated template eliminates the influence of background occlusion on the cell allowing the model to be effectively identified throughout the entire tracking process. The processing time for each frame by the template update-based tracking method is within 25 ms, which is enough to meet real-time requirements.
4. Experiments and discussions
4.1. Preparation configurations and force calibration
An experimental setup is established to test the efficacy and performance of the suggested approach for target tracking and automatic alignment, as illustrated in . A FluidFM Bot (Cytosurge, Switzerland) microfluidic system was integrated with a FlexAFM scan head (Nanosurf, Germany). The micropipette probe (Cytosurge AG) was inserted into the scan head through a probe holder. It had an aperture diameter of 8 µm and a spring constant of 2 N/m. A reservoir was attached to the micropipette, which was controlled by a precise pressure controller. A mechanical pump and control system with a capacity range of −800 to +1000 mbar and an accuracy of 1 mbar enabled pressure control. The C3000 controller actuated the scan head and mechanical pump (Nanosurf, Germany). The microscope was fitted with Zeiss Fluar objectives 20× and camera adapter 0.63×. The images were captured using a Grasshopper3 USB3 digital camera (Teledyne FLIR, America).
The micropipette probe must be calibrated before cell manipulation experiments. First, the laser was manually positioned at the end of the cantilever, which was detected by a position-sensitive detector (PSD). The thermal vibration spectrum of the cantilever was used to calculate the spring constant. Following that, insert the probe into the operating medium, reposition the laser, and complete the Deflection Cross-Talk calibration. Afterward, the probe was approached to the substrate, and the inverse optical lever sensitivity was determined by bringing the cantilever close to the surface three times and fitting the deflection-displacement curve. The valid sensitivity was accepted by taking the average of the three fitted slopes.
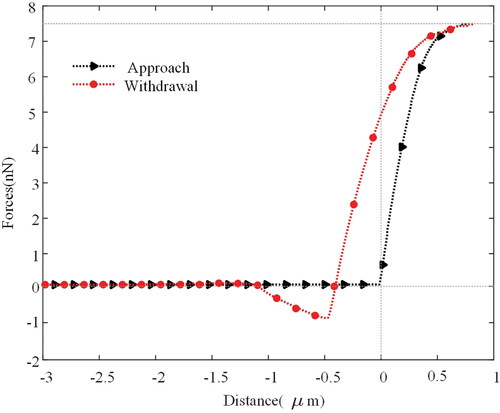
Here, Considering the characteristics of the HeLa cells we traced, the force should be applied correctly and limited to a reasonable level to avoid damage to the cell; this requires a precise amount of force exerted. We set the contact force between the probe and the cell to 7.5 nN, so contact detection can be completed without harming the cell.[Citation30,Citation31] depicts a typical force-distance curve obtained during contact between the probe and the cell. As the diagram shows, the force remained unchanged during the approach until the probe was a few nanometres away from the Cell. Once in contact, the force will continue to increase (black arrow) until it reaches the preset force of 7.5 nN. At this point, the probe is in complete contact with the Cell without damaging it. Similarly, the force decreases (red dot) when the probe is withdrawn and becomes negative until the tip and Cell separate. This force is more significant than when approaching because of adhesion that forms when the tip comes into contact with the Cell’s surface.
Figure 5. Typical force-distance curve obtained by probe approach and withdrawal from a HeLa cell.
To verify the feasibility of the proposed algorithm, all the code scripts were run on standard computer configurations (Windows 10, Intel Core CPU, i5-9300H, 2.4 GHz, 8 GB RAM). Matlab is used to implement the tracking algorithm and control parameter setting via the Python application programming interface (API).
4.2. Target tracking experiment
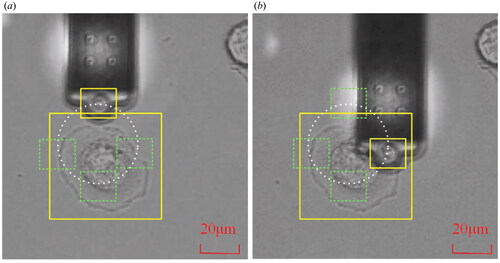
The following experimental scheme was intended to test the target tracking performance. First, the probe and cell were adjusted to position in the microscope’s field of vision. Second, the templates for the probe and cell were chosen separately. The probe is then positioned to move along a predetermined circular path while the target cell remains in place, and the tracking results are recorded. Finally, the cell is positioned to move along a predetermined rectangular course while keeping the probe stationary. shows the photographs obtained at the start and during the experiment.
Figure 6. Target tracking experiment. (a) The image capture at the initial time. (b) The image capture during the movement. Note that the yellow box is the selected template while the white line shows the movement trajectory of the probe.
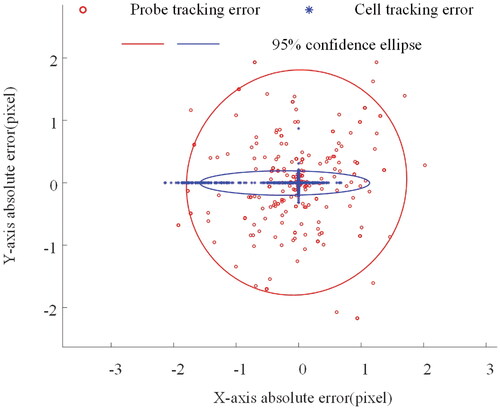
The measurement results are shown in . It can be noticed that the measured trajectory of the probe in image space is a circle, while the trajectory of the cell is a rectangle, which is consistent with the motion of the input. depicts the absolute error of the trace and the related 95% error confidence ellipse. The confidence ellipse standard deviations σx and σy for probe tracking errors were 1.80 and 1.74 pixels, respectively, while the standard deviations σx and σy for cell tracking errors were 0.55 and 0.08 pixels. As can be seen, the circular trajectory has a more uniform error distribution. Because the square trajectory is parallel to the axes, the errors are distributed on the corresponding axes, and the overall error range is smaller than that of the circular trajectory. This may be due to differences in the motion drivers of the probe and the platform on which the cells are fixed.
Figure 7. Measurement results for the experiment of target tracking. Black lines are predetermined path. The preset trajectory for the probe to move is a circle, while the cell is a rectangle.
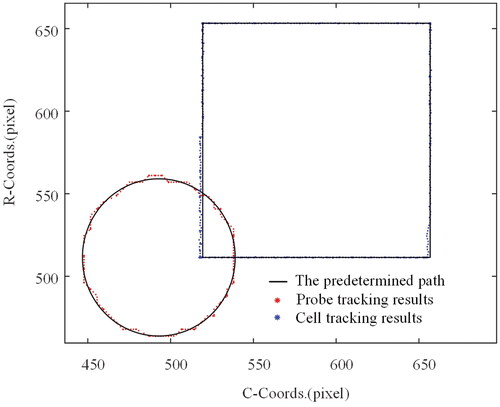
Figure 8. The absolute error of tracking results and the corresponding 95% error confidence ellipse.
4.3. Algorithm occlusion comparison and robustness
We followed the tracking experiment shown in , keeping the cells motionless and allowing the probe to follow a circular trajectory with a radius of 20 µm. In this experiment, the probe will cause varying levels of occlusion of the cells but not complete occlusion.
To evaluate the ability of the algorithm to maintain object tracking under occlusion, we compared our method with algorithms published by the authors of MOSSE,[Citation27] KCF,[Citation24] and DCF.[Citation25] The results are shown in .
Figure 9. (a) The comparison of PSR performance of correlation filtering algorithms based on cell manipulation video sequences under occlusion, (b) corresponding frame image in the PSR result: A—the initial frame, B—the frame that started to cause the occlusion, C—the frame with the maximum occlusion, and D—the frame after the operation is completed.
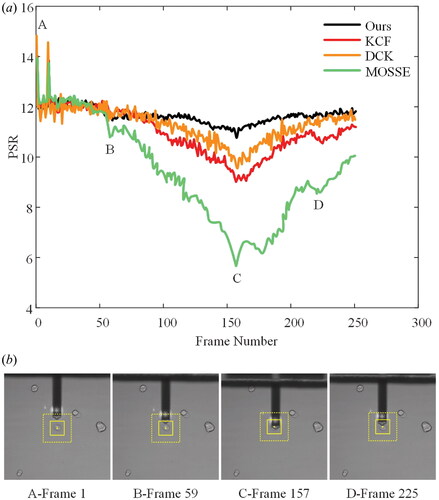
The results indicate that the PSR results of our proposed method are more stable for cell operations with occlusion. The MOSSE algorithm has the most fluctuations, followed by DCF and KCF. We discovered that sharp peaks have the benefit of being a good predictor of track quality, whereas filter drifting and failures are always associated with low PSRs. As illustrated in figures, the PSR can locate the most difficult sections of the image sequences. The corresponding frame images in the PSR results are as follows: A—the initial frame, B—the frame that starts causing occlusion, C—the frame with the greatest occlusion, and D—the frame after the operation is completed. When PSR drops to around 8, we’ve discovered that the object is occluded or tracking has failed.
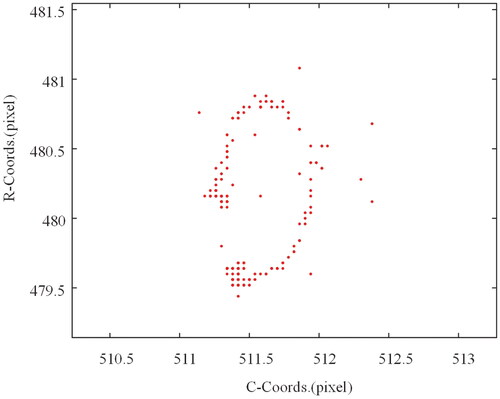
It can be found even though the cell remains stationary, the measurement is not zero, as illustrated in . This makes sense since when the probe moves, the image’s illumination and contrast fluctuate, which further leads to a perturbation in the tracking results. The disturbance, however, remains within a narrow range. The results for each location component, in particular, are dispersed across a range of 2 pixels. shows that the proposed tracking algorithm can track targets with good accuracy.
Figure 10. The measured position results of the cell in occlusion experiment. Here the probe moves with a radius of 20 µm, which will cause varying degrees of occlusion of the cells but will not completely occlude them.
4.4. Automated alignment experiment
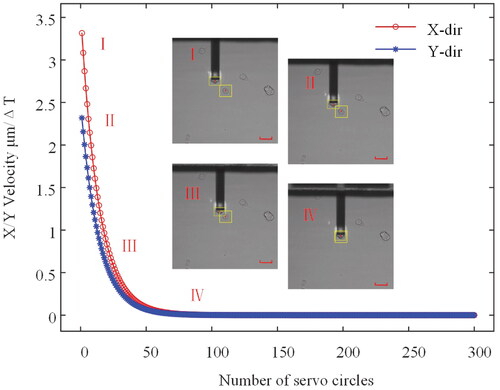
In this experiment, the automatic alignment of the probe and cells in the culture dish is performed based on the visual servo scheme shown in .
The corresponding velocity profile for each axis is shown in . Illustration (I)–(IV) described the process of the probe and cell approximation. The results show that accurate auto-alignment of the probe and cell can be achieved using the proposed control scheme.
Figure 11. The velocities correspond to the visual servo process. ΔT is the period of servo circle. Illustration (I)–(IV) demonstrates the automatic alignment process. Scare bars: 50 µm.
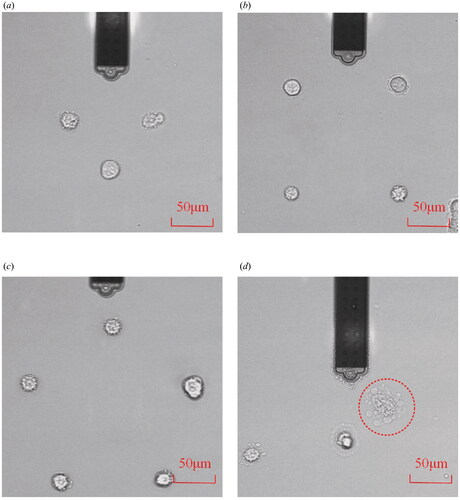
Also, to verify the proposed auto-alignment capability, a series of cells were manipulated to construct different two-dimensional cell patterns. show a combination of two-dimensional cell patterns (triangles, quadrilaterals, and pentagonals). In these cases, the average operating time per cell is ∼10 s using the visual servo auto-alignment method, which is about 10 s faster than manual operation. The success rate of the experiments is also significantly higher because we can focus more on the pressure applied to the cells. We have found that there is a probability of failure in both cell picking and placing due to differences in cell adhesion. At the same time, the cell adhesion force is greater than the force of the probe to immobilize the cells. This means that after we pick up the cells, we need to reduce the pressure value quickly, or we will cause damage to the fragile cells, as shown in .
Figure 12. Images (20×) of the polygonal pattern of cells. (a) Triangles. (b) Quadrilaterals. (c) Pentagonals. (d) Damaged cells.
5. Conclusion
In this study, we analyze the current problems in cell automation and propose a framework for automatic cell pickup and release based on the visual servo. A correlation filter tracking algorithm based on a template update strategy is developed to solve the problem of cell occlusion during operation. The control scheme of the contact force with cells in the experiment is described in detail, and the maximum contact force is set to 7.5 nN. Our experiments show that the proposed method effectively tracks targets with good accuracy. The 95% confidence ellipse standard deviations σx and σy for tracking errors were below 1.80 pixels. We also compare the PSR results of the proposed method with the classical correlation filtering algorithm, and the tracking perturbation of the cells under the tracking occlusion by the proposed algorithm is in the range of 2 pixels. Furthermore, the proposed visual servo scheme can implement precise automatic alignment of probes and cells, and at the same time, effectively improve the operation efficiency and success rate of the experiment. Future research will combine the liquid delivery function of the hollow probe to perform adaptive cell operations, such as injection and extraction.
Disclosure statement
No potential conflict of interest was reported by the author(s).
Additional information
Funding
References
- Alhaj Alabdulla, A.; Haşıloğlu, A.; Hicazi Aksu, E. A robust sperm cell tracking algorithm using uneven lighting image fixing and improved branch and bound algorithm. IET Image Proc. 2021, 15, 2068–2079. DOI: 10.1049/ipr2.12178.
- Mostajer Kheirkhah, F.; Sadegh Mohammadi, H. R.; Shahverdi, A. Efficient and robust segmentation and tracking of sperm cells in microscopic image sequences. IET Comput. Vision 2019, 13, 489–499. DOI: 10.1049/iet-cvi.2018.5662.
- Garitano-Trojaola, A.; Sancho, A.; Götz, R.; Eiring, P.; Walz, S.; Jetani, H.; Gil-Pulido, J.; Da Via, M. C.; Teufel, E.; Rhodes, N.; et al. Actin cytoskeleton deregulation confers midostaurin resistance in FLT3-mutant acute myeloid leukemia. Commun. Biol. 2021, 4, 799. DOI: 10.1038/s42003-021-02215-w.
- Mathelié-Guinlet, M.; Viela, F.; Dehullu, J.; Filimonava, S.; Rauceo, J. M.; Lipke, P. N.; Dufrêne, Y. F. Single-cell fluidic force microscopy reveals stress-dependent molecular interactions in yeast mating. Commun. Biol. 2021, 4, 33. DOI: 10.1038/s42003-020-01498-9.
- Dehullu, J.; Vorholt, J. A.; Lipke, P. N.; Dufrêne, Y. F. Fluidic force microscopy captures amyloid bonds between microbial cells. Trends Microbiol. 2019, 27, 728–730. DOI: 10.1016/j.tim.2019.06.001.
- Dehullu, J.; Valotteau, C.; Herman-Bausier, P.; Garcia-Sherman, M.; Mittelviefhaus, M.; Vorholt, J. A.; Lipke, P. N.; Dufrêne, Y. F. Fluidic force microscopy demonstrates that homophilic adhesion Bycandida albicans Als proteins is mediated by amyloid bonds between cells. Nano Lett. 2019, 19, 3846–3853. DOI: 10.1021/acs.nanolett.9b01010.
- Sancho, A.; Vandersmissen, I.; Craps, S.; Luttun, A.; Groll, J. A new strategy to measure intercellular adhesion forces in mature cell-cell contacts. Sci. Rep. 2017, 7, 46152. DOI: 10.1038/srep46152.
- Zhang, Q.; Shao, Y.; Li, B.; Wu, Y.; Dong, J.; Zhang, D.; Wang, Y.; Yan, Y.; Wang, X.; Pu, Q.; Guo, G. Visually precise, low-damage, single-cell spatial manipulation with single-pixel resolution. Chem. Sci. 2021, 12, 4111–4118. DOI: 10.1039/d0sc05534d.
- Liang, J. W.; Zhang, X. M.; Zhu, B. L. Nonlinear topology optimization of parallel-grasping microgripper. Precis. Eng. 2019, 60, 152–159. DOI: 10.1016/j.precisioneng.2019.08.004.
- Juan, M. L.; Righini, M.; Quidant, R. Plasmon nano-optical tweezers. Nature Photon. 2011, 5, 349–356. DOI: 10.1038/nphoton.2011.56.
- Ta, Q. M.; Cheah, C. C. Human–machine interaction control for stochastic cell manipulation systems. Automatica 2021, 131, 109721. DOI: 10.1016/j.automatica.2021.109721.
- Erb, R. M.; Martin, J. J.; Soheilian, R.; Pan, C.; Barber, J. R. Actuating soft matter with magnetic torque. Adv. Funct. Mater. 2016, 26, 3859–3880. DOI: 10.1002/adfm.201504699.
- Wei, T.; Liu, J.; Li, D.; Chen, S.; Zhang, Y.; Li, J.; Fan, L.; Guan, Z.; Lo, C. M.; Wang, L.; et al. Development of magnet-driven and image-guided degradable microrobots for the precise delivery of engineered stem cells for cancer therapy. Small 2020, 16, e1906908. DOI: 10.1002/smll.201906908.
- Chen, P.; Li, S.; Guo, Y.; Zeng, X.; Liu, B.-F. A review on microfluidics manipulation of the extracellular chemical microenvironment and its emerging application to cell analysis. Anal. Chim. Acta 2020, 1125, 94–113. DOI: 10.1016/j.aca.2020.05.065.
- Chaumette, F.; Hutchinson, S. Visual servo control, part I: basic approaches. IEEE Robot. Automat. Mag. 2006, 13, 82–90. DOI: 10.1109/MRA.2006.250573.
- Li, H.; von Kleist-Retzow, F. T.; Haenssler, O. C.; Fatikow, S.; Zhang, X. Multi-Target Tracking for Automated RF On-Wafer Probing Based on Template Matching; International Conference on Manipulation, Automation and Robotics at Small Scales (MARSS). Helsinki, Finland: IEEE, 2019; pp. 1–6.
- Zimmermann, S.; Tiemerding, T.; Li, T.; Wang, W.; Wang, Y.; Fatikow, S. Automated Mechanical characterization of 2-D materials using SEM based visual servoing. Int. J. Optomechatron. 2013, 7, 283–295. DOI: 10.1080/15599612.2013.879501.
- Meister, A.; Gabi, M.; Behr, P.; Studer, P.; Vörös, J.; Niedermann, P.; Bitterli, J.; Polesel-Maris, J.; Liley, M.; Heinzelmann, H.; Zambelli, T. FluidFM: combining atomic force microscopy and nanofluidics in a universal liquid delivery system for single cell applications and beyond. Nano Lett. 2009, 9, 2501–2507. DOI: 10.1021/nl901384x.
- Meister, A.; Polesel-Maris, J.; Niedermann, P.; Przybylska, J.; Studer, P.; Gabi, M.; Behr, P.; Zambelli, T.; Liley, M.; Vörös, J.; Heinzelmann, H. Nanoscale dispensing in liquid environment of streptavidin on a biotin-functionalized surface using hollow atomic force microscopy probes. Microelectron. Eng. 2009, 86, 1481–1484. DOI: 10.1016/j.mee.2008.10.025.
- Dörig, P.; Stiefel, P.; Behr, P.; Sarajlic, E.; Bijl, D.; Gabi, M.; Vörös, J.; Vorholt, J. A.; Zambelli, T. Force-controlled spatial manipulation of viable mammalian cells and micro-organisms by means of FluidFM technology. Appl. Phys. Lett. 2010, 97, 023701. DOI: 10.1063/1.3462979.
- Xie, H.; Zhang, H.; Song, J.; Meng, X.; Geng, J.; Sun, L. Living cell manipulation and in situ nanoinjection based on frequency shift feedback using cantilevered micropipette probes. IEEE Trans. Automat. Sci. Eng. 2020, 17, 142–150. DOI: 10.1109/TASE.2019.2904281.
- He, T.; Mao, H.; Guo, J.; Yi, Z. Cell tracking using deep neural networks with multi-task learning. Image Vis. Comput. 2017, 60, 142–153. DOI: 10.1016/j.imavis.2016.11.010.
- Barcellos, P.; Scharcanski, J. Part-based object tracking using multiple adaptive correlation filters. IEEE Trans. Instrum. Meas. 2021, 70, 1–10. DOI: 10.1109/TIM.2021.3088455.
- Andrew Fitzgibbon, Svetlana Lazebnik, Pietro Perona, Yoichi Sato, and Cordelia Schmid, eds. Computer Vision – ECCV 2012: 12th European Conference on Computer Vision, Florence, Italy, October 7–13, 2012, Proceedings, Part IV, Vol. 7575 of Lecture Notes in Computer Science. Springer: Berlin; Heidelberg, 2012.
- Henriques, J. F.; Caseiro, R.; Martins, P.; Batista, J. High-speed tracking with kernelized correlation filters. IEEE Trans. Pattern Anal. Mach. Intell. 2015, 37, 583–596. DOI: 10.1109/TPAMI.2014.2345390.
- Luo, W.; Xing, J.; Milan, A.; Zhang, X.; Liu, W.; Kim, T.-K. Multiple object tracking: a literature review. Artif. Intell. 2021, 293, 103448. DOI: 10.1016/j.artint.2020.103448.
- Bolme, D. S.; Beveridge, J. R.; Draper, B. A.; Lui, Y. M. Visual Object Tracking Using Adaptive Correlation Filters; 2010 IEEE Computer Society Conference on Computer Vision and Pattern Recognition. San Francisco, CA, USA: IEEE, 2010; pp. 2544–2550.
- Li, H.; Zhang, X.; Zhu, B.; Lu, Y.; Wu, H. Micro-motion detection of the 3-DoF precision positioning stage based on iterative optimized template matching. Appl. Opt. 2017, 56, 9435–9443. DOI: 10.1364/AO.56.009435.
- Karimirad, F.; Shirinzadeh, B.; Yan, W.; Fatikow, S. A vision-based methodology to dynamically track and describe cell deformation during cell micromanipulation. Int. J. Optomechatron. 2013, 7, 33–45. DOI: 10.1080/15599612.2012.744433.
- Guillaume-Gentil, O.; Potthoff, E.; Ossola, D.; Dörig, P.; Zambelli, T.; Vorholt, J. A. Force-controlled fluidic injection into single cell nuclei. Small 2013, 9, 1904–1907. DOI: 10.1002/smll.201202276.
- Guillaume-Gentil, O.; Gäbelein, C. G.; Schmieder, S.; Martinez, V.; Zambelli, T.; Künzler, M.; Vorholt, J. A. Injection into and extraction from single fungal cells. Commun. Biol. 2022, 5, 180. DOI: 10.1038/s42003-022-03127-z.