
ABSTRACT
Police data and survey research provide different bases to inform research on crime and delinquency. We argue that linking police data on local crime incidences to criminological surveys allows for new insights on the role of residential and school contexts for juvenile delinquency and violence. We describe the challenges and solutions of combining these data sources in a collaboration between the state police of North Rhine-Westphalia – Germany’s most populous state – and social scientists from a major German university. In this academic-practitioner partnership, data from a four-wave longitudinal study of more than 3800 students were linked to spatially aggregated data from the police crime statistics for the years 2013–2016. We discuss how the simulation of nearby addresses can serve as a tool for anonymized data linkage, how knowledge of the local data collection practices is crucial to evaluate the geocoding accuracy of address-level crime data, and how sensitivity and implication analyses can help to reduce uncertainties at the analysis stage. We also give recommendations for future research and data collection practices.
Incidences of youth violence regularly draw public and political attention in Europe. Police data and survey research provide different bases to inform these debates. Surveys allow researchers to capture also offenses that are not recorded by the police and to measure those motivations, beliefs, abilities, and perceived opportunities that make some adolescents choose crime in particular settings. While survey data target particular samples at particular time points, one of the strengths of police data is the continuous collection of data on a comprehensive set of offenses across the whole population in a given administrative area. One way in which police data can inform criminological research is by linking survey data with data from the crime statistics that is based on the Record Management System (RMS). At the level of individuals, many studies have complemented self-reported offenses with official police records to correct for potential underreporting or to collect information on crime involvement beyond the time window of a survey. In the current article, we present and discuss a different use of police data: Linking geo-coded police data to survey data on youth delinquency in order to measure respondents’ exposure to crime in their residential and school contexts.
We describe challenges and solutions in linking such data sources in a collaboration between the state police of North Rhine-Westphalia, Germany’s most populous state, and social scientists from a major German university. In this academic-police partnerships, geo-coded police data on crime was linked to survey data from a four-wave longitudinal study of more than 3800 students. Based on this case study, we discuss how the simulation of nearby addresses can serve as a tool for anonymized data linkage, how knowledge of the local data collection schemes and practices is crucial to evaluate the geocoding accuracy of address-level crime data (Hart & Zandbergen, Citation2013; Wheeler et al., Citation2020), and how sensitivity and implication analyses can help to reduce the remaining uncertainties at the analysis stage. The key lessons that can be drawn from our experiences and approach are relevant for academic-police partnerships beyond the German case and suggest how data collection in RMS can provide the basis for an understanding of the role of place in juvenile delinquency. To prepare the ground for our discussion of data linkage and analytic strategies, we provide a brief summary of the state of research on contextual influences on youth violence and delinquency. We then describe the aims of our academic-practitioner partnership and the potential and limitations of our data sources.
Contextual influences on delinquency and the case for linking survey and police data
Much research on crime, its causes, and prevention has focused on the role of places, such as residential neighborhoods, city centers, or street-level hot spots. This focus is motivated by the robust finding that ‘crime events (and particular types of crime events) tend to be concentrated in space and time’ (Wikström et al., Citation2018, p. 12). Analytically, the varying criminogeneity of places can be broken down into different aspects: First, places vary in the opportunities to commit certain offenses and, therefore, in the likelihood to attract motivated potential offenders (self-selection). For example, the location, physical structure, and socio-economic composition of residential areas make them differentially attractive for burglars. Second, places vary in their potential to give rise to motivations to commit particular crimes. For example, inner-city areas or other entertainment districts make people more likely to experience provocations and engage in violence, partly due to the higher levels of alcohol consumption. Third, places vary in the normative cues that they send out which affects both the situational activation of moral beliefs and the long-term learning of moral rules. For example, residential areas characterized by disorder may lead to more rule-breaking (Keizer et al., Citation2008; Keuschnigg & Wolbring, Citation2015).
The extent of rule-breaking in particular environments depends not only on who lives there but also on who else spends time in these places. As it is difficult to measure and monitor the flow of persons across areas, there are important pragmatic reasons to focus primarily on the characteristics of settings. This strategy is pursued in programs that aim at social prevention by building stronger communities to reduce crime in neighborhoods (see, e.g. Hawkins & Catalano, Citation1992) as well as efforts at targeting crime hot spots (Ratcliffe, Citation2004; Weisburd et al., Citation2012) or situational crime prevention more generally (Clarke, Citation1997).
Notwithstanding the significance of places, there is also evidence that adolescents differ in their crime propensity, with a minority of individuals being responsible for the vast majority of offenses. A longstanding strand of research therefore takes persons as the starting point and asks to what extent places affect the development of their crime propensity and their behavior. However, it is a major challenge to collect data on both individuals and contexts. Often surveys ask respondents about characteristics of their neighborhood (such as the extent of social control, cohesion, trust, or disorder), but such subjective measures may be confounded by respondents’ activities and attitudes. A superior research design combines survey data with independently collected information on characteristics of environments. The most important panel studies in the U.S. that followed this strategy are the ‘National Longitudinal Study of Adolescent Health’ (AddHealth), the ‘Project of Human Development in Chicago Neighborhoods,’ and the ‘Moving to Opportunity’ study. Analyses based on these projects provide evidence for the existence of contextual effects on juvenile delinquency and crime (see Chang et al., Citation2016, for a meta-analysis).
In Europe, the evidence is more mixed and suggests that contextual effects may be absent (e.g. Brännström & Rojas, Citation2012, based on register data) or weaker than in the U.S. (see, Oberwittler, Citation2018). However, research by Oberwittler based on data from Germany suggests that contextual effects may only be visible among subgroups of individuals (Oberwittler, Citation2004, Citation2007). For example, living in poor neighborhoods is strongly associated with serious forms of delinquency but only among adolescents without a migration background whose friends also tend to live in the neighborhood (Oberwittler, Citation2007). This result is an example of more general observation: Average associations might mask a great deal of effect heterogeneity, as some youth might be much more susceptible to contextual influences than others (Elliott et al., Citation2006; Sharkey & Faber, Citation2014; Wikström et al., Citation2012). As emphasized by Wikström (Citation2021, p. 8), ‘(D)ifferent people pay attention to different aspects of, and react and respond differently to, the same environmental conditions and circumstances, with the important implication that the relevance and strength of influence of specific environmental conditions and circumstances differ among people.’ For example, adolescents might not be affected by observing disorder and crime in their neighborhoods if they have high self-control, hold strong moral beliefs that proscribe breaking the law, and spend their time with like-minded peers.
We discuss one way to provide the basis for examining this interplay of individuals’ characteristics and environmental conditions: complementing existing criminological surveys with spatial police-recorded data on local crime incidences. As we will discuss below, although police data is prone to biases and covers only the frequency of reported crimes across geographical areas, its scale and breadth allows for a wide range of analyses that could yield indirect evidence for the relevance of different mechanisms. Moreover, as many criminological surveys do (or did) not have the funds to run independent community surveys alongside their main data collection (cf., Wikström et al., Citation2012), using police data to measure criminogenic exposure in academic-practitioner partnerships could be a widely applicable strategy.
Survey data: the Friendship and Violence in Adolescence Study
Our survey data comes from a school-based prospective longitudinal study that followed adolescents in five neighboring cities in Western Germany over four years from 2013 until 2016. The cities are located in the Ruhr area, which is the largest urban agglomeration of cities in Germany and is characterized by the downturn in coal and steel production, a high population density, high levels of ethnic diversity, and high levels of unemployment. The main objective of the study was to collect large-scale panel data on determinants of delinquency (e.g. self-control, moral beliefs, perceived deterrence, lifestyles), on grade-level social networks, and to explain inter-ethnic differences in youth violence. The initial target population included all seventh graders at lower and intermediate secondary schools as well as comprehensive schools. Due to budget constraints, upper secondary schools (‘Gymnasien’) could only be included in waves 3 and 4. In wave 1, 39 out of 45 eligible schools participated (87% response rate) and 2635 out of 3334 students at these schools (79% response rate). Participation was voluntary for the students and required parental consent. Response rates remained high over the subsequent three waves (at the school level: W2: 89%, W3: 89%, W4: 89%, and at the student level: W2: 89%, W3: 89%, W4: 89%). In order to maximize privacy, interviews were collected as computer-administered self-interviews. In order to counteract language and illiteracy problems, students could also listen to questions and answer options via headphones.
Due to its high response rates and theory-guided measures, the Friendship and Violence in Adolescence study provides rich longitudinal data that allow scholars to examine mechanisms that underlie delinquency. However, similar to other prospective panel studies on crime and delinquency, the data does not incorporate independent measures of residential and school contexts. To examine their role, it is therefore necessary to enrich this study with information on the crime-relevant characteristics of these contexts. The basis for linking survey responses to contextual data from other sources, such as police records or commercial providers of geo-spatial data, are the school addresses and respondents’ home addresses which they provided during the study. In the following, we will discuss how we linked the survey data with police data on crime statistics.
Police data: challenges of using the record management system to measure spatial crime exposure
We use police data from the crime statistics of North Rhine-Westphalia, Germany’s most populous state. It is gathered and administered in the State Office of Criminal Investigation and based on data from the RMS of the state police. The analysis and interpretation of RMS data and official crime statistics require profound knowledge about the data collection process. In the following, we point out several issues that may affect both the validity and reliability of different measures of crime exposure.
In general, one has to take into account that police-recorded crimes do not represent the totality of committed crimes and that they have not been collected for research purposes (Gaub et al., Citation2018). When using them to construct indicators, one has to acknowledge various sources of measurement error (see, Buil-Gil et al., Citation2021; Gaub et al., Citation2018; Haberman et al., Citation2021; Hart & Zandbergen, Citation2013; Wheeler et al., Citation2020). Four sources are particularly important for our project:
Reporting bias: Most records captured in the RMS are based on offence reports filed by citizens (Hart & Rennison, Citation2003; Young, Citation1992). Hence, the public willingness to report crimes has a strong effect on the RMS data base. Among other things, research shows that the type and the seriousness of a crime have a strong influence on whether or not victims report a crime to the police. The decisions can also be affected by the fear of reprisal, insurance requirements, confidence in police effectiveness as well as the time or trouble it takes to report the crime (Averdijk & Elffers, Citation2012; Buil-Gil et al., Citation2021; State Office of Criminal Investigations North Rhine-Westphalia, Citation2006). Property crimes, for example, are reported quite often, especially because insurances regularly require an offence report as verification. In contrast, violent crimes are reported less frequently, especially offences that may be associated with feelings of shame and guilt (such as sexual assault), crimes that occur in the private social environment (e.g. domestic violence), emotional violence, or violent offences without serious consequences for the victim (State Office of Criminal Investigations North Rhine-Westphalia, Citation2020). Furthermore, reporting rates are unequally distributed across areas and social groups. For example, reporting a crime is more common among females than males and among adults than young citizens (Buil-Gil et al., Citation2021).
Monitoring bias: In addition, different policing strategies and unequal police control practices across areas may bias crime statistics (Buil-Gil et al., Citation2021; Levitt, Citation1998). Drug offences or infringements of the right of residence, for example, are usually only detected through police control measures. Those measures, in turn, depend on the prioritization of the respective police department.
Recording bias: Another source of measurement error is the practical implementation of official counting rules applied by different police officers. Although there are guidelines for recording crimes in the RMS, these guidelines are not always followed and remain open to interpretation.Footnote1 For example, the Home Office (Citation2000) reported poor recording and inappropriate practices for the police in England and Wales and a study found that only between 55 and 85% of crimes were recorded correctly (HMIC, Citation2000). In the state of North Rhine-Westphalia, where our data was collected, the RMS allowed police officers to further describe the crime scene, including a possible classification as ‘school’ or ‘public street.’ However, using this information might lead to biases. The label was sometimes also used for cases without a school context (i.e. an external sport event that took place in the school gym) as well as for cases that occurred in other locations (i.e. on a school trip). Moreover, further analysis of the data quality showed that the crime scene label ‘school’ was applied incorrectly in at least three percent of the cases. Finally, a lot of cases which took place at a school address were not coded with the crime scene label ‘school.’ We therefore decided to use information about the location of an incident instead.
Another example of recording bias is especially relevant to our analytic objectives. Until 2020 police officers in North Rhine-Westphalia did not have mobile devices to collect GPS data as part of their crime recording. Not being able to record the GPS location of a crime scene was not much of a problem if the crime was committed inside or in front of a building with a specific address. However, in the case of crimes committed in public spaces, such as parks, there is often no particular address available. In those cases, it was common for police officers to use a nearby address, insert some random house number, or leave the (optional) field blank. Subsequently, the crime events are automatically geo-referenced in the RMS on the basis of the recorded information. If there is no exact address (or if the recorded address is not known to the system), the RMS creates a geo-coordinate at the next higher level. For example, if the entered house number is missing or does not exist, the RMS creates a coordinate that refers to the expected centre of the recorded street. This may bias analysis of crime at micro-geographic scales, as the geospatial information produced by the system is not always reliable. As we use data collected between 2012 and 2016, the inaccurate reporting of addresses might yield wrong geo-coordinates (see below).
(4) Data processing errors: Furthermore, information usually passes through different media formats during the process of crime recording by the police. This can lead to some of the information getting lost in the process. This might occur, for example, when the crime scene is initially documented by hand, then transferred to the RMS using a computer-based procedure, and finally exported to other media formats and systems (such as the official crime statistics) at the end of the investigative procedure (Merbach & Seidensticker, Citation2019). When recording the case, the police officer can only consider the available information at that time. If new information about the case emerges later in the investigation (e.g. due to the appearance of previously unknown witnesses), this may mean that a previously established suspicion of a crime must later be rejected. However, the data of the initial suspect is usually not subsequently corrected in the crime statistics (Kersting & Erdmann, Citation2014, p. 14).
To the extent that such biases are unequally distributed across areas, spatial analyses of police-recorded crime data must proceed with caution (Buil-Gil et al., Citation2021). This is all the more true as we usually cannot precisely estimate the extent of uncertainties in the data (Kinkeldey et al., Citation2014; for exceptions, see, Gerell, Citation2017; Wheeler et al., Citation2020). We discuss several ways to address these challenges when working with existing police data and give recommendations for future data collections in the final two sections.
Preparation of data linkage: overcoming legal and practical challenges
Linking survey data with police data needs to comply with legal and ethical rules. Special care is also due given that the participants of the school survey were minors. Acknowledging the particular vulnerabilities of youths, the Friendship and Violence in Adolescence project collected voluntary informed consent from the participants as well as from their parents/legal guardians. Both the home addresses and the other survey data constitute sensitive information. Hence, a data protection protocol had to be devised and checked that meets the needs of the project while fully complying with national and EU legislation. The protocol covered all procedures for data collection, storage, usage, protection, retention, and destruction.
Two important protective measures were taken to exclude the possibility of identifying participants or linking participants to their answers. First, we separated the survey data from the original addresses and then anonymized the latter. After having conducted the survey, participants’ addresses were marked with identifiers and stored physically separately from respondents’ survey answers. Only members of our university-based research group have access to the original addresses, which will be deleted when the project ends.
As a second protective measure, we devised a strategy to enable data linkage between survey data and police data. This was necessary because we did not elicit consent for sharing home address information with third parties such as the police. At the heart of our strategy is the simulation of nearby addresses based on the original addresses. Given its potential to be used in future projects in other countries and jurisdictions, the following section describes the steps taken in detail.
The generation of pseudo-addresses as an anonymization tool
In the last wave of the Friendship and Violence in Adolescence project, adolescents were asked to provide their current home addresses. Out of the 3,808 participants, 2,966 students (77.8%) provided information on their current address. Data cleaning resulted in the removal of 134 addresses that either did not exist or were incomplete (i.e. students did not provide a house number). Thus, 2,832 valid addresses remained (~74% of the original sample).
To ensure that participants cannot be identified, we generated pseudo-addresses based on the original address. These pseudo-addresses served as the basis for data linkage in our academic-police partnership. Sharing respondents’ self-reported addresses with the police would have been problematic both ethically and legally, since it would have meant to share personal information with an agency without the explicit consent of the respondents.
Our goal was to aggregate criminal records from the RMS to contextual units and thereby characterize the criminogeneity of students’ neighborhood and school contexts. Realizing this goal through the generation and use of pseudo-addresses comes with several challenges. First, there is a trade-off: The goal to investigate the association between contextual crime exposure and survey respondents’ behavior requires pseudo-addresses to be sufficiently close to the original addresses. At the same time, the more distant the pseudo-addresses are from the original addresses, the easier it is to ensure participants’ anonymity. In consultation with the university’s Data Protection Officer, we reasoned that a sufficient number of other persons must live in the immediate neighborhood from which the pseudo-addresses are drawn. This presupposes a sufficiently high level of housing in the surrounding neighborhood which does not allow to draw any conclusions about the respondents’ actual address. To realize this goal, we implemented an algorithm that ensures at least five other residential addresses in the immediate neighborhood.
For each survey respondent with a valid home address,Footnote2 the algorithm simulated five pseudo-addresses and drew one of these addresses as the respondent’s pseudo-address. To capture the respondents’ proximate surroundings, we decided to draw an address that is less than 150 meters away from the original address. gives an overview of the steps entailed in the generation of pseudo-addresses.
Figure 1. Process to obtain pseudo-addresses.
Based on the geo-coordinates of the original address (i.e. its position in terms of latitude and longitude), new geo-coordinates, with a distance of fewer than 100 meters from the original address, were simulated (Step 1a). These simulated geo-coordinates were then translated back into addresses (Step 1b). Since not all geo-coordinates correspond to a residential building (e.g. meadows, highways, fields), the algorithm checked for each generated geo-coordinate whether or not it corresponds to a valid residential address (using indicators such as whether the address contains a house number or not) (Step 1c). Moreover, to ensure that the simulated address does not correspond to an address reported by another survey participants, it was checked whether the pseudo-address existed in the pool of original addresses (Step 1d). This guaranteed that not a single initially reported address ends up in the pool of pseudo-addresses.
Finally, since we simulated five addresses for each participant, it was checked whether the current address has already been simulated for that given participant (Step 1e). This ensured that we end up with five unique addresses for each participant.
If the new address was invalid, existed in the pool of original addresses, or had already been simulated for a given participant, a new geo-coordinate was simulated based on the geo-coordinates of the original address. The process was repeated up to 20 iterations until a valid address was found (Step 1 f).
If no valid address was found within 20 iterations within less than 100 m, the search area was extended to a radius of more than 100 m and less than 200 m. Then the intermediate steps described in step 1 were repeated (except that only ten iterations were used). If the algorithm did not find a valid address within this distance, the search area was extended to a radius of 200 m up to 300 m in the last step (also with 10 iterations), and the same intermediate steps were rerun. This approach of successively increasing distances was chosen to find valid addresses also in less densely populated areas. Finally, when no valid address was found in the most extensive search area, the algorithm stopped and reported this result.
As illustrated in , we simulated five unique addresses for each original address to ensure that an area is sufficiently populated. Participants for whom our algorithm could not identify five valid addresses were removed (Step 2a, n = 12). These participants lived in sparsely populated, rural areas, which made it difficult to ensure anonymity. For all other participants, we randomly drew one of these five simulated addresses, which serves as the pseudo-address that we was shared with the police as the basis for data linkage (Step 2b).
Figure 2. Five simulated addresses (in red) in ego-hoods of different size around an original home address.
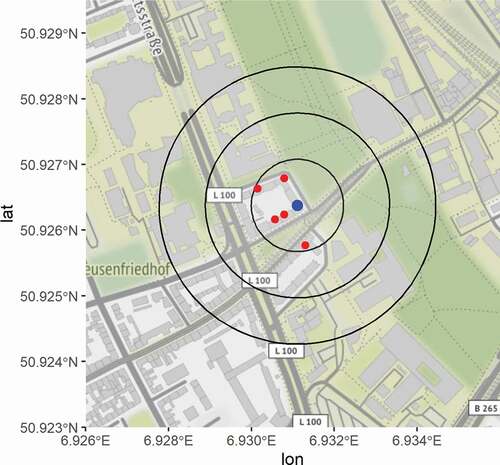
For the vast majority of the sample, the distance between the original address and the chosen address was less than 150 m (Step 2c). In only 22 cases, the random draw of one out of five addresses resulted in a greater distance. To ensure the homogeneity of our sample and to minimize measurement error in our contextual measures, we decided to redraw the pseudo-address for these 22 cases until the distance was less than 150 m (Step 2d).
Data linkage and analytic strategies: using police data to measure crime exposure in residential and school environments
The literature on crime mapping knows several ways to define spatial environments (Ratcliffe, Citation2010). Previous research has repeatedly noted the shortcomings of administratively defined geographical units of analysis to measure neighborhoods or other spatial concepts (see, Gerell, Citation2017). More generally, nonoverlapping geographical units have the disadvantage to miss relevant parts of respondents’ residential (and school) environments, particularly if their address is located close to the border of a unit (Hipp & Boessen, Citation2013). We therefore opted for ego-centric (residential and school) neighborhoods, or ego-hoods (Hipp & Boessen, Citation2013), and measured them by drawing circles around the geo-coordinates of the pseudo-addresses and the school addresses (Hartung & Hillmert, Citation2019).Footnote3
When defining ego-hoods, one has to decide on the scale as well as the zonation of these geographical units of analysis (the so-called modifiable areal unit problem, see, Gerell, Citation2017; Ratcliffe, Citation2010). While smaller geographical units, such as street segments or blocks, are preferable to identify hotspots, our research interest is in those environments that affect adolescents’ development and behavior. For example, a hotspot could still influence adolescents even if they live two blocks away (e.g. as they go there, come into contact with other persons going there, or hear about offenses being committed there). We therefore opted for a flexible operationalization with different ranges that allow for robustness and sensitivity analyses (see below). For each successively wider ego-hood, the research team members from the state police automatically matched the geo-coded crimes recorded in these areas in the relevant years. The resulting data set contains information about the type, time and number of crimes for every ego-hood.
Linking geo-coded police data and survey data allows for a wide range of analyses to examine the associations between exposure to crime in residential and school contexts and adolescents’ self-reported delinquency. We now discuss several analytic strategies and how researchers can take into account the limitations of official crime records and survey data when preparing and analyzing such data. We structure our discussion around seven recommendations that we deem relevant for similar projects.
(1) Exclude crimes with unreliable geo-coordinates and test how this analytic decision affects results in a robustness analysis: As discussed above, recording bias is an important concern when working with police data. In our case study, the lack of mobile devices to collect GPS data led to unreliable or missing data on geo-coordinates of crimes. Specifically, we found that 29.35% of the data did not contain accurate geospatial information (mostly missing house numbers), meaning that the geo-coordinates generated by the RMS were not completely reliable. We recommend to exclude these crimes when computing the crime exposure in residential and school contexts. Note that the distribution of crime incidences across areas tends to be highly skewed with a relatively small number of areas accounting for the majority of crimes. A wrong assignment of crimes based on distorted geospatial information therefore leads to a relatively high risk of overestimating crime exposure in areas with few actual crime. Still, such an analytic decision will inevitably lead to an underestimation of crime in some areas. One should therefore conduct robustness analyses to examine whether key results remain substantively identical when including crime reports with questionable geo-coordinate or imputing missing values.
(2) Use ego-hoods of different size to measure adolescents’ crime exposure: There is no strong theoretical or empirical basis to determine the geographical environments that most strongly affect adolescents’ development and behavior. Using ego-hoods of different size acknowledges this uncertainty and allows for robustness and sensitivity analyses (Hartung & Hillmert, Citation2019; Hipp & Boessen, Citation2013). In our project, we defined three different ego-hoods based on a radius of 150 m, 300 m, and 600 m around adolescents’ pseudo-address and school address. This corresponds to encircling areas of 0.07 km2 (0.03 mi2), 0.28 km2 (0.11 mi2) and 1.13 km2 (0.44 mi2). Our choice of the lowest radius ensured that the original home address is included even in the smallest ego-hood.
To further illustrate how we measure contextual crime exposure based on these ego-hoods, we focus on the incidence of four types of police-recorded offenses: Violent crimes, street crimes, and property damage through graffiti – which are part of the categorization scheme of the official crime statistics – as well as simple assault. Given their violent character or high visibility (graffiti as a sign of disorder), these criminal activities should be more relevant for adolescents’ violent behavior than white-collar crimes or other less visible forms of crime. We accumulated the criminal records for the years 2014 to 2016 using the data from the RMS-based crime statistics from 2014 to 2017.
are histograms of the incidence of violent crime and graffiti in the ego-hoods around adolescents’ pseudo-addresses as well as the sampled schools, based on a radius of 150 m, 300 m, and 600 m, respectively. Both figures show that the distribution of crimes across areas is highly skewed. If we look at the most immediate spatial environment, only very few adolescents live in high-crime neighborhoods. A similar picture can be seen at the school level.
Figure 3. Crime incidence in ego-hoods of different size (radius of 150 m, 300 m, and 600 m) around adolescents’ residential pseudo-addresses.
Figure 4. Crime incidence in areas of different size (radius of 150 m, 300 m, and 600 m) around adolescents’ schools.
The correlation between the crime incidences in students’ residential and school environments increases if we adopt larger definitions of respondents’ ego-hoods. The correlation is only 0.06 for the smallest radius (150 m) and increases to 0.16 (300 m radius) and 0.24 (600 m radius). This considerable increase reflects a greater overlap of residential and school environments. But even for contextual units with a radius of 600 m, the correlation is low enough to consider both contexts together as predictors (e.g. of self-reported violence within the last year).
Using ego-hoods of different size allows researchers to examine empirically which environments are most predictive of adolescents’ self-reported delinquency. If the radius is too small, one might find no associations between police-recorded crimes and adolescents’ own delinquency because relevant everyday settings might lie outside this ego-hood. Conversely, associations can be expected to become insignificant if the radius becomes too large to capture the geo-spatial phenomena of interest.
(3) Complement spatial police records data with additional geo-data: Geographical environments differ along various dimensions, some of which may confound the association between police-recorded crime and self-reported delinquency. It is therefore crucial to complement spatial data based on police records with additional geo-data. The most important controls comprise population density and socio-economic composition (e.g. purchasing power, share of persons with a tertiary education, share of unemployed persons). In Germany, such indicators are available on street or postal code level from commercial providers (Microm Consumer Marketing, Citation2010). We ordered this data for the same set of pseudo-addresses to guarantee anonymity of respondents.
Information on the composition of environments can also be used to assess the problem of reporting bias. For example, as older citizens have been found to be more willing to report crimes, one could examine how substantive findings differ if one compares only areas with similar age profiles. In a similar way, one could exploit knowledge about unequal police control practices across areas to assess the degree to which monitoring bias affects substantive conclusions (e.g. by stratifying analyses by socio-economic or ethnic composition).
(4) Construct placebo tests by basing measures of local crime exposure on different types of offenses: Exploiting the scale and breadth of police records, one can construct different measures of local crime exposure based on different types of offenses. As offenses vary in the extent to which they can be observed or experienced by adolescents who live or attend school in particular neighborhoods, this allows one to devise so-called placebo tests. For example, let us assume that we find correlations between adolescents’ own engagement in delinquency and the extent of police-recorded graffiti spraying, littering, and disturbances to public order (all of which are visible). Then a placebo test could examine whether these correlations are absent if we relate delinquency with the extent of police-recorded crimes that tend to be invisible, e.g. tax or insurance fraud. Similarly, robustness analyses that focus only on crimes that have a high chance of being reported (such as property crimes) could be used to assess the degree to which reporting bias affects substantive conclusions. And to gauge the potential impact of monitoring bias, one could run analyses while disregarding crimes that are usually detected only through police control measures, such as drug offences or infringements of the right of residence.
(5) Identify and test specific implications of causal mechanisms: The number of police-recorded offenses within a particular area yields only a proxy measure of criminogenic exposure. As associations between crime exposure and self-reported delinquency could be due to different mechanisms (e.g. opportunities, motivations, normative cues, or social learning), it is difficult to interpret them without direct measures of specific contextual characteristics (e.g. collective efficacy). However, elaborating theoretical arguments can allow to derive specific implications and confirming such implications can make particular interpretations more credible (Lieberson & Horwich, Citation2008; Wikström & Kroneberg, Citation2022). For example, Situational Action Theory hypothesizes that individuals’ self-control and moral beliefs condition whether they are affected by the criminogeneity of settings, such as neighborhood or school environments (Wikström et al., Citation2012). Combining spatial police records data with survey data often yields many possibilities to test such specific implications because criminological surveys regularly include measures of theoretical concepts such as perceived detection risk and severity of sanctions, self-control, or moral beliefs that have been put forward as proximate causes of rule-breaking (Kroneberg et al., Citation2010; Loughran et al., Citation2016; Wikström et al., Citation2012).
(6) Include measures of adolescents’ leisure activities and activity spaces in the survey: A fundamental challenge for the advocated research design is the fact that adolescents’ activity spaces go beyond their residential and school environments. To be sure, the neighborhood and school represent the most relevant physical environments for youth.Footnote4 Moreover, where and how adolescents spend their time might itself be affected by their residential and school environments, for example, because their lifestyle depends on their learning history and peers. Still, one has to recognize the independent role of additional environments that adolescents seek out in their leisure time and that may be particularly criminogenic (e.g. less supervised). To account for this source of heterogeneity between individuals, it is important to measure adolescents’ leisure activities or activity spaces in the survey. This allows one to examine whether the impact of contexts depends on where and how adolescents spend most of their leisure time (Oberwittler, Citation2007).
(7) Include hypothetical scenarios in the survey: Another strategy to overcome the selection problem is the use of randomized scenarios. Our survey data comprise hypothetical scenarios of provocations that were randomly assigned to taking place in respondents’ schools or neighborhoods. This allows one to investigate how respondents’ violent intentions in response to these scenarios vary depending on characteristics of these environments. Even if such hypothetical scenarios tend to have lower external validity, they can provide useful additional evidence from another methodological angle (see, Wikström & Kroneberg, Citation2022).
Although identification of causal effects based on observational data is notoriously difficult, these strategies can be combined to produce much more robust and theoretically meaningful evidence on how local crime incidences relate to self-reported delinquency and violence.
Conclusion
In this article, we discussed how data from the police crime statistics can be used to add contextual information to criminological survey data. Many surveys on delinquency focus on subpopulations (e.g. youth) and lack the funds for independent community surveys as a way to measure crime-relevant characteristics of residential and other spatial contexts. Using police data to measure criminogenic exposure in academic-practitioner partnerships could therefore be a widely applicable strategy and allows researchers to study the role of exposure to crime in residential and school contexts for violence and delinquency.
We illustrated the potential and challenges involved in such a data linkage using a case study from Germany. Our partnership of academic researchers and a research unit of the police allowed us to link data from a four-wave longitudinal study of more than 3800 students in a region of Germany with spatially aggregated police data for the years 2013–2016. This academic-practitioner partnership benefited from the existence and involvement of a criminological research department on the side of the state police. In this department, police officers work hand in hand with researchers with backgrounds in sociology, psychology, criminology, geography, data science, and computer science. The police officers usually have additional university degrees in science fields such as sociology, psychology or criminology. The police officers are therefore able to act as translators between science and practice. Furthermore, the research department works door-to-door with the department responsible for the police crime statistics, which made data collection easier.
Our discussion showed how the simulation of nearby addresses can serve as a tool for anonymized data linkage, how knowledge of the local data collection practices is crucial to evaluate the geocoding accuracy of address-level crime data, and how sensitivity and implication analyses can help to reduce the remaining uncertainties at the analysis stage. It will be up to future research to demonstrate what kind of substantive insights this combination of survey and contextual police data affords.
In concluding, we would like to point out some lessons for data collection practices. Researchers who are about to set up criminological surveys should consider to elicit participants’ consent for sharing home address information with the police. In order to avoid selective non-participation, such consent should not be required for survey participation. Hence, our method of anonymized data linkage based on the simulation of nearby addresses will be relevant also in this situation to include respondents who do not provide consent.
Within law enforcement agencies, it remains important to further minimize the ambiguity of reporting guidelines (e.g. by reducing the number and regulating the use of optional reporting elements), to assist the police officers with user-friendly reporting systems (including equipment such as GPS devices, see, also Baraka & Murimi, Citation2021), to invest in the training of police officers in order to increase conformity with reporting guidelines and to improve the systems used to update records as information gets processed through different recording systems and modalities (e.g. initial documentation by hand, RMS, official crime statistics, see, Merbach & Seidensticker, Citation2019). For such measures to yield the desired effects, raising the awareness of the importance of data quality and evidence-based policing in the police force is a fundamental importance (Kalyal, Citation2020).
As there is no way to entirely remove all sources of measurement error, another set of measures should be directed towards enriching police data with additional information that can help analysts to assess the extent and direction of potential biases. For example, to interpret differences in the number of reported offences between different areas, it is important to control for the baseline chance that an offence gets reported. As this chance varies with the population density as well as with the extent of police control (particularly for certain offences), it would be valuable to collect such baseline information and link it to geo-spatial crime statistics already within research units of the police.
In general, it is clearly important to further improve and standardize data collection by the police. Although data from the RMS is not primarily collected for research purposes, modern evidence-based policing requires sustained investments into high-quality data that provide the basis for improving the effectiveness and efficiency of law enforcement measures.
Disclosure statement
No potential conflict of interest was reported by the author(s).
Additional information
Funding
Notes on contributors
Clemens Kroneberg
Clemens Kroneberg is Professor of Sociology at the Institute of Sociology and Social Psychology and Speaker of the Competence Area ‘Social and Economic Behavior’ at the University of Cologne. He has served as consulting editor of the American Journal of Sociology and is a member of the ECONtribute Center of Excellence, external fellow of the Mannheim Centre for European Social Research and Fellow of the European Academy of Sociology. His research focuses on crime and deviance, diversity and boundary making, and action theory and social networks. In recent years, he has directed two large-scale longitudinal studies in the school context (DFG project ‘Friendship and Violence in Adolescence’ and ERC Starting Grant project ‘Social Integration and Boundary Making in Adolescence’). ORCID: 0000-0001-8838-1087 Twitter: @c_kroneberg
Sven Lenkewitz
Sven Lenkewitz is a Ph.D. student at the Institute of Sociology and Social Psychology at the University of Cologne and a member of the project ‘Juvenile delinquency in urban school and residential contexts.’ He obtained his Master’s degree in ‘Sociology and Social Research’ from the University of Bremen and previously worked in the research projects ‘Winners of Globalization? A Study on the Emergence of a Transnational Elite in Europe’ and the ERC project ‘Social Boundary Making and Integration in Adolescence.’ His current research interests are education and social inequality, social integration of (children) of immigrants, crime and neighborhood effects, and social network analysis.
André Ernst
André Ernst is a Ph.D. student at the Institute of Sociology and Social Psychology at the University of Cologne and the scientific coordinator of the GESIS workshops at the GESIS - Leibniz Institute for the Social Sciences. Before his current position, he was a member of the research projects ‘Violence and Suicide in Youth Correctional Facilities’, ‘Friendship and Violence in Adolescent’, and ‘Juvenile delinquency in urban school and residential contexts.’ His current research interests are deviant behavior, action theories, context effects, analytical sociology, and analytical criminology. His doctoral thesis investigates the impact of criminogenic exposure on deviant behavior while accounting for the selection of kinds-of-people into kinds-of-places.
Maike Meyer
Maike Meyer is Head of the Criminological Research Department of the State Office of Criminal Investigation North Rhine-Westphalia. The department conducts applied criminological research projects that pursue the overriding goal of optimizing criminal investigation and crime prevention. Before taking on her position, she studied sociology and political science at the Universities of Bielefeld and Münster. Her research focuses on various crime phenomena, including juvenile delinquency, (sexual) violence, white-collar crime, and property crime
Kai Seidensticker
Kai Seidensticker is a police officer, sociologist and criminologist, who works as a researcher at the Criminological Research Department of the State Office of Criminal Investigation North Rhine-Westphalia. The department conducts applied criminological research projects that pursue the overriding goal of optimizing criminal investigation and crime prevention. He studied at the Universities of Hamburg and Bochum (Germany). His main areas of research are police organization, masculinity, leadership, and the connection between crime and place.
Notes
1. Although not the subject of our project, this has to be taken to account when interpreting crime trends since recording guidelines often change over time and may affect the registration of crime (Kersting & Erdmann, Citation2014, p. 23).
2. In the process of data cleaning (e.g. correcting typos or spelling out abbreviations), some addresses were identified that had to be removed due to incomprehensibility, missing house number or nonsensical information.
3. Another possibility would have been to ask respondents to draw their neighborhood on a map as part of the survey. While this approach could allow one to capture respondents’ relevant environments more accurately, it is also more demanding (particularly for adolescents) and time-intensive. Moreover, subjective ‘neighborhood’ definitions tend to conflate respondents’ forced exposure to a given residential and school environment with their much more endogenous activity spaces.
4. For example, a recent U.S. study showed that, on average, youth (ages 11 to 17) spend two thirds of their waking-time inside their neighborhood (while mostly at home), and the fraction is estimated to approach three quarters if there is an eligible school in the neighborhood (Browning et al., Citation2021). Exposure to the school environment during the week is also high due to mandatory schooling (and estimated to range between 21 and 36% of waking-time depending on age in the Peterborough Adolescent and Young Adult Development Study; see, Wikström et al., Citation2012, pp. 272–273).
References
- Averdijk, M., & Elffers, H. (2012). The discrepancy between survey-based victim accounts and police reports revisited. International Review of Victimology, 18(2), 91–107. https://doi.org/https://doi.org/10.1177/0269758011432955
- Baraka, G. E., & Murimi, S. K. (2021). Why geographic information systems in spatiotemporal crime analysis? Attitude of Kenyan police officers. Police Practice and Research, 22(5), 1453–1468. https://doi.org/https://doi.org/10.1080/15614263.2019.1689131
- Brännström, L., & Rojas, Y. (2012). Rethinking the long-term consequences of growing up in a disadvantaged neighbourhood: Lessons from Sweden. Housing Studies, 27(6), 729–747. https://doi.org/https://doi.org/10.1080/02673037.2012.714460
- Browning, C. R., Calder, C. A., Boettner, B., Tarrence, J., Khan, K., Soller, B., & Ford, J. L. (2021). Neighborhoods, activity spaces, and the span of adolescent exposures. American Sociological Review, 86(2), 201–233. https://doi.org/https://doi.org/10.1177/0003122421994219
- Buil-Gil, D., Moretti, A., & Langton, S. H. (2021). The accuracy of crime statistics: Assessing the impact of police data bias on geographic crime analysis. Journal of Experimental Criminology. https://doi.org/https://doi.org/10.1007/s11292-021-09457-y
- Chang, L.-Y., Wang, M.-Y., & Tsai, P.-S. (2016). Neighborhood disadvantage and physical aggression in children and adolescents: A systematic review and meta-analysis of multilevel studies. Aggressive Behavior, 42(5), 441–454. https://doi.org/https://doi.org/10.1002/ab.21641
- Clarke, R. V. (1997). Situational crime prevention. Successful case studies. Harrow and Heston.
- Elliott, D. S., Menard, S., Rankin, B. H., Elliott, A., Huizinga, D., & Wilson, W. J. (2006). Good kids from bad neighborhoods. Successful development in social context. Cambridge University Press.
- Gaub, J., Wallace, D., Todak, N., & White, M. (2018). Overcoming the challenges of administrative data: A case study involving police body-worn cameras. SAGE Research Methods Cases. https://doi.org/https://doi.org/10.4135/9781526437617
- Gerell, M. (2017). Smallest is better? The spatial distribution of arson and the modifiable areal unit problem. Journal of Quantitative Criminology, 33(2), 293–318. https://doi.org/https://doi.org/10.1007/s10940-016-9297-6
- Haberman, C. P., Clutter, J. E., & Lee, H. (2021). A robbery is a robbery is a robbery? Exploring crime specificity in official police incident data. Police Practice and Research, 1–15. https://doi.org/https://doi.org/10.1080/15614263.2021.2009345
- Hart, T. C., & Rennison, C. (2003). Reporting crime to the police, 1992-2000. Special Report. Bureau of Justice Statistics. https://static.prisonpolicy.org/scans/bjs/rcp00.pdf.
- Hart, T. C., & Zandbergen, P. A. (2013). Reference data and geocoding quality: Examining completeness and positional accuracy of street geocoded crime incidents. Policing: An International Journal of Police Strategies & Management, 36(2), 263–294. https://doi.org/https://doi.org/10.1108/13639511311329705
- Hartung, A., & Hillmert, S. (2019). Assessing the spatial scale of context effects: The example of neighbourhoods’ educational composition and its relevance for individual aspirations. Social Science Research, (83), 102308. https://doi.org/https://doi.org/10.1016/j.ssresearch.2019.05.001
- Hawkins, J. D., & Catalano, R. F., Jr. (1992). Communities that care: Action for drug abuse prevention. Jossey-Bass.
- Hipp, J. R., & Boessen, A. (2013). Egohoods as waves washing across the city: A New measure of ‘neighborhoods. Criminology, 51(2), 287–327. https://doi.org/https://doi.org/10.1111/1745-9125.12006
- HMIC. (2000). On the Record. https://www.justiceinspectorates.gov.uk/hmicfrs/media/on-the-record-20000701.pdf
- Home Office. (2000). Review of police forces’ crime-recording practices. Home Office Research Study, 204.
- Kalyal, H. (2020). “Well, there’s a more scientific way to do it!”: Factors influencing receptivity to evidence-based practices in police organizations. Police Practice and Research, 21(6), 609–623. https://doi.org/https://doi.org/10.1080/15614263.2019.1608548
- Keizer, K., Lindenberg, S., & Steg, L. (2008). The spreading of disorder. Science, 322(5908), 1681–1685. https://doi.org/https://doi.org/10.1126/science.1161405
- Kersting, S., & Erdmann, J. (2014). Analyse von Hellfelddaten – Darstellung von Problemen, Besonderheiten und Fallstricken anhand ausgewählter Praxisbeispiele. In S. Eifler, and D. Pollich (Eds.), Empirische Forschung über Kriminalität (pp. 9–30). SpringerVS, Wiesbaden. https://doi.org/https://doi.org/10.1007/978-3-531-18994-9_2
- Keuschnigg, M., & Wolbring, T. (2015). Disorder, social capital, and norm violation: Three field experiments on the broken windows thesis. Rationality and Society, 27(1), 96–126. https://doi.org/https://doi.org/10.1177/1043463114561749
- Kinkeldey, C., MacEachren, A., & Schiewe, J. (2014). How to assess visual communication of uncertainty? A systematic review of geospatial uncertainty visualisation user studies. The Catographic Journal, 51(4), 372–386. https://doi.org/https://doi.org/10.1179/1743277414Y.0000000099
- Kroneberg, C., Heintze, I., & Mehlkop, G. (2010). The interplay of moral norms and instrumental incentives in crime causation. Criminology, 48(1), 259–294. https://doi.org/https://doi.org/10.1111/j.1745-9125.2010.00187.x
- Levitt, S. (1998). The relationship between crime reporting and police: Implications for the use of uniform crime reports. Journal of Quantitative Criminology, 14(1), 61–81. https://doi.org/https://doi.org/10.1023/A:1023096425367
- Lieberson, S., & Horwich, J. (2008). Implication analysis: A pragmatic proposal for linking theory and data in the social sciences. Sociological Methodology, 38(1), 1–50. https://doi.org/https://doi.org/10.1111/j.1467-9531.2008.00199.x
- Loughran, T. A., Paternoster, R., Chalfin, A., & Wilson, T. (2016). Can rational choice be considered a general theory of crime? Evidence from individual-level panel data. Criminology, 54(1), 86–112. https://doi.org/https://doi.org/10.1111/1745-9125.12097
- Merbach, L., & Seidensticker, K. (2019). Bitship Troopers – Big Data und informationsgeleitete Polizeiarbeit der Zukunft. In E. Kühne Ed., Die Zukunft der Polizeiarbeit - Polizeiarbeit der Zukunft, Rothenburger Beiträge (Vol. 100/101, pp. 143–156). Part II.
- Microm Consumer Marketing. (2010). Datenhandbuch: Arbeitsunterlagen für Microm MARKET & GEO. Microm GmbH.
- Oberwittler, D. (2004). A multilevel analysis of neighbourhood contextual effects on serious juvenile offending: The role of subcultural values and social disorganization. European Journal of Criminology, 1(2), 201–235. https://doi.org/https://doi.org/10.1177/1477370804041248
- Oberwittler, D. (2007). The effects of neighbourhood poverty on adolescent problem behaviours: A multi-level analysis differentiated by gender and ethnicity. Housing Studies, 22(5), 781–803. https://doi.org/https://doi.org/10.1080/02673030701474727
- Oberwittler, D. (2018). Jugendkriminalität in sozialen Kontexten – Zur Rolle von Wohngebieten und Schulen bei der Verstärkung von abweichendem Verhalten Jugendlicher. In B. Dollinger & H. Schmidt-Semisch (Eds.), Handbuch Jugendkriminalität. Interdisziplinäre Perspektiven (pp. 297–316). Springer VS.
- Ratcliffe, J. H. (2004). The hotspot matrix: A framework for the spatio‐temporal targeting of crime reduction. Police Practice and Research, 5(1), 5–23. https://doi.org/https://doi.org/10.1080/1561426042000191305
- Ratcliffe, J. H. (2010). Crime mapping: Spatial and temporal challenges. In A. Piquero & D. Weisburd (Eds.), Handbook of quantitative criminology (pp. 5–24). Springer.
- Sharkey, P., & Faber, J. W. (2014). Where, when, why, and for whom do residential contexts matter? Moving away from the dichotomous understanding of neighborhood effects. Annual Review of Sociology, 40(1), 559–579. https://doi.org/https://doi.org/10.1146/annurev-soc-071913-043350
- State Office of Criminal Investigations North Rhine-Westphalia. (2006). Das Anzeigeverhalten von Kriminalitätsopfern.
- State Office of Criminal Investigations North Rhine-Westphalia. (2020). Sicherheit und Gewalt in Nordrhein-Westfalen.
- Weisburd, D., Groff, E. R., & Yang, S.-M. (2012). The criminology of place and our understanding of the crime problem. Oxford University Press.
- Wheeler, A. P., Gerell, M., & Yoo, Y. (2020). Testing the spatial accuracy of address-based geocoding for gunshot locations. The Professional Geographer, 72(3), 398–410. https://doi.org/https://doi.org/10.1080/00330124.2020.1730195
- Wikström, P.-O. (2021 in press). Towards a true social ecology of crime: On the limitations of a criminology without people. In A. Liebling, J. Shapland, R. Sparks, and J. Tankebe (Eds.), Crime, justice, and social order: Essays in Honour of A. E. Bottoms.Oxford University Press.
- Wikström, P.-O., & Kroneberg, C. (2022). Analytic criminology: Mechanisms and methods in the explanation of crime and its causes. Annual Review of Criminology, 5(1), 179–203. https://doi.org/https://doi.org/10.1146/annurev-criminol-030920-091320
- Wikström, P.-O., Mann, R. P., & Hardie, B. (2018). Young people’s differential vulnerability to criminogenic exposure: Bridging the gap between people- and place-oriented approaches in the study of crime causation. European Journal of Criminology, 15(1), 10–31. https://doi.org/https://doi.org/10.1177/1477370817732477
- Wikström, P.-O., Oberwittler, D., Treiber, K., & Hardie, B. (2012). Breaking rules: The social and situational dynamics of young people’s urban crime. Oxford University Press.
- Young, J. (1992). Realistic research as a basis for local criminal justice policy. In J. Lowmann & B. D. MacLean (Eds.), Realist criminology. crime control and policing in the 1990s (pp. 33–72).