
Abstract
Objectives
The present study examined associations between immunometabolic characteristics (IMCs) and depressive symptom profiles (DSPs) in probands with lifetime diagnoses of depression and/or anxiety disorders and their siblings.
Methods
Data were from the Netherlands Study of Depression and Anxiety, comprising 256 probands with lifetime diagnoses of depression and/or anxiety and their 380 siblings. Measured IMCs included blood pressure, waist circumference, and levels of glucose, triglycerides, HDL cholesterol, CRP, TNF-α and IL-6. DSPs included mood, cognitive, somatic and atypical-like profiles. We cross-sectionally examined whether DSPs were associated with IMCs within probands and within siblings, and whether DSPs were associated with IMCs between probands and siblings.
Results
Within probands and within siblings, higher BMI and waist circumference were associated with higher somatic and atypical-like profiles. Other IMCs (IL-6, glucose and HDL cholesterol) were significantly related to DSPs either within probands or within siblings. DSPs and IMCs were not associated between probands and siblings.
Conclusions
The results suggest that there is a familial component for each trait, but no common familial factors for the association between DSPs and IMCs. Alternative mechanisms, such as direct causal effects or non-shared environmental risk factors, may better fit these results.
Introduction
Epidemiological evidence has shown that depression is associated with alterations in immunometabolic characteristics (IMCs). It has been reported that depressed subjects, as compared to healthy controls, have increased serum levels of the inflammatory markers C-reactive protein (CRP), interleukin-6 (IL-6) and tumour-necrosis-factor-α (TNF-α) (Dowlati et al. Citation2010; Haapakoski et al. Citation2015; Kohler et al. Citation2017), increased prevalence of metabolic syndrome (Pan et al. Citation2012; Marazziti et al. Citation2014; Vancampfort et al. Citation2014) and differences in BMI (de Wit et al. Citation2009). Analyses of the single metabolic dysregulation components of metabolic syndrome revealed that abdominal adiposity, lower HDL cholesterol levels and hypertriglyceridaemia were most frequently associated with depression or depression severity (van Reedt Dortland et al. Citation2009, Citation2010; Marazziti et al. Citation2014; Vancampfort et al. Citation2014; Gustavo Ruas et al. Citation2016), and associations with blood pressure and fasting glucose were less often found or in opposing directions (Kinder et al. Citation2004; Herva et al. Citation2006; Hildrum et al. Citation2009; Muhtz et al. Citation2009; Kahl et al. Citation2012; Meng et al. Citation2012; Vancampfort et al. Citation2014; Moreira et al. Citation2016; Bhat et al. Citation2017).
There is variability in the magnitude or even direction of associations between depression and IMCs, which is likely a consequence of the clinical heterogeneity of depression. It has been suggested that altered IMCs are more prominent in a subgroup of depressed cases endorsing symptoms of atypical depression, such as symptoms reflecting altered energy intake and homeostasis such as hypersomnia and hyperphagia (van Reedt Dortland et al. Citation2010; Lamers et al. Citation2013; Takeuchi et al. Citation2013; Glaus et al. Citation2014; Hickman et al. Citation2014; Lasserre et al. Citation2014; Lamers, Bot, et al. Citation2016; Milaneschi, Lamers, Peyrot, et al. Citation2017; Lamers et al. Citation2018; Simmons et al. Citation2018; Wiltink et al. Citation2018). For instance, within the total group of depressed cases, levels of CRP, TNF-α and IL-6 could be distinguished in cases with increased appetite during a major depressive episode from those without having this symptom endorsed (Hickman et al. Citation2014; Lamers et al. Citation2018; Simmons et al. Citation2018).
Both depression and IMCs seem to expose a certain degree of familiality. Depression is known to run in families (Low et al. Citation2008; Milne et al. Citation2009; Merikangas et al. Citation2014; Havinga et al. Citation2017; Telman et al. Citation2018; Lawrence et al. Citation2019). Havinga et al. (Citation2017) showed that 65% of offspring of patients with a depressive and/or anxiety disorder developed a depressive or anxiety disorder themselves by the age of 35, which is 2 to 3 times higher compared to the general Dutch population. Also, family members tend to resemble each other regarding BMI, waist circumference, systolic and diastolic blood pressure and levels of triglycerides, HDL cholesterol and glucose (Borecki et al. Citation1998; Park et al. Citation2006; Chien et al. Citation2007; Chiu et al. Citation2007; Feng et al. Citation2008; Stirnadel et al. Citation2008; Al-Daghri et al. Citation2011; Johnson et al. Citation2012; Murrin et al. Citation2012; Santos et al. Citation2013; Khan et al. Citation2014; Dong et al. Citation2017). Familial resemblance of inflammatory marker levels is, however, less often found (Haddy et al. Citation2005; Al-Daghri et al. Citation2011; Dong et al. Citation2017). Studies examining familial clustering of depression together with IMCs (i.e. increased occurrence of IMCs in families in which depression is present or vice versa) are scarce. Most studies published so far have only focussed on BMI; Increased BMI or obesity in one or both parents were shown to be predictive of depression risk in their offspring (Eley et al. Citation2004; Marmorstein and Iacono Citation2016). This has, however, not been consistently found (Richardson et al. Citation2003; Mamun et al. Citation2005).
Recently, familial aggregation analyses of DSM-IV-based (American Psychiatric Association Citation2013) depressive subtypes revealed that atypical depression in probands was significantly associated with atypical depression in relatives (Lamers, Cui, et al. Citation2016). Using the same dataset, it has been shown that atypical depression in probands was associated with a higher BMI and overweight in relatives (Glaus et al. Citation2019). No other studies have been published that examined cross-trait associations of (subtypes of) depression and other metabolic characteristics between relatives.
The present study examines the co-occurrence of IMCs and depressive symptom profiles (DSPs) in probands with depressive and anxiety disorders of the Netherlands Study of Depression and Anxiety (NESDA) and their full-siblings, all well characterised in terms of psychiatric history and immunometabolic biological markers. The aims of this study were to examine whether associations between IMCs and DSPs in probands with psychopathology are resembled in their siblings and whether the IMCs and DSPs are correlated between probands and siblings.
Materials and methods
Sample
Participants were part of NESDA, an ongoing longitudinal cohort study into the long-term course and consequences of depressive and anxiety disorders. A description of the study rationale, design, and methods is given elsewhere (Penninx et al. Citation2008). Briefly, the initial sample comprised 2,981 participants between the ages of 18 and 65 who were recruited between 2004 and 2007 and from the community (19.0%), primary care (54.0%), and specialised mental health care settings (27.0%). These participants were healthy controls or had a current or prior history of depressive and/or an anxiety disorder. Participants were not included when they did not speak fluently Dutch or had a primary other psychiatric diagnoses of, for instance, bipolar, psychotic, obsessive-compulsive, or severe addictive disorder. A Diagnostic and Statistical Manual of Mental Disorders (DSM)-IV depression and anxiety diagnosis was established with the use of the Composite Interview Diagnostic Instrument (CIDI) – lifetime version 2.1 (World Health Organization Citation1997). Assessments were performed at one-, two-, four-, six- and nine-year follow-up waves. Except for the one-year follow-up wave, each follow-up assessment consists of a face-to-face clinic visit, in which baseline assessments were repeated. The Ethical Committee of all participating universities approved the NESDA project and all participants provided written informed consent.
At 9-year follow-up, 367 full-siblings from 246 already participating individuals were additionally recruited. These original proband participants had to be diagnosed with anxiety (panic disorder, social phobia, generalised anxiety disorder) and/or depressive disorder (major depressive disorder, dysthymia) during at least two out of four previous NESDA face-to-face interviews, had to have participated in at least three face-to-face interviews at previous waves, and had to have given permission to invite their sibling for participation. Siblings were included when they were aged between 18 and 77, had the same biological father and mother as the proband, had no prior history of psychiatric disorders other than depression or anxiety, and provided informed consent to participate. There were 23 full-siblings from 10 families from the original NESDA cohort who all participated at the 9-year follow-up wave and met all inclusion criteria and were included as well. A group of 293 healthy controls was additionally selected for the present analyses. Inclusion criteria were that they had a healthy control status (i.e. no lifetime anxiety/depression diagnosis at the time of assessment), participated in the face-to-face interview, were unrelated to the probands, siblings and each other and did not have any full-sibling or parent with a lifetime diagnosis of major depressive disorder, dysthymia, or an anxiety disorder. Relatives’ disorder history was obtained via the Family Tree Inventory (Fyer and Weissman Citation1999) or pedigree data. Supplementary Figure 1 provides an overview of the inclusion criteria of the three groups in this subsample of NESDA.
The analytic sample used in the current study included 929 participants, of whom 256 probands, 380 siblings and 293 unrelated healthy controls. Family sizes differed; we analysed 168, 61, 20, 5, and 2 families with family sizes of, respectively, 2, 3, 4, 5, and 6 participants.
Immunometabolic indicators
Metabolic markers
We analysed the individual components of metabolic syndrome (i.e. systolic blood pressure, diastolic blood pressure, waist circumference, glucose level, triglycerides level, and HDL cholesterol level) (Grundy et al. Citation2005), and BMI as continuous measures.
BMI was calculated in kg/m2. Waist circumference was measured with a measuring tape at the central point between the lowest front rib and the pelvic edge. Waist circumference values of pregnant women were excluded from the current analyses. Levels of triglycerides, HDL cholesterol and glucose were determined by collecting blood samples in the morning after an overnight fast. Blood pressure was measured twice during supine rest on the right arm with the use of Omron M4-I HEM-752A, and averaged over these measurements.
Inflammatory markers
The inflammatory markers high-sensitive CRP, IL-6 and TNF-α levels were measured across five different labs. Plasma levels of CRP were measured in duplicate by an in-house high-sensitivity enzyme-linked immunosorbent assay (ELISA) based on purified protein and polyclonal anti-CRP antibodies (Dako, Glostrup, Denmark). IL-6 and TNF-α levels were measured with Human Quantikine HS ELISA Kits of R&D systems. Lower detection limits were 0.1 mg/L, 0.1 pg/mL and 0.1 pg/mL for respectively CRP, IL-6 and TNF-α. Supplementary Table 1 contains the number of missing values of biological variables. Samples with missing values for a biomarker were removed from the analysis for that biomarker.
For all blood level variables, we truncated values >3SD at 3SD + mean and log-transformed them prior to analyses.
Depressive symptom profiles
On each follow-up wave, depression severity scores were assessed with the Inventory Depressive Symptomatology (IDS) (Rush et al. Citation1996). This 30-item self-rated questionnaire assesses the presence of all symptom domains of a major depressive episode in the past seven days on a 0-3 scale. The item on mood in relation to the time of day was recoded, varying from ‘no diurnal variation’ or ‘diurnal variation but not with worse mood in the morning’ (0) to ‘severe diurnal variation with worse mood in the morning’ (3).
We distinguished four profiles of depressive symptoms (i.e. DSPs), namely the mood, cognitive, somatic and atypical-like profiles, largely based on Schaakxs et al. (Citation2017). The mood profile ranges from 0 to 27 and consists of the following nine symptoms: the diminished capacity for pleasure or enjoyment, diminished interest in people or activities, diminished quality of mood, diminished mood reactivity, feeling anxious or tense, feeling irritable, feeling sad, interpersonal sensitivity, and panic/phobia symptoms. The cognitive profile ranges from 0 to 12 and consists of four symptoms, namely concentration/decision-making problems, future pessimism, self-criticism and blame, and suicidal thoughts. The somatic profile ranges from 0 to 51 and consists of 17 symptoms, namely aches and pains, appetite decrease, appetite increase, weight decrease, weight increase, constipation/diarrhoea, diurnal variation with a worse mood in the morning, early morning awakening, low energy level, other bodily symptoms, problems falling asleep, problems sleeping during the night, psychomotor agitation, psychomotor retardation, reduced interest in sex, hypersomnia, and leaden paralysis. We composed an atypical-like profile, which consists of five symptoms, namely appetite increase, weight increase, low energy level, hypersomnia and leaden paralysis and ranges from 0 to 15. Note that the atypical-like profile falls under the somatic profile, however, it contains fewer symptoms.
For each DSP and for each follow-up wave separately, we have imputed missing individual IDS symptom items with the mean of the remaining items of this specific profile, only when less than 20% of the profile items were missing. In order to create stable variables, the sum scores of the participants who participated at multiple waves (controls and probands) were averaged across waves. This is especially informative for probands since these individuals had depressive and/or anxious episodes during at least two prior face-to-face interviews. By averaging these sum scores across waves, variance during active episodes is likely to be captured better. The sibling group participated at nine-year follow up for the first time, so their sum scores were based solely on that time point.
The main focus of this paper is the atypical-like symptom profile in relation to IMCs. However, we also analysed the other DSPs in order to check whether associations are specific for the atypical-like profile or other profiles as well.
Covariates
Potential confounding variables were sex, age, an education level (continuous, in years), current smoking status (yes vs no), and use of antidiabetic (Anatomical Therapeutic Chemical [ATC]: A10), antihypertensive (ATC: C02, C03, C07, C08, C09) and non-steroidal anti-inflammatory medication (ATC: M01A, M01B, A07EB, A07EC) and treatment for elevated triglycerides and reduced HDL cholesterol levels (C10AB, C10AD, C10BA01). The use of medication was based on drug container inspection of all medications used in the past month, classified according to the World Health Organization ATC classification (WHO Collaborating Centre for Drug Statistics Methodology Citation2007).
Statistical analyses
Variables were reported as a percentage or mean (±SD). First, differences in sociodemographic and clinical across groups (proband, sibling, healthy control) were analysed with logistic and linear mixed-effects regressions for, respectively, categorical and continuous outcome variables; family structure (a unique family code was assigned to each family) was included as a random intercept to account for within-family clustering. Then, the same analytical model was used to examine the differences in IMCs between probands, siblings and healthy controls after adjusting for age, sex and smoking status. Multiple testing correction was done based on the Benjamini-Hochberg procedure (Benjamini and Hochberg Citation1995). A False Discovery Rate (FDR) of .05 is considered as the threshold for significance.
For subsequent analyses, we focussed on the groups of probands and their siblings. Firstly, we examined whether DSPs were associated with the IMCs within the probands, using linear models including sex and age as covariates, and within the siblings, using linear mixed models including sex and age as covariates and family structure as a random intercept. Secondly, we examined whether probands’ DSPs and IMCs were associated with the same trait in their sibling, by fitting linear mixed models regressing the siblings’ feature on the same feature of the probands, including sex and age as covariates and family structure as a random intercept. Thirdly, we carried out two sets of cross-trait analyses between DSPs and IMCs between probands and their siblings: (1) we tested whether probands’ DSPs were associated with IMCs in their siblings and (2) we tested whether probands’ IMCs were associated with DSPs in their siblings. These analyses were again based on mixed models, with family structure as random intercept and age and sex of the sibling as covariates. In the first cross-trait analyses, siblings’ IMCs were regressed on the DSPs of the probands and in the second cross-trait analyses, siblings’ DSPs were regressed on IMCs of the probands. Finally, we re-ran the cross-trait analyses after exclusion of individuals with a CRP level > 10 mg/L, which might be indicative of infection (Nehring and Patel Citation2019).
All statistical analyses were conducted with the use of R software version 3.6.0 (R Core Team Citation2019).
Results
presents sociodemographic and clinical characteristics of probands, siblings and healthy controls. Differences across groups were observed regarding sociodemographic features sex and age; Probands were more likely to be female (73.4%) compared to siblings (55.0%) and healthy controls (60.8%). Healthy controls had the oldest age (mean 52.6 ± 13.7) followed by siblings (mean 50.5 ± 13.2) and probands (mean 48.5 ± 13.1). As expected, siblings also had higher depression severity than controls, but probands had the highest scores. The use of antihypertensives differed across groups with healthy controls scoring highest and siblings lowest. Comparisons of IMCs across probands, siblings and controls while adjusting for age, sex and current smoking status did not highlight significant differences between the three groups ().
Table 1. Sociodemographic and clinical sample characteristics (n = 929).
Table 2. Means of immunometabolic markers, adjusted for age, sex and smoking status, across probands, siblings and controls.
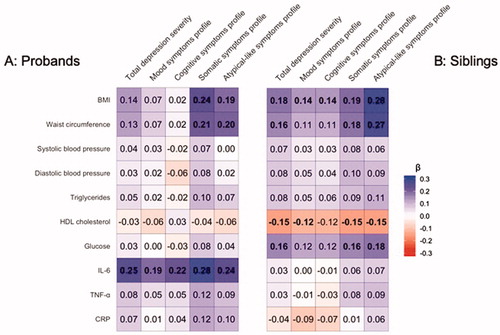
In , standardised effects sizes of linear models and linear mixed models for respectively probands and siblings with the DSPs as the predictors and the IMCs as outcome measures are shown, while including age and sex as covariates. Effect sizes were computed in the proband group and sibling group separately. Supplementary Tables 2 and 3 provide the effect sizes, standard errors and significance levels. Within both probands and siblings, BMI and waist circumference were significantly associated with somatic symptom profile (probands’ BMI: β = 0.24, p = 1.67E − 04, siblings’ BMI: β = 0.19, p = 2.59E − 04) and atypical-like symptom profile (probands’ BMI: β = 0.19, p = 2.45E − 03, siblings’ BMI: β = 0.28, p = 3.57E − 08). Only in probands, higher IL-6 levels were significantly associated with each of the DSPs, as well as with the total severity. Only in siblings, lower HDL cholesterol levels were associated with all DSPs except for the cognitive symptom profile, and higher glucose levels were associated with somatic and atypical-like symptom profiles and total depression severity. We re-ran these analyses after including the current use of antihypertensive, lipid-lowering, antidiabetic and anti-inflammatory medication in the models examining blood pressure, triglycerides and HDL cholesterol levels, glucose levels and inflammatory marker levels, respectively, which yielded no differences in the results within both the proband and sibling groups.
Figure 1. Regression coefficients of associations between depressive symptom profiles and immunometabolic characteristics within probands (A) and within siblings (B).
Next, as a benchmark, we examined whether each of probands’ DSPs and IMCs were associated with the same trait in their siblings. presents the results of these analyses, showing that each DSP and each IMC of probands is significantly associated (at FDR < 5%) with the same trait in their siblings.
Table 3. Associations between the same traits in probands and siblings.
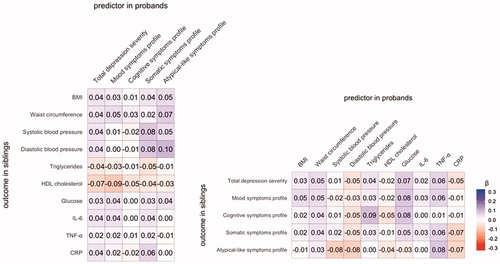
Finally, we applied linear mixed effect models to examine if the probands’ DSPs were associated with IMCs in their siblings (). No associations were found. Also, the standardised regression coefficients of the linear mixed effect models of the probands’ IMCs as a function of DSPs of their siblings were computed (). None of the IMCs in probands were significantly associated with any of the symptom profiles in the siblings. The effect sizes, standard errors and p values of the analyses between probands and siblings are provided in Supplementary Tables 4 and 5.
Figure 2. Regression coefficients of associations between depressive symptom profiles and immunometabolic characteristics in probands and their siblings.
In order to examine whether the (lack of) associations between inflammatory markers and DSPs were influenced by current infections present in the individuals, we reran the analyses after exclusion of 19 participants with CRP levels >10 mg/L. The results within probands, within siblings as well as across probands and siblings remained unchanged (results not shown).
Discussion
The present study examined associations between immunometabolic characteristics and depressive symptom profiles in probands with lifetime diagnoses of depression and/or anxiety disorders and their siblings. The clinical heterogeneity of depression was confirmed in the present analyses, showing specific associations for the somatic profile and the atypical-like profile (which is nested within the somatic profile) and BMI and waist circumference (which are both related to adiposity). Importantly, these specific associations were significantly present both within probands and siblings. Adiposity-related traits have been associated with atypical depression before (Lasserre et al. Citation2014). Other immunometabolic markers (IL-6, glucose and HDL cholesterol) were significantly related to symptom profiles either within probands or within siblings. In contrast, CRP, TNF-α, blood pressure and triglyceride levels were not related to any of the tested symptom profiles.
The specific association between adiposity-related traits and somatic/atypical-like symptom profiles found in probands was also seen in their siblings. In addition, depressive and immunometabolic traits in probands were associated with similar traits in siblings indicating significant resemblance between siblings. Nevertheless, adiposity-related traits in probands were not associated with somatic/atypical-like symptoms in their siblings, nor were somatic/atypical-like symptoms in probands associated with adiposity-related traits in their siblings. These results depict a connection (which is consistent within probands and within their siblings) that is not seen across probands and siblings. These findings suggest that the co-occurrence of adiposity-related traits and somatic/atypical-like symptoms within individuals is not due to familial factors, either genetics or shared family environmental factors.
Since there is a lack of association between DSPs of probands and IMCs across probands and siblings, it could be that the associations between somatic/atypical-like depressive symptom profiles and adiposity-related traits within probands and within siblings are explained by non-shared environmental risk factors later in life, such as lifestyle factors. For instance, sedentary behaviour, poor food preference/diet and smoking behaviour have been associated with depression before (Weinberger et al. Citation2017; Gibson-Smith et al. Citation2018; Difrancesco et al. Citation2019). Twin studies have suggested that some of these lifestyle factors are largely influenced by the environment unique to each individual (Navarro-Allende et al. Citation2008; Piirtola et al. Citation2014; Smith et al. Citation2016). Also, spousal influences on smoking behaviour (Homish and Leonard Citation2005) and physical activity (Cobb et al. Citation2016) have been observed, suggesting a substantial contribution of currently shared household environment, even when there is no biologically relatedness. So, the absence of associations between DSPs and IMCs between probands and siblings could be a result of these non-shared risk factors. Sibling studies including lifestyle and dietary factors may provide insights into the possible causal or mediating role of such lifestyle factors in relation to DSPs and adiposity-related traits.
Our results are not entirely consistent with those of Glaus et al. (Citation2019), who found that atypical depression diagnosis in probands was associated with a higher BMI and overweight in their first-degree relatives, suggesting a familial association due to shared risk factors. This study contrasted a lifetime DSM-based depression diagnosis of probands against controls while we analysed DSPs within lifetime cases exclusively. It might be that Glaus et al. (Citation2019) focussed on more severe cases of specific symptoms (i.e. subtype diagnosis) and therefore detected an association.
Previous studies have suggested that shared genetic risk factors played a role in the relationship between depression and metabolic alterations. Genetic overlap of adiposity-related traits with depression in general (among which waist circumference and BMI) (Wray et al. Citation2018; Howard et al. Citation2019), and with specific atypical symptoms in particular (Milaneschi, Lamers, Peyrot, et al. Citation2017) are seen. The genetic overlap is consistent with two scenarios. In the first one, the same genetic risk variants impact on two different traits through distinct pathways (‘horizontal pleiotropy’) (Hemani et al. Citation2018). In the second, genetic variants impact on one trait that, in turn, influences the development of the second trait (‘vertical pleiotropy’) (Hemani et al. Citation2018). The results of the present study may fit into the scenario of vertical pleiotropy. What is ‘transmitted’ between probands and siblings is not a shared liability for immunometabolic alterations and depressive symptom profiles. Instead, only the liability for one of these traits is shared between siblings, and when the phenotype related to this liability is expressed beyond certain levels (e.g. high level of BMI, high levels of circulating inflammatory or metabolic markers) and under certain conditions (e.g. exposure to combinations of other risk factors), it may influence the development of second traits (e.g. depressive symptom profiles).
A causal relationship in the form of vertical pleiotropy is supported by previous findings on the genetic level; Mendelian Randomisation studies provided evidence for causality of an increased BMI for depression liability but not vice versa (van den Broek et al. Citation2018; Wray et al. Citation2018). Another study confirmed that the causal relationship seems to be driven by body fat while non-fat mass did not play a role (Speed et al. Citation2019). Increased adiposity could mediate the association between genetic risk factors and depression through psychological mechanisms (e.g. stigma and perceived weight discrimination) (Hunger and Major Citation2015; Robinson et al. Citation2017; Stevens et al. Citation2017) and through overproduction of cytokines and leptin by white adipose tissue (Milaneschi et al. Citation2019). Peripheral cytokines are able to exert an effect in the central nervous system by passing the blood–brain barrier or stimulating the afferent vagus nerve (Capuron and Miller Citation2011). Central inflammation may impair leptin signalling resulting in leptin resistance, which, in turn, has been associated with depression (Osborn and Olefsky Citation2012; Milaneschi, Lamers, Bot, et al. Citation2017). Mendelian Randomisation studies of depression with atypical-like and somatic symptoms may provide insights into possible causal relationships with adiposity-related traits.
Several strengths and limitations should be noted. The first strength is the dataset analysed in this study; It contains a wide variety of immunometabolic variables. The second strength is the detailed measurement of the family history of the disorder. Thirdly, this study only included full-siblings as family members in the design, which has the advantage that they share more (early) environmental factors with each other compared to parent-offspring relationships. A limitation is that genetic and environmental effects cannot be disentangled. Another limitation is that the proband group exclusively consists of lifetime-affected cases and does not include unaffected individuals. This might have been even more informative about whether there is clustering of immunometabolic traits and depressive symptom profiles between siblings, and about possible causal relationships between these traits.
To conclude, we found associations between each depressive symptom profile and each immunometabolic characteristic of probands and the same trait in their sibling, confirming that each trait has a familial component. We found associations between adiposity-related traits and somatic/atypical-like symptom profiles which is consistent within probands and within their siblings. We did not find associations between these traits in probands and their siblings, suggesting that the relationship between adiposity-related traits and somatic/atypical-like symptoms are not due to common familial factors. Future research on the aetiological mechanisms underlying the relationship could provide further insights.
Supplementary Tables 1-5
Download MS Word (22 KB)Supplementary Figure 1
Download JPEG Image (48.5 KB)
Acknowledgements
The infrastructure for the NESDA study (www.nesda.nl) is funded through the Geestkracht programme of the Netherlands Organisation for Health Research and Development (ZonMw, grant number 10-000-1002) and financial contributions by participating universities and mental health care organisations (VU University Medical Centre, GGZ inGeest, Leiden University Medical Centre, Leiden University, GGZ Rivierduinen, University Medical Centre Groningen, University of Groningen, Lentis, GGZ Friesland, GGZ Drenthe, Rob Giel Onderzoekscentrum).
Statement of interest
None to declare.
References
- Al-Daghri NM, Al-Attas OS, Alokail MS, Alkharfy KM, Yakout SM, Sabico SB, Gibson GC, Chrousos GP, Kumar S. 2011. Parent-offspring transmission of adipocytokine levels and their associations with metabolic traits. PLoS One. 6(4):e18182.
- American Psychiatric Association. 2013. Diagnostic and statistical manual of mental disorders (DSM-5®). Washington (DC): American Psychiatric Pub.
- Benjamini Y, Hochberg Y. 1995. Controlling the false discovery rate: a practical and powerful approach to multiple testing. J R Stat Soc Series B Stat Methodol. 57(1):289–300.
- Bhat SK, Beilin LJ, Robinson M, Burrows S, Mori TA. 2017. Relationships between depression and anxiety symptoms scores and blood pressure in young adults. J Hypertens. 35(10):1983–1991.
- Borecki IB, Higgins M, Schreiner PJ, Arnett DK, Mayer-Davis E, Hunt SC, Province MA. 1998. Evidence for multiple determinants of the body mass index: the National Heart, Lung, and Blood Institute Family Heart Study. Obes Res. 6(2):107–114.
- Capuron L, Miller AH. 2011. Immune system to brain signaling: neuropsychopharmacological implications. Pharmacol Ther. 130(2):226–238.
- Chien KL, Hsu HC, Chen WJ, Chen MF, Su TC, Lee YT. 2007. Familial aggregation of metabolic syndrome among the Chinese: report from the Chin-Shan community family study. Diabetes Res Clin Pract. 76(3):418–424.
- Chiu YH, Lin WY, Wang PE, Chen YD, Wang TT, Warwick J, Chen TH. 2007. Population-based family case-control proband study on familial aggregation of metabolic syndrome: finding from Taiwanese people involved in Keelung community-based integrated screening (KCIS no. 5). Diabetes Res Clin Pract. 75(3):348–356.
- Cobb LK, Godino JG, Selvin E, Kucharska-Newton A, Coresh J, Koton S. 2016. Spousal influence on physical activity in middle-aged and older adults: the ARIC Study. Am J Epidemiol. 183(5):444–451.
- de Wit LM, van Straten A, van Herten M, Penninx BW, Cuijpers P. 2009. Depression and body mass index, a u-shaped association. BMC Public Health. 9(1):14.
- Difrancesco S, Lamers F, Riese H, Merikangas KR, Beekman ATF, van Hemert AM, Schoevers RA, Penninx B. 2019. Sleep, circadian rhythm, and physical activity patterns in depressive and anxiety disorders: a 2-week ambulatory assessment study. Depress Anxiety. 36(10):975–986.
- Dong F, Howard AG, Herring AH, Adair LS, Thompson AL, Popkin BM, Aiello AE, Zhang B, Gordon-Larsen P. 2017. Concordance of haemoglobin A1c, blood pressure and C-reactive protein between children and their parents in Chinese households. Pediatr Obes. 12(5):422–430.
- Dowlati Y, Herrmann N, Swardfager W, Liu H, Sham L, Reim EK, Lanctot KL. 2010. A meta-analysis of cytokines in major depression. Biol Psychiatry. 67(5):446–457.
- Eley TC, Liang H, Plomin R, Sham P, Sterne A, Williamson R, Purcell S. 2004. Parental familial vulnerability, family environment, and their interactions as predictors of depressive symptoms in adolescents. J Am Acad Child Adolesc Psychiatry. 43(3):298–306.
- Feng Y, Zang T, Xu X, Xu X. 2008. Familial aggregation of metabolic syndrome and its components in a large Chinese population. Obesity (Silver Spring). 16(1):125–129.
- Fyer AJ, Weissman MM. 1999. Genetic linkage study of panic: clinical methodology and description of pedigrees. Am J Med Genet. 88(2):173–181.
- Gibson-Smith D, Bot M, Brouwer IA, Visser M, Penninx B. 2018. Diet quality in persons with and without depressive and anxiety disorders. J Psychiatr Res. 106:1–7.
- Glaus J, Cui L, Hommer R, Merikangas KR. 2019. Association between mood disorders and BMI/overweight using a family study approach. J Affect Disord. 248:131–138.
- Glaus J, Vandeleur CL, von Känel R, Lasserre AM, Strippoli M-PF, Gholam-Rezaee M, Castelao E, Marques-Vidal P, Bovet P, Merikangas K, et al. 2014. Associations between mood, anxiety or substance use disorders and inflammatory markers after adjustment for multiple covariates in a population-based study. J Psychiatr Res. 58:36–45.
- Grundy SM, Cleeman JI, Daniels SR, Donato KA, Eckel RH, Franklin BA, Gordon DJ, Krauss RM, Savage PJ, Smith SC, Jr., et al. 2005. Diagnosis and management of the metabolic syndrome: an American Heart Association/National Heart, Lung, and Blood Institute Scientific Statement. Circulation. 112(17):2735–2752.
- Gustavo Ruas L, Diniz BS, Firmo JO, Peixoto SV, Mambrini JV, Loyola-Filho AI, Lima-Costa MF, Castro-Costa E. 2016. Components of the metabolic syndrome and depressive symptoms in community-dwelling older people: the Bambui Cohort Aging Study. Rev Bras Psiquiatr. 38(3):183–189.
- Haapakoski R, Mathieu J, Ebmeier KP, Alenius H, Kivimaki M. 2015. Cumulative meta-analysis of interleukins 6 and 1beta, tumour necrosis factor alpha and C-reactive protein in patients with major depressive disorder. Brain Behav Immun. 49:206–215.
- Haddy N, Sass C, Maumus S, Marie B, Droesch S, Siest G, Lambert D, Visvikis S. 2005. Biological variations, genetic polymorphisms and familial resemblance of TNF-alpha and IL-6 concentrations: STANISLAS cohort. Eur J Hum Genet. 13(1):109–117.
- Havinga PJ, Boschloo L, Bloemen AJ, Nauta MH, de Vries SO, Penninx BW, Schoevers RA, Hartman CA. 2017. Doomed for disorder? High incidence of mood and anxiety disorders in offspring of depressed and anxious patients: a prospective cohort study. J Clin Psychiatry. 78(1):e8–e17.
- Hemani G, Bowden J, Davey Smith G. 2018. Evaluating the potential role of pleiotropy in Mendelian randomization studies. Hum Mol Genet. 27(R2):R195–R208.
- Herva A, Räsänen P, Miettunen J, Timonen M, Läksy K, Veijola J, Laitinen J, Ruokonen A, Joukamaa M. 2006. Co-occurrence of metabolic syndrome with depression and anxiety in young adults: the Northern Finland 1966 Birth Cohort Study. Psychosom Med. 68(2):213–216.
- Hickman RJ, Khambaty T, Stewart JC. 2014. C-reactive protein is elevated in atypical but not nonatypical depression: data from the National Health and Nutrition Examination survey (NHANES) 1999-2004. J Behav Med. 37(4):621–629.
- Hildrum B, Mykletun A, Midthjell K, Ismail K, Dahl AA. 2009. No association of depression and anxiety with the metabolic syndrome: the Norwegian HUNT study. Acta Psychiatr Scand. 120(1):14–22.
- Homish GG, Leonard KE. 2005. Spousal influence on smoking behaviors in a US community sample of newly married couples. Soc Sci Med. 61(12):2557–2567.
- Howard DM, Adams MJ, Clarke T-K, Hafferty JD, Gibson J, Shirali M, Coleman JRI, Hagenaars SP, Ward J, Wigmore EM, et al. 2019. Genome-wide meta-analysis of depression identifies 102 independent variants and highlights the importance of the prefrontal brain regions. Nat Neurosci. 22(3):343–352.
- Hunger JM, Major B. 2015. Weight stigma mediates the association between BMI and self-reported health. Health Psychol. 34(2):172–175.
- Johnson PCD, Logue J, McConnachie A, Abu-Rmeileh NME, Hart C, Upton MN, Lean M, Sattar N, Watt G. 2012. Intergenerational change and familial aggregation of body mass index. Eur J Epidemiol. 27(1):53–61.
- Kahl KG, Greggersen W, Schweiger U, Cordes J, Balijepalli C, Losch C, Moebus S. 2012. Prevalence of the metabolic syndrome in unipolar major depression. Eur Arch Psychiatry Clin Neurosci. 262(4):313–320.
- Khan RJ, Gebreab SY, Riestra P, Xu R, Davis SK. 2014. Parent-offspring association of metabolic syndrome in the Framingham Heart Study. Diabetol Metab Syndr. 6(1):140–149.
- Kinder LS, Carnethon MR, Palaniappan LP, King AC, Fortmann SP. 2004. Depression and the metabolic syndrome in young adults: findings from the Third National Health and Nutrition Examination Survey. Psychosom Med. 66(3):316–322.
- Kohler CA, Freitas TH, Maes M, de Andrade NQ, Liu CS, Fernandes BS, Stubbs B, Solmi M, Veronese N, Herrmann N, et al. 2017. Peripheral cytokine and chemokine alterations in depression: a meta-analysis of 82 studies. Acta Psychiatr Scand. 135(5):373–387.
- Lamers F, Bot M, Jansen R, Chan MK, Cooper JD, Bahn S, Penninx BW. 2016. Serum proteomic profiles of depressive subtypes. Transl Psychiatry. 6(7):e851.
- Lamers F, Cui L, Hickie IB, Roca C, Machado-Vieira R, Zarate CA, Jr., Merikangas KR. 2016. Familial aggregation and heritability of the melancholic and atypical subtypes of depression. J Affect Disord. 204:241–246.
- Lamers F, Milaneschi Y, de Jonge P, Giltay EJ, Penninx B. 2018. Metabolic and inflammatory markers: associations with individual depressive symptoms. Psychol Med. 48(7):1102–1110.
- Lamers F, Vogelzangs N, Merikangas KR, de Jonge P, Beekman AT, Penninx BW. 2013. Evidence for a differential role of HPA-axis function, inflammation and metabolic syndrome in melancholic versus atypical depression. Mol Psychiatry. 18(6):692–699.
- Lasserre AM, Glaus J, Vandeleur CL, Marques-Vidal P, Vaucher J, Bastardot F, Waeber G, Vollenweider P, Preisig M. 2014. Depression with atypical features and increase in obesity, body mass index, waist circumference, and fat mass: a prospective, population-based study. JAMA Psychiatry. 71(8):880–888.
- Lawrence PJ, Murayama K, Creswell C. 2019. Systematic review and meta-analysis: anxiety and depressive disorders in offspring of parents with anxiety disorders. J Am Acad Child Adolesc Psychiatry. 58(1):46–60.
- Low NC, Cui L, Merikangas KR. 2008. Specificity of familial transmission of anxiety and comorbid disorders. J Psychiatr Res. 42(7):596–604.
- Mamun AA, Lawlor DA, O’Callaghan MJ, Williams GM, Najman JM. 2005. Family and early life factors associated with changes in overweight status between ages 5 and 14 years: findings from the Mater University Study of Pregnancy and its outcomes. Int J Obes. 29(5):475–482.
- Marazziti D, Rutigliano G, Baroni S, Landi P, Dell’Osso L. 2014. Metabolic syndrome and major depression. CNS Spectr. 19(4):293–304.
- Marmorstein NR, Iacono WG. 2016. Associations between depression and obesity in parents and their late-adolescent offspring: a community-based study. Psychosom Med. 78(7):861–866.
- Meng L, Chen D, Yang Y, Zheng Y, Hui R. 2012. Depression increases the risk of hypertension incidence: a meta-analysis of prospective cohort studies. J Hypertens. 30(5):842–851.
- Merikangas KR, Cui L, Heaton L, Nakamura E, Roca C, Ding J, Qin H, Guo W, Yao-Shugart Y, Zarate C, et al. 2014. Independence of familial transmission of mania and depression: results of the NIMH family study of affective spectrum disorders. Mol Psychiatry. 19(2):214–219.
- Milaneschi Y, Lamers F, Bot M, Drent ML, Penninx BW. 2017. Leptin dysregulation is specifically associated with major depression with atypical features: evidence for a mechanism connecting obesity and depression. Biol Psychiatry. 81(9):807–814.
- Milaneschi Y, Lamers F, Peyrot WJ, Baune BT, Breen G, Dehghan A, Forstner AJ, Grabe HJ, Homuth G, Kan C, et al. 2017. Genetic association of major depression with atypical features and obesity-related immunometabolic dysregulations. JAMA Psychiatry. 74(12):1214–1225.
- Milaneschi Y, Simmons WK, van Rossum EFC, Penninx BW. 2019. Depression and obesity: evidence of shared biological mechanisms. Mol Psychiatry. 24(1):18–33.
- Milne BJ, Caspi A, Harrington H, Poulton R, Rutter M, Moffitt TE. 2009. Predictive value of family history on severity of illness: the case for depression, anxiety, alcohol dependence, and drug dependence. Arch Gen Psychiatry. 66(7):738–747.
- Moreira FP, Jansen K, Mondin TC, Cardoso TA, Magalhães PVS, Kapczinski F, Frey BN, Oses JP, Souza LDM, da Silva RA, et al. 2016. Biological rhythms, metabolic syndrome and current depressive episode in a community sample. Psychoneuroendocrinology. 72:34–39.
- Muhtz C, Zyriax BC, Klahn T, Windler E, Otte C. 2009. Depressive symptoms and metabolic risk: effects of cortisol and gender. Psychoneuroendocrinology. 34(7):1004–1011.
- Murrin CM, Kelly GE, Tremblay RE, Kelleher CC. 2012. Body mass index and height over three generations: evidence from the Lifeways cross-generational cohort study. BMC Public Health. 12:81.
- Navarro-Allende A, Khataan N, El-Sohemy A. 2008. Impact of genetic and environmental determinants of taste with food preferences in older adults. J Nutr Elder. 27(3–4):267–276.
- Nehring SM, Patel BC. 2019. C-reactive protein (CRP). Treasure Island (FL): StatPearls.
- Osborn O, Olefsky JM. 2012. The cellular and signaling networks linking the immune system and metabolism in disease. Nat Med. 18(3):363–374.
- Pan A, Keum N, Okereke OI, Sun Q, Kivimaki M, Rubin RR, Hu FB. 2012. Bidirectional association between depression and metabolic syndrome: a systematic review and meta-analysis of epidemiological studies. Diabetes Care. 35(5):1171–1180.
- Park HS, Park JY, Cho SI. 2006. Familial aggregation of the metabolic syndrome in Korean families with adolescents. Atherosclerosis. 186(1):215–221.
- Penninx B, Beekman AT, Smit JH, Zitman FG, Nolen WA, Spinhoven P, Cuijpers P, De Jong PJ, Van Marwijk HW, Assendelft WJ, et al. 2008. The Netherlands Study of Depression and Anxiety (NESDA): rationale, objectives and methods. Int J Methods Psychiatr Res. 17(3):121–140.
- Piirtola M, Kaprio J, Ropponen A. 2014. A study of sedentary behaviour in the older Finnish twin cohort: a cross sectional analysis. Biomed Res Int. 2014:209140.
- R Core Team. 2019. R: a language and environment for statistical computing. Vienna (Austria): R Foundation for Statistical Computing.
- Richardson LP, Davis R, Poulton R, McCauley E, Moffitt TE, Caspi A, Connell F. 2003. A longitudinal evaluation of adolescent depression and adult obesity. Arch Pediatr Adolesc Med. 157(8):739–745.
- Robinson E, Sutin A, Daly M. 2017. Perceived weight discrimination mediates the prospective relation between obesity and depressive symptoms in U.S. and U.K. adults. Health Psychol. 36(2):112–121.
- Rush A, Gullion C, Basco M, Jarrett R, Trivedi M. 1996. The Inventory of Depressive Symptomatology (IDS): psychometric properties. Psychol Med. 26(3):477–486.
- Santos DM, Katzmarzyk PT, Tregouet DA, Gomes TN, Santos FK, Maia JA. 2013. Familial aggregation of metabolic syndrome indicators in Portuguese families. Biomed Res Int. 2013:314823.
- Schaakxs R, Comijs HC, Lamers F, Beekman AT, Penninx BW. 2017. Age-related variability in the presentation of symptoms of major depressive disorder. Psychol Med. 47(3):543–552.
- Simmons WK, Burrows K, Avery JA, Kerr KL, Taylor A, Bodurka J, Potter W, Teague TK, Drevets WC. 2018. Appetite changes reveal depression subgroups with distinct endocrine, metabolic, and immune states. Mol Psychiatry. DOI:10.1038/s41380-018-0093-6.
- Smith AD, Fildes A, Cooke L, Herle M, Shakeshaft N, Plomin R, Llewellyn C. 2016. Genetic and environmental influences on food preferences in adolescence. Am J Clin Nutr. 104(2):446–453.
- Speed MS, Jefsen OH, Borglum AD, Speed D, Ostergaard SD. 2019. Investigating the association between body fat and depression via Mendelian randomization. Transl Psychiatry. 9(1):184.
- Stevens SD, Herbozo S, Morrell HE, Schaefer LM, Thompson JK. 2017. Adult and childhood weight influence body image and depression through weight stigmatization. J Health Psychol. 22(8):1084–1093.
- Stirnadel H, Lin X, Ling H, Song K, Barter P, Kesaniemi YA, Mahley R, McPherson R, Waeber G, Bersot T, et al. 2008. Genetic and phenotypic architecture of metabolic syndrome-associated components in dyslipidemic and normolipidemic subjects: the GEMS Study. Atherosclerosis. 197(2):868–876.
- Takeuchi T, Nakao M, Kachi Y, Yano E. 2013. Association of metabolic syndrome with atypical features of depression in Japanese people. Psychiatry Clin Neurosci. 67(7):532–539.
- Telman LGE, van Steensel FJA, Maric M, Bogels SM. 2018. What are the odds of anxiety disorders running in families? A family study of anxiety disorders in mothers, fathers, and siblings of children with anxiety disorders. Eur Child Adolesc Psychiatry. 27(5):615–624.
- van den Broek N, Treur JL, Larsen JK, Verhagen M, Verweij KJH, Vink JM. 2018. Causal associations between body mass index and mental health: a Mendelian randomisation study. J Epidemiol Community Health. 72(8):708–710.
- van Reedt Dortland AK, Giltay EJ, van Veen T, van Pelt J, Zitman FG, Penninx B. 2010. Associations between serum lipids and major depressive disorder: results from the Netherlands Study of Depression and Anxiety (NESDA). J Clin Psychiatry. 71(06):729–736.
- van Reedt Dortland AK, Giltay EJ, van Veen T, Zitman FG, Penninx BW. 2009. Metabolic syndrome abnormalities are associated with severity of anxiety and depression and with tricyclic antidepressant use. Acta Psychiatr Scand. 122(1):30–39.
- Vancampfort D, Correll CU, Wampers M, Sienaert P, Mitchell AJ, De Herdt A, Probst M, Scheewe TW, De Hert M. 2014. Metabolic syndrome and metabolic abnormalities in patients with major depressive disorder: a meta-analysis of prevalences and moderating variables. Psychol Med. 44(10):2017–2028.
- Weinberger AH, Kashan RS, Shpigel DM, Esan H, Taha F, Lee CJ, Funk AP, Goodwin RD. 2017. Depression and cigarette smoking behavior: a critical review of population-based studies. Am J Drug Alcohol Abuse. 43(4):416–431.
- WHO Collaborating Centre for Drug Statistics Methodology. 2007. Guidelines for ATC classification and DDD assignment 2008. Oslo, Norway.
- Wiltink J, Michal M, Junger C, Munzel T, Wild PS, Lackner KJ, Blettner M, Pfeiffer N, Brahler E, Beutel ME. 2018. Associations between degree and sub-dimensions of depression and metabolic syndrome (MetS) in the community: results from the Gutenberg Health Study (GHS). BMC Psychiatry. 18(1):114.
- World Health Organization. 1997. Composite International Diagnostic Interview, Core Version 2.1: interviewer’s manual. Sydney (Australia): WHO.
- Wray NR, Ripke S, Mattheisen M, Trzaskowski M, Byrne EM, Abdellaoui A, Adams MJ, Agerbo E, Air TM, Andlauer TMF, et al. 2018. Genome-wide association analyses identify 44 risk variants and refine the genetic architecture of major depression. Nat Genet. 50(5):668–681.