
Abstract
Objectives
It is important to find biomarkers associated with transition to illness in individuals at clinical high-risk for psychosis (CHR). Here, we use free-water imaging, an advanced diffusion MRI technique, to identify white matter alterations in the brains of CHR subjects who subsequently develop psychosis (CHR-P) compared to those who do not (CHR-NP).
Methods
Twenty-four healthy controls (HC) and 30 CHR individuals, 8 of whom converted to schizophrenia after a mean follow-up of 15.16 months, received baseline MRI scans. Maps of fractional anisotropy (FA), FA of cellular tissue (FAT), and extracellular free-water (FW) were extracted using tract-based spatial statistics after which voxel-wise non-parametric group statistics and correlations with symptom severity were performed.
Results
There were no significant differences between HCs and the combined CHR group. However, prior to conversion, CHR-P showed widespread lower FA compared to CHR-NP (pFWE < 0.05). FA changes in CHR-P were associated with significantly lower FAT and higher FW, compared to CHR-NP. Positive symptoms correlated significantly with diffusion parameters in similar regions as those discriminating CHR-P from CHR-NP.
Conclusions
Our study suggests that cellular (FAT) and extracellular (FW) white matter alterations are associated with positive symptom severity and indicate an elevated illness risk among CHR individuals.
Introduction
Patients with schizophrenia and related psychoses suffer from a range of symptoms including hallucinations, delusions, lack of motivation, and cognitive decline (American Psychiatric Association Citation2013). Early diagnosis and intervention, optimally prior to the onset of psychosis, has the potential to diminish the number of subjects that develop symptoms (Schmidt et al. Citation2015; Schultze-Lutter et al. Citation2015). Early identification of at-risk individuals would also be helpful in characterising pathologies that are more closely tied with the aetiology of the disorder, rather than with chronicity effects (Wood et al. Citation2011; Takahashi and Suzuki Citation2018). In the early 2000s, clinical high-risk for psychosis (CHR) criteria (Miller et al. Citation2003; Yung et al. Citation2005) were established to address the importance of delineating possible clinical and biological features that are related to an increased risk for developing psychosis (Fusar-Poli et al. Citation2013). These criteria have been used in many research studies and, more importantly, have been translated into early intervention strategies aimed at preventing psychosis-onset (Schmidt et al. Citation2015). At the same time, recent analyses suggest that transition rates in CHR individuals are ∼30% or even lower (Fusar-Poli et al. Citation2012; Hartmann et al. Citation2016), which further highlights the need for identifying additional conversion markers (Fusar-Poli et al. Citation2015; Cannon Citation2016; Abu-Akel et al. Citation2018).
Recently, neurodevelopmental alterations of brain white matter have been implicated in the pathophysiology of psychotic disorders (Kochunov and Hong Citation2014). Diffusion magnetic resonance imaging (MRI) has been employed to investigate neurobiological markers associated with white matter alterations, and may therefore significantly improve prediction of transition outcomes in CHR cohorts (Pettersson-Yeo et al. Citation2013; Vijayakumar et al. Citation2016). Specifically, diffusion tensor imaging (DTI) studies have repeatedly shown reductions in white matter fractional anisotropy (FA), a putative measure of microstructural organisation, across different stages of the disorder including at-risk cohorts (Arat et al. Citation2015; Vijayakumar et al. Citation2016; Kelly et al. Citation2018). Support for the presence of abnormal white matter also comes from histopathological and genetic studies which implicate myelin dysfunction in the pathophysiology of psychosis (Tkachev et al. Citation2003; Takahashi et al. Citation2011; Vikhreva et al. Citation2016). In addition, recent studies show increased evidence for abnormal immune activation as a possible mediator of white matter pathology (Najjar and Pearlman Citation2015). Reports describing elevated pro-inflammatory cytokines and activated microglia in first-episode psychosis and CHR cohorts further corroborate evidence that immune dysfunction may play a role in the manifestations of psychotic illnesses (Miller et al. Citation2011; Coughlin et al. Citation2016; Khoury and Nasrallah Citation2018). However, traditional DTI metrics are limited in their ability to segregate between evidence of cellular damage to white matter, more likely associated with neurodegenerative or neurodevelopmental changes, and extracellular pathologies that have been proposed to reflect immune dysfunction/activation (Pasternak et al. Citation2016; Pasternak et al. Citation2018; Di Biase et al. Citation2020).
The diffusion MRI-based free-water imaging technique addresses these limitations by decomposing the diffusion signal into two compartments (Pasternak et al. Citation2009). The first compartment models the fractional volume of isotropic, unrestricted diffusion in the extracellular space (free-water, FW) which can be responsive to pathologies such as edoema and atrophy (Pasternak et al. Citation2012; Lyall et al. Citation2018). The second compartment models hindered/restricted diffusion in close proximity to cellular membranes, from which FA of the tissue (FAT) is derived, reflecting more closely changes in myelination and axonal membrane health than the conventional DTI metric FA (Pasternak et al. Citation2009). By differentiating these compartments this model has proven to be successful in providing new insights to potential biological mechanisms underlying the observed FA reductions in schizophrenia (Pasternak et al. Citation2012, Citation2015; Lyall et al. Citation2018).
Specifically, free-water imaging studies in subjects following their first psychotic episode have shown widespread elevations in FW following the onset of psychosis, accompanied with more focal FAT changes (Pasternak et al. Citation2012; Lyall et al. Citation2018). Moreover, two previous free-water imaging studies in independent CHR samples (Wang et al. Citation2016; Tang et al. Citation2019) reported reduced FAT in CHR subjects, but did not identify increased FW (Tang et al. Citation2019). These studies suggest that structural abnormalities observed in interhemispheric and association fibres may already be present in the CHR stage and may reflect a neurodevelopmental predisposition to display prodromal symptoms (Tang et al. Citation2019). However, these studies have yielded inconclusive results regarding the issue of whether these brain abnormalities are indicative of transition to psychosis, necessitating additional investigation.
In the current study we apply free-water imaging to compare CHR individuals who subsequently developed psychosis (CHR-P) with those who did not (CHR-NP). We hypothesise that CHR-P subjects will show white matter aberrations that are more similar to those previously described in patients with first-episode psychosis (i.e. widespread FW increases and less extensive FAT reductions) relative to CHR-NP individuals (Pasternak et al. Citation2012; Lyall et al. Citation2018). Furthermore, to characterise better the clinical consequences of white matter abnormalities, we investigated whether diffusion MRI (dMRI) measures are correlated with symptom severity, as rated with the Positive and Negative Syndrome Scale (PANSS) (Kay et al. Citation1987).
Materials and methods
Participants
CHR individuals, aged 15 to 65 years, were screened for eligibility for participation by clinicians in the Early Recognition Department for Outpatients of the Department of Psychiatry of the University Medical Centre Hamburg-Eppendorf. Healthy controls (HC) who were age-, sex-, and education-matched to the CHR sample were recruited from the same geographic area. This cohort was part of a larger research initiative (Collaborative Research Centre 936) from which other data have previously been reported (Leicht et al. Citation2016).
CHR was defined based on the criteria of the Early Detection and Intervention Programme of the German Research Network on Schizophrenia (Wölwer et al. Citation2006), i.e. as the presence of either: a) basic symptoms: presence of at least two subjective cognitive or perceptual disturbances with a score of ≥ 3 on the Schizophrenia Proneness Instrument (Schultze-Lutter et al. Citation2007), or b) a schizotypal personality disorder/family history of psychotic disorder plus a decline of ≥ 30% in the Global Assessment of Functioning Scale (GAF) score (American Psychiatric Association Citation2009), or c) attenuated psychotic symptoms or a brief limited intermittent psychotic syndrome as assessed with the Structured Interview for Prodromal Syndromes and the Scale of Prodromal Symptoms (SOPS) (Miller et al. Citation2003) (for details see Supplementary Material and Methods).
The presence of major neurological or somatic illnesses, as well as current substance abuse, disqualified subjects from study participation. HCs were excluded if they were previously diagnosed with, or treated for, any neurological or psychiatric disorder (including substance use disorders) or had a family history of psychotic disorders.
Ethics statement
The study was approved by the Ethics Committee of the Medical Association of Hamburg. After explaining the objectives and the methods of the study, written informed consent was obtained from each participant, or, in the case of a minor, from the legal guardian.
Neuropsychiatric assessment
CHR participants underwent a neuropsychiatric assessment within two weeks of the MRI scan and conversion to psychosis was evaluated after a follow-up period of 12 months. Re-assessments after more than 12 months were allowed in order to minimise the number of CHR individuals lost to follow-up. Nevertheless, 6 CHR individuals could not be followed-up (attrition rate: 20%, see Table S1).
Table 1. Demographic and clinical characteristics of the sample.
Psychiatric comorbidities in the CHR population were recorded after the administration of the Mini Neuropsychiatric Interview (Sheehan et al. Citation1998) and a comprehensive review of each individual’s psychiatric medical history. Symptom severity was assessed at baseline utilising both the PANSS and the SOPS (Kay et al. Citation1987; Miller et al. Citation2003).
Conversion to psychosis was defined as reaching a score of 6 on any of the positive symptom domains of the SOPS. The Structured Clinical Interview for DSM-IV Axis I Disorders (SCID-I) was subsequently used to specify the type of psychosis.
Final dataset
In the present study, we included 30 CHR subjects and 27 HCs based on the availability of baseline diffusion weighted MRIs (dMRI). Twenty-four (24) HCs remained in the study, after 3 HCs were excluded following visual inspection of all MRI scans (severe signal dropouts, n = 2; hydrocephalus, n = 1). Clinical follow-up information was available for 24 of the 30 CHR individuals.
Image acquisition
All dMRI scans were acquired on a 3 T MRI scanner (Siemens Magnetom Trio, Siemens Erlangen) at the University Medical Centre Hamburg-Eppendorf using a 12-channel head coil. Throughout the study, the same scanner and software was used. A spin-echo single-shot echo-planar imaging sequence (EPI) was implemented with the following parameters: repetition time (TR) = 7.7 s, echo time (TE) = 85 ms, flip angle = 90°, 64 interleaved axial slices, slice thickness = 2 mm, field of view (FOV) = 216 × 256 mm2, matrix = 108 × 128, 30 non-collinear gradient directions with b = 1000s/mm2 collected twice within the same acquisition and 10 images with b = 0 s/mm2. The acquisition time was 9 min and 22 s, using 6/8 phase partial Fourier, as well as generalised autocalibrating partial parallel acquisition (GRAPPA) with an acceleration factor of 2. In addition, a T1-weighted magnetisation prepared rapid gradient echo (MPRAGE) data set was obtained to rule out neurological/structural abnormalities.
Image processing
Quality control consisted of visually inspecting the dMRIs (3 D Slicer v4.5, www.slicer.org, (Fedorov et al. Citation2012)) and semi-automatically removing gradient direction affected by severe artefacts or signal dropouts with an in-house tool. The groups did not differ in the number of removed gradients (maximum = 8, p = 0.882). Further, all scans were corrected for motion and eddy currents by affine registration of all volumes to the first b = 0 volume using FLIRT (https://fsl.fmrib.ox.ac.uk/fsl/fslwiki/FLIRT, (Jenkinson et al. Citation2002)). The gradient vector table was updated accordingly and a relative motion parameter was obtained for each scan from the transforms (Ling et al. Citation2012). There was no significant difference between groups for relative motion during the scanning session (p = 0.236). Finally, brain masks for skull-stripping were automatically generated within 3 D Slicer and then manually edited to ensure anatomical accuracy.
Diffusion tensor and FW estimation
For comparison purposes with previous studies, we chose to include the traditional FA metric in all analyses alongside our primary outcome measures FAT and FW. Diffusion tensors were estimated for each voxel from the preprocessed images using a least-squares fit. Next, scalar maps for FA were derived from the tensors. In addition, the free-water model was fitted to the diffusion images (Pasternak et al. Citation2009). The fit was performed using a regularised non-linear fit, resulting in FW maps, and FW-corrected diffusion tensors, from which FAT was calculated. Of note, biophysical components other than free-water may confound diffusivity in white matter and might not be resolved by the free-water model. Moreover, it is possible that an inaccurate model fit, as well as image artefacts may bias the estimation of the volume of the free-water compartment. Nevertheless, FAT and FW will be interpreted as surrogate markers for the tissue and extracellular compartment, respectively (Pasternak et al. Citation2012, Citation2015; Lyall et al. Citation2018).
Tract-based spatial-statistics
We adapted the standard tract-based spatial-statistics (TBSS) pipeline (Smith et al. Citation2006) in terms of the registration procedure. For this purpose a study-specific template, created with antsMultivariateTemplateCreation2.sh (www.github.com/ANTsX/ANTs, (Avants et al. Citation2011; Keihaninejad et al. Citation2012)), was used as the registration target. After averaging all registered FA images, a white matter skeleton of the mean FA image was created and thresholded at FA > 0.25. All FA, FAT and FW maps were then skeletonised according to the TBSS pipeline.
Statistical image analysis
Non-parametric, voxel-wise group comparisons and correlation analyses were performed on the entire skeleton in Randomise (Winkler et al. Citation2014) using threshold-free cluster-enhancement (Smith and Nichols Citation2009). For each contrast described below, 5000 permutations were carried out to obtain family-wise error-corrected (FWE) statistical maps with the significance level set to p < 0.05. Age, sex, and motion were included as covariates in all voxel-wise analyses.
Using FSL Randomise, we performed two-sided T-tests comparing the HC (n = 24) and CHR (n = 30) groups at baseline regarding FA, FAT and FW. Furthermore, we conducted two-sided T-tests comparing HCs (n = 24), CHR-NP (n = 16) and CHR-P subjects (n = 8) with one another.
Moreover, voxel-wise, non-parametric permutation-based correlations were conducted in the CHR group (n = 28) to investigate associations between symptom severity as rated with the PANSS subscales (positive, negative and global) and dMRI measures.
Once significant clusters were identified, the dMRI measures were averaged within the clusters for which Cohen’s d was calculated for cross-sectional group differences and Pearson’s r was calculated for correlations with symptoms. Post-hoc Spearman’s ρ correlations were conducted in CHR-P and CHR-NP separately when associations with symptoms in the combined CHR group were significant. Further, we chose to use the percentage of the white matter skeleton affected as a proxy for a “spatial effect size” as previously conducted by our group (Tang et al. Citation2019). Lastly, anatomical locations of significant clusters are reported for our primary outcome measures FAT and FW utilising the JHU ICBM-DTI-81 atlas (Mori et al. Citation2005) if significant voxels attributable to the respective region represented ≥1 % of the total number of voxels in the cluster.
Clinical and demographic data analysis
Statistical analyses of the clinical and demographic data, as well as the correlation analyses, were conducted in R (version 3.5.2, https://www.R-project.org/). All tests were two-sided, and the level of significance was set to p < 0.05. Depending on the distributions, either Student’s T-tests/one-way analyses of variance or Mann-Whitney-U/Kruskal-Wallis tests were used to compare means between groups. For dichotomous variables we used Χ2-tests. Pearson’s r was used to test for medication effects by correlating chlorpromazine equivalents (CPZ equivalents in mg/day) with average FA, FAT, and FW of significant clusters in medicated subjects.
Results
Participants
Detailed information about clinical and demographic characteristics of HCs and CHR individuals that received a clinical follow-up to confirm diagnosis are presented in . There were no significant differences between HCs and CHR individuals with respect to age (range: 18–33 years, 17–30 years, respectively; p = 0.174) and sex (p = 0.773). However, we observed a close to significant difference in years of education (p = 0.056).
Conversion status
Eight out of 24 CHR individuals (33 %) converted to schizophrenia as diagnosed by the SCID-I (DSM-IV). The mean duration of the follow-up was 15.16 months (SD = 5.54). There were no significant differences in age, sex, or education between HCs, CHR-NP, and CHR-P individuals at baseline (). Finally, SOPS positive symptoms scores were significantly higher in CHR-P comparing to CHR-NP individuals prior to conversion (p = 0.047). However, other symptom scores (SOPS negative and disorganisation, as well as PANSS subscores) did not differ significantly between groups at baseline ().
Medication
At the time of the study, 8 CHR individuals (5 CHR-NP, 3 CHR-P) were medicated with one or two atypical antipsychotics. The relative number of subjects treated with antipsychotics (p = 0.760) and the total average treatment duration (p = 0.897), as well as CPZ equivalents (p = 0.879) did not differ significantly between CHR-NP and CHR-P subjects (). Furthermore, 2 CHR subjects (1 CHR-NP, 1 CHR-P) also received anti-depressants (for more details see Supplementary Material and Methods).
Comorbidities
The majority of CHR subjects in this study were previously diagnosed with a psychiatric comorbid disorder (n = 27/30). The most prominent diagnoses were mood disorders (n = 23), followed by anxiety and stress-related disorders (n = 8), personality disorders (n = 7), and substance use disorders (n = 7: 3 CHR-NP, 2 CHR-P, 2 CHR lost to follow-up; all subjects were currently abstinent).
Image analysis: cross-sectional group differences
There were no significant voxel-wise differences between HCs and the combined CHR group with respect to FA, FAT, or FW (pFWE > 0.1).
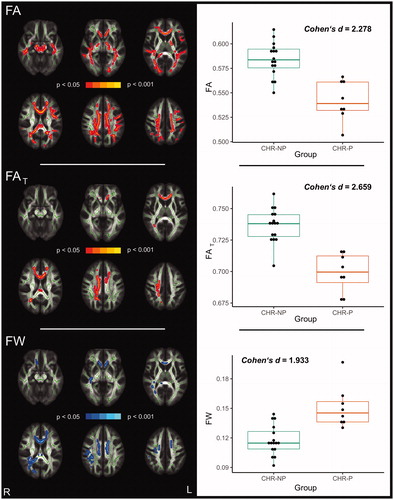
When the CHR group was divided according to conversion status, CHR-P subjects showed significantly lower FA (0.05 > pFWE ≥ 0.002) in 17.12 % of the white matter skeleton compared to CHR-NP subjects (, left side). For FA, the estimated effect size across significant voxels was Cohen’s d = 2.278 (, right side). When applying free-water imaging, CHR-P subjects showed significantly lower FAT (0.05 > pFWE ≥0.006) in 3.65 % of the skeleton, as well as higher FW (0.05 > pFWE ≥ 0.035) in 5.35 % of the white matter skeleton, in comparison to CHR-NP subjects (, left side). FAT reductions, with Cohen’s d = 2.659 across significant voxels (, right side), were primarily localised to the corpus callosum, the right corona radiata (anterior, posterior and superior), the left anterior corona radiata and the right posterior thalamic radiation. In contrast, FW elevations were more widespread and mainly found in the corpus callosum, right superior longitudinal fasciculus, right retrolenticular part of the internal capsule, right posterior thalamic radiation, right tapetum, and right (anterior, posterior and superior) and left corona radiata (anterior and superior) (, left side). Cohen’s d across the significant FW cluster was d = 1.933 (, right side).
Figure 1. White matter alterations in CHR-P compared to CHR-NP (pFWE < 0.05). Global FA reductions in CHR-P comparing to CHR-NP appear to be explained both by FAT reductions and FW increases in CHR-P as there is a considerable overlap between significant clusters (left panels). Diffusion measures averaged across corresponding significant clusters are presented as boxplots on the right.
Note: CHR: clinical high-risk for psychosis, CHR-P: CHR individuals who developed psychosis, CHR-NP: CHR individuals who did not develop psychosis, FA: fractional anisotropy, FAT: fractional anisotropy of the tissue, FW: free-water
Differences between HC and CHR-P subjects did not reach the significance threshold (FA: pFWE ≥ 0.065; FAT: pFWE ≥ 0.060; FW: pFWE ≥ 0.109), although these differences were in similar regions and in the same direction as differences between CHR-P and CHR-NP individuals (Figure S1). Comparing CHR-NP with HCs showed small areas with significantly higher FA and FAT in CHR-NP (FA: 0.5 > pFWE ≥ 0.045 in 0.16% of the white matter skeleton; FAT: 0.5 > pFWE ≥ 0.035 in 0.14% of the white matter skeleton; Figure S2), localised to the body of the corpus callosum, as well as the right posterior and superior corona radiata.
Figure 2. Correlations between positive symptoms and diffusion measures in CHR individuals (n = 28, pFWE < 0.05). FA and FAT (red) are inversely correlated, while FW (blue) is positively correlated with positive symptoms (left panels). Pearson’s correlations using diffusion measures averaged across corresponding significant clusters are shown on the right. Data points for CHR-P subjects are orange-coloured.
Note: CHR: clinical high-risk for psychosis, FA: fractional anisotropy, FAT: fractional anisotropy of the tissue, FW: free-water, PANSS: Positive and Negative Syndrome Scale
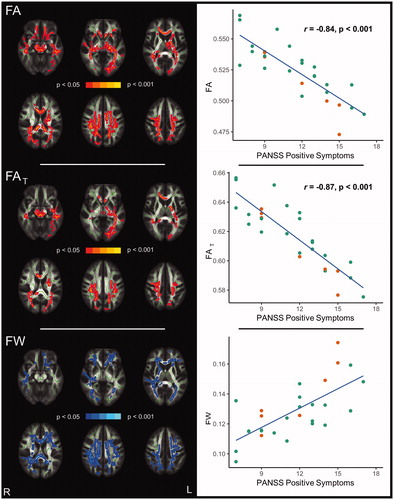
Image analysis: correlation of symptom scores and diffusion measures
Voxel-wise correlation analyses revealed significant and widespread associations between positive symptom severity (PANSS) and diffusion measures among the combined group of CHR individuals (, left side). Specifically, positive symptoms were inversely correlated with FA in 23.7 % of the white matter skeleton (0.05 > pFWE ≥ 0.005). The Pearson correlation coefficient across significant voxels was r = −0.84 (p < 0.001; , right side). Further, by testing for associations of positive symptoms with free-water imaging metrics, we find a significant inverse relationship with FAT in 11.4 % of the white matter skeleton (0.05 > pFWE ≥ 0.007), mainly localised to the corpus callosum, bilateral superior longitudinal fasciculus, left internal capsule, bilateral corona radiata, bilateral sagittal stratum, left posterior thalamic radiation, as well as left external capsule (, left side). For FAT, the Pearson correlation coefficient across significant voxels was r = −0.87 (p < 0.001; , right side).
FW was significantly positively correlated with positive symptoms in 18.5 % of the white matter skeleton in the combined CHR group (0.05 > pFWE ≥ 0.017) with a Pearson’s correlation coefficient of r = 0.70 (p < 0.001) across significant voxels (, right side). These associations were more extensive comparing to those with FAT and primarily found in the corpus callosum, bilateral corona radiata, bilateral superior longitudinal fasciculus, bilateral posterior thalamic radiation, right retrolenticular part of the internal capsule, and right sagittal stratum (, left side).
Post-hoc Spearman’s correlation analyses – performed within the CHR-NP and CHR-P groups separately – showed significant correlations between positive symptoms and dMRI measures in the same directions as analyses of the combined CHR group (see Table S2).
Neither negative symptom scores (FA: pFWE ≥0.164; FAT: pFWE ≥ 0.058; FW: pFWE ≥ 0.524) nor global symptom scores (FA: pFWE ≥ 0.211; FAT: pFWE ≥ 0.322; FW: pFWE ≥ 0.1378) were significantly correlated with FA, FAT or FW.
Medication effects
CPZ equivalent dosage did not correlate significantly with average diffusion measures of clusters distinguishing CHR-P and CHR-NP subjects (p > 0.6).
Discussion
In this study, we demonstrate that prior to illness-onset, clinical high-risk individuals who subsequently converted to psychosis exhibit significantly lower FA in commissural and association tracts when compared to those who did not convert. Moreover, when we apply free-water imaging, we show that FA reductions in those who convert to psychosis can be explained both by lower FAT, and also, to a greater spatial extent, by significant elevations in extracellular FW. In addition, we find that both FAT reductions and FW increases are associated with positive symptom severity in CHR individuals. Our study thus demonstrates that the development of, and transition to, psychosis may be characterised by two different biological mechanisms and that free-water imaging may be useful for stratifying risk for conversion to psychosis within a CHR population (Smieskova et al. Citation2010; Chung and Cannon Citation2015).
Our finding of lower FAT, taken together with the two previous publications that employed free-water imaging in a CHR population (Wang et al. Citation2016; Tang et al. Citation2019), suggests that FAT abnormalities are a consistent finding across CHR and CHR-P individuals. Similar to our finding, Wang et al. (Citation2016) also report lower FAT in the corpus callosum of subjects who subsequently converted to psychosis. While Tang et al. (Citation2019) did not identify FAT differences between CHR-P and CHR-NP, they did report significantly lower FAT in the corpus callosum and right corona radiata associated with decline in GAF when comparing the entire CHR group to HCs. Such findings, taken together, lend further support to the notion that early FAT changes in CHR individuals may reflect a neurodevelopmental vulnerability to psychosis (Tang et al. Citation2019). Whereas the exact pathologies that drive FAT changes are still not known, the free-water model suggests that these are tissue-based, e.g. myelin-related or axonal pathologies which have been proposed previously (Davis et al. Citation2003; Kubicki and Shenton Citation2014). Neurodevelopmental white matter pathologies may alter the maturational trajectories during adolescence (Kochunov and Hong Citation2014) and potentially serve as one of the key mechanisms in the emergence of psychotic symptoms. Longitudinal free-water imaging studies would be helpful in delineating the influence of environmental insults and inflammatory factors on white matter maturational trajectories (DeRosse et al. Citation2014; Prasad et al. Citation2015; Bennet et al. Citation2018; Fu et al. Citation2019; Wassenaar et al. Citation2019) among individuals developing psychosis.
In terms of FW, the present study diverges from the studies by Wang et al. (Citation2016) and Tang et al. (Citation2019) in that we show that individuals who subsequently develop psychosis also exhibit higher FW compared with those who do not convert to psychosis. This increase in CHR-P individuals more closely aligns with findings from two previous studies of first-episode/recent-onset psychosis populations, which have also described increases in extracellular FW (Pasternak et al. Citation2012; Lyall et al. Citation2018). These studies suggest that FW elevations in psychotic patients might represent an acute brain response, which may serve as an indicator of immune activation taking place around the time of illness onset. Our current finding of increased FW in CHR-P indicate that such an acute response to psychosis-onset, reflected by FW increases, may begin already in the CHR stage in only those who subsequently convert to psychosis, although not to the same extent and magnitude as observed after illness-onset. While the pathological origins of FW increases have yet to be biologically validated, a recent pre-clinical study (Di Biase et al. Citation2020) showed significant FW elevations in the frontal white matter of a rodent model of maternal immune activation widely used in schizophrenia research (Meyer and Feldon Citation2012). These clinical and pre-clinical free-water imaging studies align with mounting evidence for immune activation in individuals with schizophrenia and individuals at CHR (Monji et al. Citation2013; Najjar and Pearlman Citation2015; Goldsmith et al. Citation2016; Khoury and Nasrallah Citation2018; Wang and Miller Citation2018). For example, a meta-analysis of first-episode and acutely-relapsing patients with schizophrenia showed that both patient groups exhibited increased peripheral levels of inflammatory cytokines, such as interleukin(IL)-6, IL-1β, and transforming growth factor-β (TGF-β), which the authors interpret as ‘state markers for acute exacerbation’ (Miller et al. Citation2011). Our study further encourages biological validation studies to establish the relationship between FW and pathological traces of an acute immune response.
In line with previous free-water imaging studies (Lyall et al. Citation2018; Tang et al. Citation2019), it is evident here that differences in FAT and FW between CHR-P and CHR-NP individuals were more focal than differences in the conventional DTI metric FA. While free-water imaging metrics gain biological specificity relative to FA as noted in the introduction, the model likely loses some sensitivity due to decomposing the diffusion signal into two compartments, encouraging large-scale/multi-centre investigations with greater statistical power in the future.
Our findings of associations of positive symptom severity and diffusion measures highlight the clinical significance of microstructural imaging findings in CHR populations (Karlsgodt et al. Citation2009; Bloemen et al. Citation2010; Wang et al. Citation2016). Along with associations with FA, we find significant inverse correlations of positive symptoms with FAT similar to the study by Wang et al. (Citation2016). Our study goes further, however, as it also shows a significant widespread relationship between positive symptoms and FW. While PANSS symptom scores alone did not differ significantly between CHR-NP and CHR-P prior to conversion, many of the regions which we found to be significantly correlated with positive symptoms, such as the corpus callosum, corona radiata, posterior thalamic radiation and superior longitudinal fasciculus, were also among those differentiating CHR-P from CHR-NP. Taken together with the increased FW and decreased FAT in CHR-P, our findings suggest that CHR individuals who present with higher FW and lower FAT values at baseline are more likely to suffer from a greater burden of positive symptoms and are more likely to eventually transition to psychosis. While these findings are promising, the relationship between symptomatology and dMRI measures in patients with schizophrenia is still inconclusive (Cheung et al. Citation2011; Mulert et al. Citation2012; Yang et al. Citation2017). Therefore, studies that use multi-modal imaging techniques might be helpful to delineate more comprehensively biological factors that influence outcomes in symptom severity and transition to psychosis (Moser et al. Citation2018; Tognin et al. Citation2020).
Divergences from the two previous CHR studies (Wang et al. Citation2016; Tang et al. Citation2019) are likely due to a few key factors. First, the overall sample size of the current study was small compared to the two previous studies. Paired with the small percentage of converters in our sample and attrition of CHR participants at follow-up, this likely limited our power to detect significant differences between CHR-P subjects and HCs (Bloemen et al. Citation2010; Rigucci et al. Citation2016), which we acknowledge as a limitation of our work. However, we note that the regions that are implicated in the previous studies, such as the corpus callosum, corona radiata and superior longitudinal fasciculus, are very similar to those showing trend-level differences between CHR-P and HCs in our study (see Figure S1).
Second, unlike previous free-water imaging studies (Wang et al. Citation2016; Tang et al. Citation2019), where CHR were defined based on the SOPS and Comprehensive Assessment of At-Risk Mental States (CAARMS) criteria, in the current study, in addition to the SOPS criteria, inclusion was based on the presence of at least two subjective cognitive or perceptual disturbances (basic symptoms) (Schultze-Lutter et al. Citation2007). Differences in inclusion criteria can add to the heterogeneity of CHR individuals, in addition to impacting both clinical outcomes and transition rates (Fusar-Poli et al. Citation2016). Our CHR sample was also approximately two years older and exhibited less severe symptoms at baseline than the population in the Tang et al. (Citation2019) study, which could account for some differences in the findings, as both age and symptomatology have been shown to affect white matter microstructure (Kyriakopoulos et al. Citation2009; Krakauer et al. Citation2017).
Third, and finally, the current study used a single-shell dMRI acquisition, while Tang et al. (Citation2019) used a multi-shell acquisition. Implementing multi-shell dMRI would have improved the sensitivity to detect subtle group differences and, moreover, would have further increased the confidence in the interpretation of our findings due to a more robust fit of the bi-tensor model and the relaxation of the regularisation that is required to fit data from single b-value dMRIs. (Pasternak et al. Citation2012; Bergmann et al. Citation2020).
While CHR-NP individuals exhibited significantly higher FA and FAT relative to HCs, these increases were spatially very confined. For example, FAT increases were localised to the corona radiata only, a region in which crossing fibres might bias diffusion parameters (Tuch et al. Citation2003). When tracts along the principal direction of diffusion stay intact, increases in FAT, for instance, could occur despite selective degeneration of crossing fibres (Chad et al. Citation2018). Moreover, pilot analyses in a sub-sample of our cohort with follow-up dMRIs indicate that these FA/FAT elevations are no longer present after ∼19 months (nHC = 6, nCHR-NP = 6, pFWE > 0.05; data is presented in the Supplementary Material and Methods). Altogether, it is conceivable that our finding of increased FAT in CHR-NP at baseline might only be temporary or even incidental, making future investigations of larger samples utilising advanced dMRI techniques with higher anatomical accuracy than TBSS (Glenn et al. Citation2016; Pasternak et al. Citation2018; Jeurissen et al. Citation2019) necessary to probe its clinical and biological relevance.
Of further note, whether antipsychotic medication affects white matter is still debateable, with some studies suggesting deteriorating effects on white matter (Szeszko et al. Citation2014) and others proposing a beneficial role in myelination (Bartzokis Citation2011). However, in agreement with a recent large scale investigation (Kelly et al. Citation2018), we did not observe a significant association between diffusion measures and CPZ equivalence in our limited sample of medicated CHR individuals (8 out of 24). In addition, the two previous free-water imaging studies of CHR individuals demonstrated that white matter alterations were present in mostly unmedicated CHR individuals comparing to HCs, suggesting that the observed differences are not due to medication effects (Wang et al. Citation2016; Tang et al. Citation2019).
Our study demonstrates that co-occurring decreased FAT and increased FW contribute to reductions in FA that precede illness-onset in CHR individuals who subsequently develop psychosis. Furthermore, we show that diffusion measures are correlated with positive symptoms in similar regions as those differentiating CHR-NP from CHR-P. Taken together, our results lend support to the notion that in addition to putative tissue-related changes that have previously been shown, the involvement of an extracellular, possibly immune-related, acute response should be considered in the subsequent development of psychosis. Although larger longitudinal studies are needed to replicate our findings, we believe that free-water imaging biomarkers are relevant indicators of increased illness risk and might therefore facilitate improved outcome prediction in CHR cohorts.
Supplemental Material
Download MS Word (1.7 MB)Acknowledgments
We thank all participants who contributed their time to this study. This work was prepared in the context of F.L.N.’s doctoral dissertation at the Faculty of Medicine, University of Hamburg, Hamburg, Germany.
Statement of interest
The authors report no conflict of interest.
Additional information
Funding
References
- Abu-Akel A, Bousman C, Skafidas E, Pantelis C. 2018. Mind the prevalence rate: overestimating the clinical utility of psychiatric diagnostic classifiers. Psychol Med. 48(8):1225–1227.
- American Psychiatric Association. 2009. Diagnostic and statistical manual of mental disorders. DSM-IV-TR. 4th ed. Arlington (VA): American Psychiatric Assoc.
- American Psychiatric Association. 2013. Diagnostic and statistical manual of mental disorders. DSM-5 (5th ed). Washington (DC): American Psychiatric Publ. p. 947.
- Arat HE, Chouinard V-A, Cohen BM, Lewandowski KE, Öngür D. 2015. Diffusion tensor imaging in first degree relatives of schizophrenia and bipolar disorder patients. Schizophr Res. 161(2–3):329–339.
- Avants BB, Tustison NJ, Song G, Cook PA, Klein A, Gee JC. 2011. A reproducible evaluation of ANTs similarity metric performance in brain image registration. Neuroimage. 54(3):2033–2044.
- Bartzokis G. 2011. Neuroglialpharmacology: white matter pathophysiologies and psychiatric treatments. Front Biosci (Landmark Ed)). 16:2695–2733.
- Bennet L, Dhillon S, Lear CA, van den Heuij L, King V, Dean JM, Wassink G, Davidson JO, Gunn AJ. 2018. Chronic inflammation and impaired development of the preterm brain. J Reprod Immunol. 125:45–55.
- Bergmann Ø, Henriques R, Westin C-F, Pasternak O. 2020. Fast and accurate initialization of the free-water imaging model parameters from multi-shell diffusion MRI. NMR Biomed. 33(3):e4219.
- Bloemen OJN, de Koning MB, Schmitz N, Nieman DH, Becker HE, de Haan L, Dingemans P, Linszen DH, van Amelsvoort TAMJ. 2010. White-matter markers for psychosis in a prospective ultra-high-risk cohort. Psychol Med. 40(8):1297–1304.
- Cannon TD. 2016. Brain biomarkers of vulnerability and progression to psychosis. Schizophr Bull. 42:S127–S132.
- Chad JA, Pasternak O, Salat DH, Chen JJ. 2018. Re-examining age-related differences in white matter microstructure with free-water corrected diffusion tensor imaging. Neurobiol Aging. 71:161–170.
- Cheung V, Chiu CPY, Law CW, Cheung C, Hui CLM, Chan KKS, Sham PC, Deng MY, Tai KS, Khong P-L, et al. 2011. Positive symptoms and white matter microstructure in never-medicated first episode schizophrenia. Psychol Med. 41(8):1709–1719.
- Chung Y, Cannon TD. 2015. Brain imaging during the transition from psychosis prodrome to schizophrenia. J Nerv Ment Dis. 203(5):336–341.
- Coughlin JM, Wang Y, Ambinder EB, Ward RE, Minn I, Vranesic M, Kim PK, Ford CN, Higgs C, Hayes LN, et al. 2016. In vivo markers of inflammatory response in recent-onset schizophrenia. A combined study using (11)CDPA-713 PET and analysis of CSF and plasma. Transl Psychiatry. 6(4):e777–e777.
- Davis KL, Stewart DG, Friedman JI, Buchsbaum M, Harvey PD, Hof PR, Buxbaum J, Haroutunian V. 2003. White matter changes in schizophrenia: evidence for myelin-related dysfunction. Arch Gen Psychiatry. 60(5):443–456.
- DeRosse P, Ikuta T, Peters BD, Karlsgodt KH, Szeszko PR, Malhotra AK. 2014. Adding insult to injury: childhood and adolescent risk factors for psychosis predict lower fractional anisotropy in the superior longitudinal fasciculus in healthy adults. Psychiatry Res. 224(3):296–302.
- Di Biase MA, Katabi G, Piontkewitz Y, Cetin-Karayumak S, Weiner I, Pasternak O. 2020. Increased extracellular free-water in adult male rats following in utero exposure to maternal immune activation. Brain Behav Immun. 83:283–287.
- Fedorov A, Beichel R, Kalpathy-Cramer J, Finet J, Fillion-Robin J-C, Pujol S, Bauer C, Jennings D, Fennessy F, Sonka M, et al. 2012. 3D Slicer as an image computing platform for the Quantitative Imaging Network. Magn Reson Imaging. 30(9):1323–1341.
- Fu G, Zhang W, Dai J, Liu J, Li F, Wu D, Xiao Y, Shah C, Sweeney JA, Wu M, et al. 2019. Increased peripheral interleukin 10 relate to white matter integrity in schizophrenia. Front Neurosci. 13:52.
- Fusar-Poli P, Bonoldi I, Yung AR, Borgwardt S, Kempton MJ, Valmaggia L, Barale F, Caverzasi E, McGuire P. 2012. Predicting psychosis: meta-analysis of transition outcomes in individuals at high clinical risk. Arch Gen Psychiatry. 69(3):220–229.
- Fusar-Poli P, Borgwardt S, Bechdolf A, Addington J, Riecher-Rössler A, Schultze-Lutter F, Keshavan M, Wood S, Ruhrmann S, Seidman LJ, et al. 2013. The psychosis high-risk state: a comprehensive state-of-the-art review. JAMA Psychiatry. 70(1):107–120.
- Fusar-Poli P, Cappucciati M, Borgwardt S, Woods SW, Addington J, Nelson B, Nieman DH, Stahl DR, Rutigliano G, Riecher-Rössler A, et al. 2016. Heterogeneity of psychosis risk within individuals at clinical high risk: a meta-analytical stratification. JAMA Psychiatry. 73(2):113–120.
- Fusar-Poli P, Cappucciati M, Rutigliano G, Schultze-Lutter F, Bonoldi I, Borgwardt S, Riecher-Rössler A, Addington J, Perkins D, Woods SW, et al. 2015. At risk or not at risk? A meta-analysis of the prognostic accuracy of psychometric interviews for psychosis prediction. World Psychiatry. 14(3):322–332.
- Glenn GR, Kuo L-W, Chao Y-P, Lee C-Y, Helpern JA, Jensen JH. 2016. Mapping the orientation of white matter fiber bundles: a comparative study of diffusion tensor imaging, diffusional kurtosis imaging, and diffusion spectrum imaging. AJNR Am J Neuroradiol. 37(7):1216–1222.
- Goldsmith DR, Rapaport MH, Miller BJ. 2016. A meta-analysis of blood cytokine network alterations in psychiatric patients. Comparisons between schizophrenia, bipolar disorder and depression. Mol Psychiatry. 21(12):1696–1709.
- Hartmann JA, Yuen HP, McGorry PD, Yung AR, Lin A, Wood SJ, Lavoie S, Nelson B. 2016. Declining transition rates to psychotic disorder in "ultra-high risk" clients. Investigation of a dilution effect. Schizophr Res. 170(1):130–136.
- Jenkinson M, Bannister P, Brady M, Smith S. 2002. Improved optimization for the robust and accurate linear registration and motion correction of brain images. Neuroimage. 17(2):825–841.
- Jeurissen B, Descoteaux M, Mori S, Leemans A. 2019. Diffusion MRI fiber tractography of the brain. NMR Biomed. 32(4):e3785
- Karlsgodt KH, Niendam TA, Bearden CE, Cannon TD. 2009. White matter integrity and prediction of social and role functioning in subjects at ultra-high risk for psychosis. Biol Psychiatry. 66(6):562–569.
- Kay SR, Fiszbein A, Opler LA. 1987. The positive and negative syndrome scale (PANSS) for schizophrenia. Schizophr Bull. 13(2):261–276.
- Keihaninejad S, Ryan NS, Malone IB, Modat M, Cash D, Ridgway GR, Zhang H, Fox NC, Ourselin S. 2012. The importance of group-wise registration in tract based spatial statistics study of neurodegeneration: a simulation study in Alzheimer's disease. PLoS One. 7(11):e45996
- Kelly S, Jahanshad N, Zalesky A, Kochunov P, Agartz I, Alloza C, Andreassen OA, Arango C, Banaj N, Bouix S, et al. 2018. Widespread white matter microstructural differences in schizophrenia across 4322 individuals: results from the ENIGMA Schizophrenia DTI Working Group. Mol Psychiatry. 23(5):1261–1269.
- Khoury R, Nasrallah HA. 2018. Inflammatory biomarkers in individuals at clinical high risk for psychosis (CHR-P): State or trait? Schizophr Res. 199:31–38.
- Kochunov P, Hong LE. 2014. Neurodevelopmental and neurodegenerative models of schizophrenia: white matter at the center stage. Schizophr Bull. 40(4):721–728.
- Krakauer K, Ebdrup BH, Glenthøj BY, Raghava JM, Nordholm D, Randers L, Rostrup E, Nordentoft M. 2017. Patterns of white matter microstructure in individuals at ultra-high-risk for psychosis: associations to level of functioning and clinical symptoms. Psychol Med. 47(15):2689–2707.
- Kubicki M, Shenton ME. 2014. Diffusion Tensor Imaging findings and their implications in schizophrenia. Curr Opin Psychiatry. 27(3):179–184.
- Kyriakopoulos M, Perez-Iglesias R, Woolley JB, Kanaan RAA, Vyas NS, Barker GJ, Frangou S, McGuire PK. 2009. Effect of age at onset of schizophrenia on white matter abnormalities. Br J Psychiatry. 195(4):346–353.
- Leicht G, Vauth S, Polomac N, Andreou C, Rauh J, Mussmann M, et al. 2016. EEG-informed fMRI reveals a disturbed gamma-band-specific network in subjects at high risk for psychosis. Schizophrenia Bulletin. 42(1):239–249.
- Ling J, Merideth F, Caprihan A, Pena A, Teshiba T, Mayer AR. 2012. Head injury or head motion? Assessment and quantification of motion artifacts in diffusion tensor imaging studies. Hum Brain Mapp. 33(1):50–62.
- Lyall AE, Pasternak O, Robinson DG, Newell D, Trampush JW, Gallego JA, Fava M, Malhotra AK, Karlsgodt KH, Kubicki M, et al. 2018. Greater extracellular free-water in first-episode psychosis predicts better neurocognitive functioning. Mol Psychiatry. 23(3):701–707.
- Meyer U, Feldon J. 2012. To poly(I:C) or not to poly(I:C): advancing preclinical schizophrenia research through the use of prenatal immune activation models. Neuropharmacology. 62(3):1308–1321.
- Miller BJ, Buckley P, Seabolt W, Mellor A, Kirkpatrick B. 2011. Meta-analysis of cytokine alterations in schizophrenia. Clinical status and antipsychotic effects. Biol Psychiatry. 70(7):663–671.
- Miller TJ, McGlashan TH, Rosen JL, Cadenhead K, Cannon T, Ventura J, McFarlane W, Perkins DO, Pearlson GD, Woods SW, et al. 2003. Prodromal assessment with the structured interview for prodromal syndromes and the scale of prodromal symptoms: predictive validity, interrater reliability, and training to reliability. Schizophr Bull. 29(4):703–715.
- Monji A, Kato TA, Mizoguchi Y, Horikawa H, Seki Y, Kasai M, Yamauchi Y, Yamada S, Kanba S. 2013. Neuroinflammation in schizophrenia especially focused on the role of microglia. Prog Neuropsychopharmacol Biol Psychiatry. 42:115–121.
- Mori S, Wakana S, van Zijl PCM, Nagae-Poetscher LM. 2005. MRI Atlas of human white matter. 1st ed. Amsterdam (The Netherlands): Elsevier Science. p. 276.
- Moser DA, Doucet GE, Lee WH, Rasgon A, Krinsky H, Leibu E, Ing A, Schumann G, Rasgon N, Frangou S, et al. 2018. Multivariate associations among behavioral, clinical, and multimodal imaging phenotypes in patients with psychosis. JAMA Psychiatry. 75(4):386–395.
- Mulert C, Kirsch V, Whitford TJ, Alvarado J, Pelavin P, McCarley RW, Kubicki M, Salisbury DF, Shenton ME. 2012. Hearing voices: a role of interhemispheric auditory connectivity? World J Biol Psychiatry. 13(2):153–158.
- Najjar S, Pearlman DM. 2015. Neuroinflammation and white matter pathology in schizophrenia: systematic review. Schizophr Res. 161(1):102–112.
- Pasternak O, Kelly S, Sydnor VJ, Shenton ME. 2018. Advances in microstructural diffusion neuroimaging for psychiatric disorders. Neuroimage. 182:259–282.
- Pasternak O, Kubicki M, Shenton ME. 2016. In vivo imaging of neuroinflammation in schizophrenia. Schizophr Res. 173(3):200–212.
- Pasternak O, Shenton ME, Westin C-F. 2012. Estimation of extracellular volume from regularized multi-shell diffusion MRI. Med Image Comput Comput Assist Interv. 15(Pt 2):305–312.
- Pasternak O, Sochen N, Gur Y, Intrator N, Assaf Y. 2009. Free water elimination and mapping from diffusion MRI. Magn Reson Med. 62(3):717–730.
- Pasternak O, Westin C-F, Bouix S, Seidman LJ, Goldstein JM, Woo T-UW, Petryshen TL, Mesholam-Gately RI, McCarley RW, Kikinis R, et al. 2012. Excessive extracellular volume reveals a neurodegenerative pattern in schizophrenia onset. J Neurosci. 32(48):17365–17372.
- Pasternak O, Westin C-F, Dahlben B, Bouix S, Kubicki M. 2015. The extent of diffusion MRI markers of neuroinflammation and white matter deterioration in chronic schizophrenia. Schizophr Res. 161(1):113–118.
- Pettersson-Yeo W, Benetti S, Marquand AF, Dell‘Acqua F, Williams SCR, Allen P, Prata D, McGuire P, Mechelli A. 2013. Using genetic, cognitive and multi-modal neuroimaging data to identify ultra-high-risk and first-episode psychosis at the individual level. Psychol Med. 43(12):2547–2562.
- Prasad KM, Upton CH, Nimgaonkar VL, Keshavan MS. 2015. Differential susceptibility of white matter tracts to inflammatory mediators in schizophrenia: an integrated DTI study. Schizophr Res. 161(1):119–125.
- Rigucci S, Santi G, Corigliano V, Imola A, Rossi-Espagnet C, Mancinelli I, De Pisa E, Manfredi G, Bozzao A, Carducci F, et al. 2016. White matter microstructure in ultra-high risk and first episode schizophrenia: A prospective study. Psychiatry Res Neuroimaging. 247:42–48.
- Schmidt SJ, Schultze-Lutter F, Schimmelmann BG, Maric NP, Salokangas RKR, Riecher-Rössler A, van der Gaag M, Meneghelli A, Nordentoft M, Marshall M, et al. 2015. EPA guidance on the early intervention in clinical high risk states of psychoses. Eur Psychiatry. 30(3):388–404.
- Schultze-Lutter F, Addington J, Ruhrmann S, Klosterkotter J. 2007. Schizophrenia proneness instrument. Adult version (SPI-A). Rome: Giovanni Fioriti Editore. VII, p. 91 S.
- Schultze-Lutter F, Michel C, Schmidt SJ, Schimmelmann BG, Maric NP, Salokangas RKR, Riecher-Rössler A, van der Gaag M, Nordentoft M, Raballo A, et al. 2015. EPA guidance on the early detection of clinical high risk states of psychoses. Eur Psychiatry. 30(3):405–416.
- Sheehan DV, Lecrubier Y, Sheehan KH, Amorim P, Janavs J, Weiller E, et al. 1998. The Mini-International Neuropsychiatric Interview (M.I.N.I.): the development and validation of a structured diagnostic psychiatric interview for DSM-IV and ICD-10. J Clin Psychiatry. 59 (Suppl 20):22–33.
- Smieskova R, Fusar-Poli P, Allen P, Bendfeldt K, Stieglitz RD, Drewe J, Radue EW, McGuire PK, Riecher-Rössler A, Borgwardt SJ, et al. 2010. Neuroimaging predictors of transition to psychosis-a systematic review and meta-analysis. Neurosci Biobehav Rev. 34(8):1207–1222.
- Smith SM, Jenkinson M, Johansen-Berg H, Rueckert D, Nichols TE, Mackay CE, Watkins KE, Ciccarelli O, Cader MZ, Matthews PM, et al. 2006. Tract-based spatial statistics: voxelwise analysis of multi-subject diffusion data. Neuroimage. 31(4):1487–1505.
- Smith SM, Nichols TE. 2009. Threshold-free cluster enhancement. Addressing problems of smoothing, threshold dependence and localisation in cluster inference. NeuroImage. 44(1):83–98.
- Szeszko PR, Robinson DG, Ikuta T, Peters BD, Gallego JA, Kane J, Malhotra AK. 2014. White matter changes associated with antipsychotic treatment in first-episode psychosis. Neuropsychopharmacol. 39(6):1324–1331.
- Takahashi N, Sakurai T, Davis KL, Buxbaum JD. 2011. Linking oligodendrocyte and myelin dysfunction to neurocircuitry abnormalities in schizophrenia. Prog Neurobiol. 93(1):13–24.
- Takahashi T, Suzuki M. 2018. Brain morphologic changes in early stages of psychosis: implications for clinical application and early intervention. Psychiatry Clin Neurosci. 72(8):556–571.
- Tang Y, Pasternak O, Kubicki M, Rathi Y, Zhang T, Wang J, Li H, Woodberry KA, Xu L, Qian Z, et al. 2019. Altered cellular white matter but not extracellular free water on diffusion mri in individuals at clinical high risk for psychosis. Am J Psychiatry. 176(10):820–828.
- Tkachev D, Mimmack ML, Ryan MM, Wayland M, Freeman T, Jones PB, Starkey M, Webster MJ, Yolken RH, Bahn S, et al. 2003. Oligodendrocyte dysfunction in schizophrenia and bipolar disorder. Lancet (London, England). 362(9386):798–805.
- Tognin S, van Hell HH, Merritt K, Winter-van Rossum I, Bossong MG, Kempton MJ, et al. 2020. Towards precision medicine in psychosis: benefits and challenges of multimodal multicenter studies-PSYSCAN: translating neuroimaging findings from research into clinical practice. Schizophr Bull. 46(2):432–441.
- Tuch DS, Reese TG, Wiegell MR, van Wedeen J. 2003. Diffusion MRI of complex neural architecture. Neuron. 40(5):885–895.
- Vijayakumar N, Bartholomeusz C, Whitford T, Hermens DF, Nelson B, Rice S, Whittle S, Pantelis C, McGorry P, Schäfer MR, et al. 2016. White matter integrity in individuals at ultra-high risk for psychosis: a systematic review and discussion of the role of polyunsaturated fatty acids. BMC Psychiatry. 16(1):287.
- Vikhreva OV, Rakhmanova VI, Orlovskaya DD, Uranova NA. 2016. Ultrastructural alterations of oligodendrocytes in prefrontal white matter in schizophrenia: a post-mortem morphometric study. Schizophr Res. 177(1-3):28–36.
- Wang AK, Miller BJ. 2018. Meta-analysis of cerebrospinal fluid cytokine and tryptophan catabolite alterations in psychiatric patients. Comparisons between schizophrenia, bipolar disorder, and depression. Schizophr Bull. 44(1):75–83.
- Wang C, Ji F, Hong Z, Poh JS, Krishnan R, Lee J, Rekhi G, Keefe RSE, Adcock RA, Wood SJ, et al. 2016. Disrupted salience network functional connectivity and white-matter microstructure in persons at risk for psychosis: findings from the LYRIKS study. Psychol Med. 46(13):2771–2783.
- Wassenaar TM, Yaffe K, van der Werf YD, Sexton CE. 2019. Associations between modifiable risk factors and white matter of the aging brain: insights from diffusion tensor imaging studies. Neurobiol Aging. 80:56–70.
- Winkler AM, Ridgway GR, Webster MA, Smith SM, Nichols TE. 2014. Permutation inference for the general linear model. Neuroimage. 92:381–397.
- Wölwer W, Baumann A, Bechdolf A, Buchkremer G, Häfner H, Janssen B, Klosterkötter J, Maier W, Möller H-J, Ruhrmann S, et al. 2006. The German Research Network on schizophrenia–impact on the management of schizophrenia. Dialogues Clin Neurosci. 8(1):115–121.
- Wood SJ, Yung AR, McGorry PD, Pantelis C. 2011. Neuroimaging and treatment evidence for clinical staging in psychotic disorders: from the at-risk mental state to chronic schizophrenia. Biol Psychiatry. 70(7):619–625. Available from: http://www.sciencedirect.com/science/article/pii/S0006322311005968.
- Yang X, Cao D, Liang X, Zhao J. 2017. Schizophrenia symptomatic associations with diffusion tensor imaging measured fractional anisotropy of brain: a meta-analysis. Neuroradiology. 59(7):699–708.
- Yung AR, Yuen HP, McGorry PD, Phillips LJ, Kelly D, Dell'Olio M, Francey SM, Cosgrave EM, Killackey E, Stanford C, et al. 2005. Mapping the onset of psychosis: the comprehensive assessment of at-risk mental states. Aust N Z J Psychiatry. 39(11–12):964–971.