
Abstract
The construction industry is a driver of economic and social development in developing countries; however, it is also one of the primary sources of entropic elements such as construction and demolition waste (CDW). Since construction is expected to continue growing, it is essential to study the CDW status under these scenarios. To the best of the author’s knowledge, this is the first academic research in Peru that deals with CDW. The information for the research is collected from primary and secondary sources, which includes 265 surveys, interviews, and visits to construction and disposal sites. The results are obtained from a cross-analysis of the influence of different aspects (experience and education level of the construction site manager, dimension, or socio-economical level of the site, building use, among others) on CDW management. Further, significant findings related to each stage of the CDW cycle are presented. The obtained findings provide information for effective decision making in terms of policies and regulations on CDW, which will help improve its management, reduce environmental impact, and provide economic benefits, especially in developing countries.
Introduction
The construction industry is one of the drivers of the economic and social development of a country. However, entropic elements that affect several urban subsystems are generated during the construction process (Fistola Citation2011), including construction and demolition waste (CDW). The high generation volume of CDW (Rodríguez-Robles et al. Citation2015) and its disposal, which in developing countries is usually done in the nearest available open space (Abdelhamid Citation2014), is a significant problem.
Although various studies have been conducted on CDW on a global scale, this has not been researched thoroughly in Peru, and academic studies on the generation of CDW are lackingFootnote1. Further, the existing information is limited, the responsibilities of various stakeholders remain unclear, and there is a lack of resources to monitor if construction companies comply with the ambiguous and little-known regulations on CDW. However, the construction and development sector is predicted to continue to grow at a rate of 9.5% in 2019 (Peruvian Construction Chamber), which will lead to increased CDW generation. Thus, it is essential to produce reliable data for stakeholders to enable them to make informed decisions and foster a positive change (Abarca-Guerrero et al. Citation2013). Furthermore, regional quantification can help determine new infrastructure implementation, create jobs or resources for waste transportation, and develop practical policies (Wu et al. Citation2014).
Thus, this research aims to recognize the status of the different stages of CDW in Peru and determine the construction process variables and stakeholders that influence its management, to identify the extent to which CDW management is followed, and to determine problems arising at each stage. The results of this research will make it feasible to propose process improvements and approaches for the optimized use of resources. Methodologically, this research disaggregates the information for each stage of the CDW cycle and then processes and cross-verifies it to finally facilitate the broad and systemic vision of CDW management.
In Peru, CDW is classified as nonmunicipal waste and defined as waste generated during construction, restoration, renovation, remodelling, and demolition of buildings and as a result of infrastructure activities and processes (Ministry of Environment & Ministry of Housing and Construction and Sanitation Citation2016). In addition, CDW management is regulated by a general law, which sets forth rights, obligations, powers, and responsibilities regarding waste management and handling (Legislative Decree No. 1278 1278, Citation2017). The Ministry of Environment currently employs a framework law and each government sector is responsible for legislating the management of the waste generated by that sector. However, CDW is regulated by several entities according to the generated volume or construction work size.
Although the premise for these laws is a circular economy aimed at minimising, recovering (material or energy), and disposing CDW appropriately, the current scenario is the opposite because of legal gapsFootnote2 that prevent proper CDW management, thereby resulting in incorrect disposal, little or zero recovery, and high waste generation. CDW management includes generation, storage, collection, transportation, treatment (reclamation), and final disposal (Ministry of Environment, 2016).
The study of processes, stakeholders, and authorities involved in CDW management in the Lima Metropolitan Area (LMA) reveals that construction companies—the main generators of CDW—take part directly only in the generation and storage, and they usually avoid being involved in the collection, transportation, reclamation, and disposal processes executed by solid waste operating companies (EO-RS, by its Spanish acronym). In practice, the responsibility is transferred among stakeholders.
This study focuses on the status of CDW management in the LMA for diagnosing the different stages in CDW management. The information is obtained from primary and secondary sources including 265 surveys at construction sites, interviews with experts, and visits to construction and disposal sites. The study findings provide information for proper decision making regarding public and private sector policies and regulations that help improve management, reduce environmental impact, and provide economic benefits.
International scenario
The following section is arranged considering the CDW stages. It presents theoretical information about CDW management relevant to Lima. The described ideas are considered for elaborating the survey questionnaire and interpreting the results.
It is important to obtain the opinion of different stakeholders to implement or improve CDW management plans. These stakeholders have different jurisdiction levels (i.e. regional, local, and construction site), and they can be from the public or private sector, regulators, project management teams, construction companies, managers or resident engineers, or CDW collection companies (Yuan Citation2013); all of these stakeholders were included in the questionnaire and consulted through this research.
For the segregation of CDW, it is recommended to first identify an appropriate segregation system. To this end, a decision matrix can be employed (Abdelhamid Citation2014). Segregation can be done on the construction or disposal site. The first option is less expensive; however, it requires an experienced contractor, more space on the construction site, and increased government control. For the second option, the government does not have the burden of monitoring construction sites and a large area is not required; however, the increased transportation and the work and handling capacity are necessary requirements at the disposal site (Abdelhamid Citation2014). In addition, waste segregation engenders two main problems: poor accuracy in waste sorting (both inert and non-inert) and the short time assigned to the segregation stage, which results in the recovery of only the most expensive material and an increased amount of waste transferred to public dump sites (Poon et al. Citation2004). These ideas were included in the questionnaire to identify the main segregation techniques employed in Lima.
The CDW can be classified as construction, demolition, or renovation waste based on how it is generated. Further, CDW generation rates are affected by several factors such as construction method, project size, building type, storage method, technical problems, and human errors (Wu et al. Citation2014), and also by the type of management, i.e. formal or informal (Pacheco et al. Citation2017). In addition, these variables were considered part of the questionnaire.
Several methods can be employed to quantify CDW; these methods include site visits, waste generation rate, life cycle analysis, accumulation method, and variables modelling (Wu et al. Citation2014). For a practical estimation, an indirect measurement can be employed (m3 of CDW hauled in trucks); this measurement can be supplemented with estimations based on the form in which the waste is placed (i.e. stockpiled, gathered, scattered, or stacked) and by identifying a different method for each form (Lau et al. Citation2008). For each type of intervention (demolition, renovation, construction), CDW generation rates (kg/m2) can be estimated. Further, they can be applied to estimate the CDW generated and the recyclable material (Lu et al. Citation2017). To estimate rates, site visits can be conducted to collect information about waste generation coefficients (Wu et al. Citation2014). For the present study, waste is quantified based on the number of trucks and the CDW load they transport.
In addition to CDW generation rates, there are several other methods to quantify waste, including the global index method; estimations based on constructed area (waste index), material flow, data from past projects, and waste form; or by using quantification software such as SMARTWaste or BIM modelling, which can provide the quantity, composition and generation time, and location where waste is planned to be dumped (Cheng and Ma Citation2013). Although it is possible to predict the quantity of CDW, it changes over time, and the long-term information is insufficient (Bergsdal et al. Citation2008). Further, the estimation of CDW depends on data that is difficult to find in developing countries.
To determine the composition of the CDW, it is necessary to first ensure appropriate segregation to obtain the correct information (Abdelhamid Citation2014). Factors such as raw material, construction products used, architectural techniques (design system), and local construction and demolition techniques affect waste composition (Rodríguez-Robles et al. Citation2015). The CDW composition is linked to the material and building area where it is often used (Kleemann et al. Citation2016). In this sense, a survey is a useful instrument to obtain information about CDW composition (Poon et al. Citation2004; Pacheco et al. Citation2017; Umar et al. Citation2020).
Waste disposal can be conducted formally at public dumpsites, sorting dump sites, or debris dumps (Cheng and Ma Citation2013) or informally in an illegal dumpsite, which is closer to the construction site and charges lower rates than the formal dumps (Katz and Baum Citation2011). The failure to reclaim large amounts of CDW from informal dump sites is a global problem (Bergsdal et al. Citation2008; Katz and Baum Citation2011; Rodríguez-Robles et al. Citation2015) and is also present in Lima.
Finally, providing evidence of the financial benefits of appropriate waste management is an important point to consider when proposing CDW recycling and management policies (Wang et al. Citation2004). An appropriate circular CDW management model helps provide a suitable characterization (Solís-Guzmán et al. Citation2009). The legislation can improve CDW, and the government should grant extra incentives and recognition to stakeholders (Ghaffar et al. Citation2020).
The reference models described above cannot be applied directly to local cases; however, they can be used as the basis to propose alternatives (Pacheco et al. Citation2017), both in terms of methodological design and as solutions to the CDW problem in Lima.
Methodology and study design
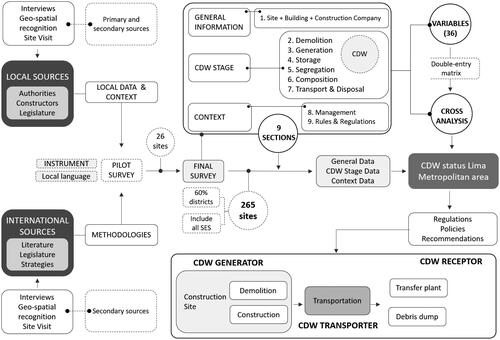
The methodological proposal draws on the identification of international and local CDW management models. Normative bibliographic reviews, interviews with stakeholders, surveys at 265 construction sites, and visits to disposal sites were conducted. The collected data were processed, and the status of CDW management at the local level was approximated.
The survey is the main source of information in this study. Most questions were devised on the basis of a review of the literature (Poon et al. Citation2004; Bergsdal et al. Citation2008; Osmani et al. Citation2008; Tam Citation2008; Al-Khatib et al. Citation2010; Katz and Baum Citation2011; Cheng and Ma Citation2013; Yuan Citation2013; Abdelhamid 2014; Kleemann et al. Citation2016; Ola-Adisa Citation2015; Chinda Citation2016; Wahi et al. Citation2016; Lu et al. Citation2017; Ministry of Housing and Construction and Sanitation Citation2017; Pacheco et al. Citation2017). In addition, documents from the Ministry of Environment were used (Ministry of Housing and Construction and Sanitation Citation2017) and supplemented with a few questions from the authors. The reviewed terminology was adapted to fit the local language, similar questions were correlated, and then, pilot surveys were conducted. The result was a 26-question survey. This instrument was divided into nine sections, organized in three groups. Each section has one to four questions regarding a specific aspect of waste management. The answers can be read individually or on a cross-reference basis.
The surveyFootnote3 covers 28 districts of the LMA, and it was aimed at collecting information about CDW management and handling and waste generators’ awareness of rules and regulations. The results allowed us to identify the current strengths and weaknesses, in addition to opportunities and risks (Yuan Citation2013). Finally, visitsFootnote4 to 28 location were conducted as part of a larger study.
The construction profile in the LMA was examined based on the premise that a greater amount of CDW is generated for a higher amount of square metres built; it was found that the highest construction activity can be attributed to those with a high socioeconomic status (SES) (Peruvian Chamber of Construction Citation2017).
First, areas in Lima were categorized according to SES using the socioeconomic sectors plan from the National Statistics and Information Technology Institute (INEI; Spanish acronym) (National Statistics and Information Technology Institute (INEI), Citation2016). Then, construction sites were identified and arranged according to SES based on the classificationFootnote5 developed by the Peruvian Association of Market Research Companies (APEIM; Spanish acronym). The sample comprised 31.7% of construction sites in SES A, 41.1% in B, 15.5% in C, and 6.8% in D. The remaining 4.2% was in Callao, where the predominant SES categories are C and D. Therefore, most samples were from SES A, B, and C districts and corresponding areas; category D was considered to a lesser extent; and category E was excluded because of the lack of infrastructure and construction sites.
For processing the survey, a Microsoft Excel spreadsheet was used, and a double-entry matrix was developed with 36 variables on both sides. The answers were interpreted based on the second variable. The sample is characterized using a system of filters; the results of each crossing of variables are later interpreted. Graphs are developed to identify rates, characteristics, or trends in the current CDW management model.
Finally, the results are interpreted from a local perspective considering the rules and regulations and the information from interviews with local stakeholders. Thus, a broad picture is obtained regarding the status of CDW in the LMA, and initial ideas and recommendations are presented for actions and policies aimed at improving CDW management. A general framework flowchart is presented in .
Figure 1. Research methodology flowchart.
Results
The results are presented in three sections: general information about the sample, processing of survey variables according to stages, and cross analysis of survey variables.
Sample
The surveys report the following general sample characteristics. First, 33% of companies have more than 15 years of experience in construction; 30%, between 10–15 years; and the remaining 20%, less than 10 years. With respect to respondents, 21% had more than 20 years of experience in construction; 34%, between 10–20 years; and the rest, less than 10 years. Finally, in terms of the positions held by the respondents: 67.5% were occupational safety and health and environmental supervisors or master builders, both being positions with a technical, job-specific profile.
Most construction considered for the survey were at a significant stage in terms of waste generation: foundation/structures (34%), coarse plastering (32%), and thin plastering (19%). With respect to the construction system, a reinforced concrete rigid frame system prevailed (85%), with load bearing walls and panels being reported to a lesser extent (13%). The presence of concrete, steel, and formwork is central to both systems.
Over 80% of the sites were housing constructions. Furthermore, more than 60% of the surveyed construction sites had a build area of over 1,000 sqm and more than 75% had more than five floors. It is indeed strange that nearly 85% of the respondents stated that they have an environmental management instrument (EMI) in placeFootnote6 because this would mean that their current CDW management is appropriate; however, based on our review, this was not the case.
The sample provides a clear, objective picture of the status of construction in the LMA. All sectors are represented; particularly those that generate the greatest amount of waste, with most projects being housing projects which reflects the status of construction in the city (Peruvian Construction Chamber). Further, the urban densification process continues to progress, and many new construction companies are building new projects, which is a scenario that encourages a paradigm change in solid construction waste management. All sample-related graphs can be found in Appendix A, part 1.
Variables According to each stage
The collected information is presented and arranged according to each CDW cycle stage (generation, demolition, storage, segregation, composition, transportation, and disposal).
With respect to waste generation, stages that generate the greatest amount of waste, according to the respondents’ experience, are demolition (35.8%), coarse or rough plastering (25.3%), earth work (21.9%), foundation/structures (11.3%), and thin plastering (5.7%). This is opposite to the idea that waste increases exponentially during the construction cycle (Katz and Baum Citation2011); besides, earth work should generate inert materials (not waste). Further, survey respondents associated sources of waste generation to last minute changes (32.4%), lack of technical information (22.5%), poor material handling (18.0%), storage mismanagement (15.3%), and procurement errors (11.8%). Hence, the two greatest waste generation sources are not directly associated with the construction stage but with the design stage.
When asked about strategies that they currently use to reduce waste generation and the ones they might implement in the future, it was found that 79% of the respondents used one strategy, 15% used two, and 2% used three. However, respondents are interested in reducing waste generation because 72% expressed willingness to use three strategies, 21% for two strategies, and only 6% for one strategy. The comparison of strategies used with those that are not currently used shows that the former are fewer than those that can be implemented. The following results were obtained: using a waste reduction plan (42.3% and 78.1%); avoiding design changes (22.3% and 52.5%); reusing materials on site (17.7% and 46.8%); engaging CDW management consulting services (13.6% and 47.2%); using universal measurements (9.8% and 24.2%); and using a design for disassembly (3.8% and 15.5%).
In terms of demolition, 64.5% respondents admitted that there had been a prior demolition. Of these respondents, 42.1% carried out selective demolition, which according to Lauritzen & Hahn (1992), requires a concise sorting of different material categories to prevent any contamination of inert or recyclable parts with wood, paper, cardboard, plastics, and metals (as cited on Poon Citation1997). Further, 14% performed a partially selective demolition, and 43.6% did not perform selective demolition. The main obstacle for refraining from demolition was time (54.1%), followed by cost (31.1%), absence of benefits (25.7%), the fact that the construction system does not allow waste valorisation (9.5%), absence of transportation companies to re-valorise waste (6.8%), understaffing for task performance (4.1%), and little operational knowledge (1.4%). When reviewing previous Google Earth aerial images for the surveys in which respondents had stated that there had been no demolition (35.1%), it was clear that there was a building previously in 86.5% of the sites, which means that the demolition was probably part of another process or permit or that another company was subcontracted to do it.
In terms of storage, the survey identified 12 waste materials that were stored on site. Steel was stored in most construction sites (52%), along with wood (41%) and plastic (37%); these materials are sold quickly and produce a monetary benefit. Other wastes stored on site include concrete (35%), aggregates (33%), paper (31%), glass (12%), brick (9%), hazardous waste (5%), organic waste (3%), ceramic waste (3%), and commingled waste (6%). Additionally, five waste storage forms were identified: putting waste directly on the ground (60.3%), use of cylinders (32.2%), dumpsters (3.7%), ecological boxesFootnote7 (3.4%), and bags (0.6%).
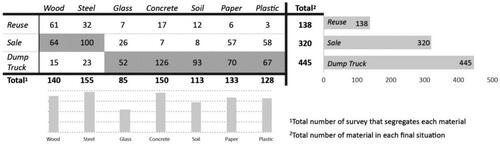
For CDW segregation, although nearly two thirds of waste are stored on the ground, 66.8% assert that they have a segregation process in place, with 40.6% performing the segregation based on waste type (). The segregated materials are arranged according to three potential destinations: reuse on site (15.2%), sale (35.4%), and disposal in dump trucks (49.3%). The final disposal in dump trucks is the prevailing practice for nearly all materials, except for wood and steel (). Because about half of the originally segregated waste is disposed of in dump trucks, waste is very likely to mix up eventually, with no valorisation by the constructor. This, in addition to the 33.2% of waste that is not segregated, indicates that the responsibility for segregation is transferred to the transportation company in most cases.
Figure 2. Comparison of methods of segregation and results from survey.
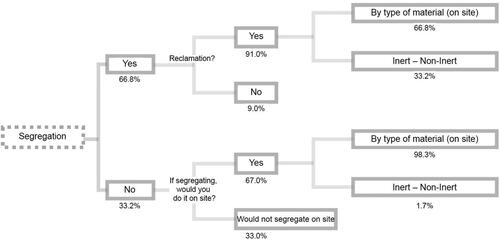
Figure 3. Final scenario based on waste type.
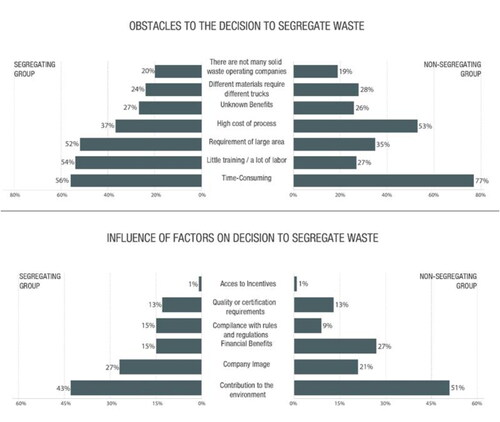
Construction sites that reported the segregation of waste (177) and those that admitted to no segregation of waste (88) were asked to specify factors that influence (or would influence) their decision to segregate and the obstacles faced by them (). Cost was found to be the main obstacle for waste segregation because it is considered an expensive, time-consuming process.
Figure 4. Factors that influence the decision to segregate waste.
The transportation and final disposal of CDW was performed by small vehicle companies or individual dump truck drivers (56.2%), by EO-RS registered with the Ministry of Environment (37%), or using vehicles owned by the construction company (6.8%), i.e. 63% of the disposal is not registered or officially supervised. Further, only 35.5% of the respondents know the location where the waste from their construction is disposed. From this group, 66% asserted that they dumped waste in landfills, 12.8% in quarries, and 21.3% in other places. Those that said they ignored where their waste is disposed were asked why they did not know such information: 69.7% answered that the transportation company should be responsible for this activity, 17.4% said they were not responsible for this information, and 12.9% expressed that this information was not important for the company. Similar to segregation, many companies transferred the responsibility of final disposal to the transportation company.
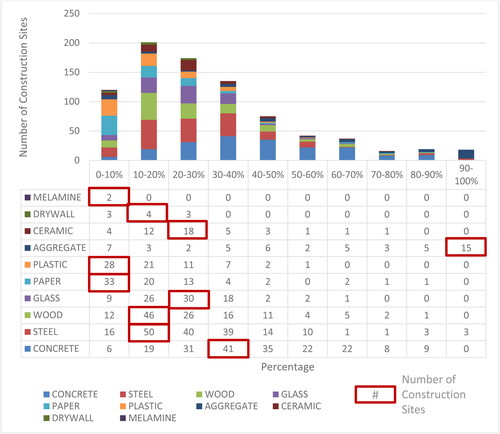
For waste composition, the respondents were asked what materials comprised the CDW, the percentage they represented, and the frequency with which the material was mentioned and its share in the total waste was evaluated. The most frequently mentioned material was concrete (193 construction sites), followed by steel (177), wood (123), and glass (88). The frequency of aggregates is not as high; however, in terms of the percentage of use, 15 construction sites said that aggregates account for 90–100% of the waste they generate. Concrete has the highest percentage. Some sites state that concrete waste accounts for 80–90% of the total; however, it actually accounts for approximately 40% of the waste generated ().
Figure 5. Composition of waste according to the number of construction sites.
The respondents were asked to list five factors affecting CDW management by order of relevance. A rating scale was provided, with 5 points for the most important factor and 1 point to the least important one. The sum of the results revealed that safety is the most relevant factor (949 points), followed by quality (830), environment (750), time (737), and finally, cost (709). Since safety and quality are the most influential factors, it is essential to count the recovered waste as a quality and safety index for certifications, accreditations, and regulation.
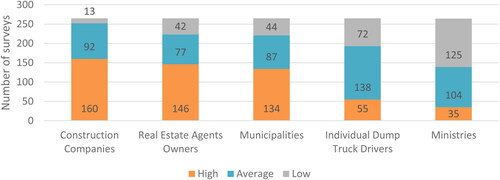
Concerning the influence of stakeholders in enhancing waste management, it was found that the most influential stakeholders were construction companies, owners, and municipalities; the influence of individual dump truck drivers is average. Further, ministries have a low influence. This underscores the existence of the non-existent supervision by the government ().
Figure 6. Influence of stakeholders on CDW management.
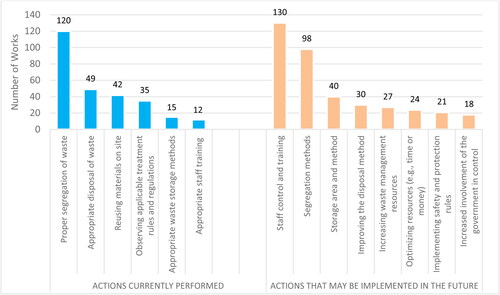
For the methods to reduce waste generation, the respondents reported that they conduct proper segregation, and much of the segregated waste is disposed of together in dump trucks. Furthermore, staff training is the least mentioned action as a current practice; however, it is the most mentioned future practice ().
Figure 7. Current and future CDW management actions.
Crossing of survey information
Once primary information processing is complete, information pertaining to related questions was crossed verified. The main findings from information crossing, specifically relevant and new information regarding the status of CDW and demolition in the LMA, are provided below. The information, data, and graphs to supplement each point under analysis can be reviewed in Appendix A, part 2.
Experience
The influence of years of experience (of professionals and companies) on waste management was analysed. The results show that experience is not a determining factor for proper waste management. Thus, the group with little experience handles demolition, segregation, and storage better, although 88% in this group admit that they ignore the relevant rules and regulations. This allows us to assert that knowing rules and regulations does not ensure proper waste management. Poor government supervision probably results in laws being disregarded by companies. As the most important factors in construction work, the environmental factor holds little relevance for both groups. Finally, a comparison of the companies’ and professionals’ experience showed that corporate experience is more important than the experience of the people at the construction site.
Education level of respondents
The level of influence of academic education of the respondents was assessed. Two groups were defined: technicians (i.e. construction safety experts and master builders or construction foreman) and professionals (i.e. resident, and supervising engineers and/or architects). Although the group of professionals is more influential regarding planning and design related ideas, the answers of both groups were similar, thereby indicating that education levels do not influence the proper management of CDW.
Socioeconomic status
A review was conducted to identify how the SES of the area where the construction site is located influences CDW management. In general, the higher the SES, the better is the management of CDW. However, storage occurs mostly on the ground, regardless of SES; this was true in 78% of the cases in category D. Furthermore, neither dumpsters nor other containers are used. According to SES, segregation behaviour varies progressively. Thus, the higher the SES, the greater is the percentage of construction sites reporting that they segregate and reclaim waste, and this value increases to 72% and 93% in categories A and B, respectively. Further, for the reasons for CDW generation, the lower the SES, the greater is the responsibility associated with design processes (A,B: 59%, C: 66%, and D: 71%) and the lesser is the responsibility associated with construction work. Finally, in terms of disposal, the lower the SES, the less formal are the disposal methods. Further, the most frequent disposal locations for all SES levels are the peripheral areas of the city. However, this is particularly significant for the lowest SES categories (60%).
Current Construction stage
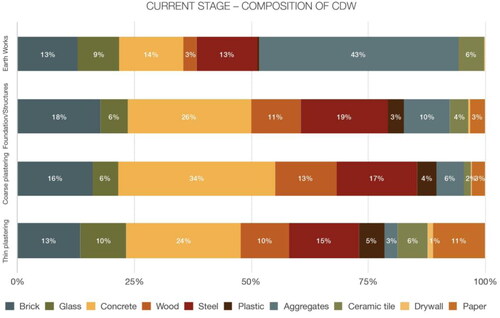
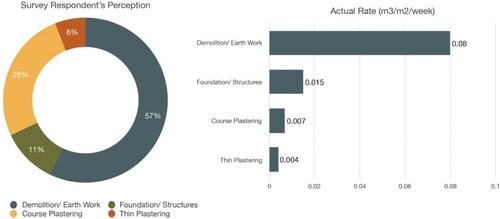
This analysis explains how each construction stage earth work, foundation, structures, and coarse and thin plastering influences CDW storage, segregation, or composition. Based on the respondents’ answers, construction stages do not entail representative changes for storage and segregation. However, there is a slight trend toward storing less waste on the ground and using other storage means as the construction moves forward. As for waste generation, the more advanced the construction work, the lower is the CDW generation rate. Thus, the following generation rates were obtained: earth workFootnote8 (0.08 m3/m2/week), foundation (0.015 m3/m2/week), coarse plastering (0.007 m3/m2/week), and thin plastering (0.004 m3/m2/week). Finally, in terms of composition, there are certain trends depending on the materials used and construction stages. The use of certain materials tends to reduce as the construction progresses (e.g. brick and aggregates); while that of others tends to increase (e.g. glass, drywall, paper, and plastic); others peak at intermediate stages and then reduce (e.g. concrete, wood, and steel) ().
Figure 8. Construction stages and composition percentage according to used materials.
Construction size
The effect of construction size (built square meter) on CDW management was assessed, and a few trends were observed. For example, the greater the size of the construction work, the greater is the amount of waste generated during the coarse plastering stage and the lower is the amount of waste generated during the foundation and structure stages. There is a direct relation between construction size and the waste generated during the demolition stage, whereas the opposite is applicable during the earth work stage. Further, the larger the construction work, the lower are the waste generation sources related to design and the greater are the number of waste generation source related to construction. For example, the strategy of not changing the design is used less frequently, probably because large construction sites involve better planning. The review of storage shows that construction involving 1000–5000 and over 5000 m2 store waste in a similar manner. However, in sites involving less than 500 m2, storage on the ground is particularly representative (74%). As for disposal, the fewer square metres the construction has, the less formal is its disposal process. Thus, only individual dump truck drivers are engaged for small construction.
Planned use
The effect of the buildings’ planned use (e.g. homes, stores, offices, and other projects) on CDW generation was assessed. Environmental impact assessments were conducted for construction projects involving homes (87%), stores (61%), offices (57%), and other projects (39%). With regard to their rate of waste generation (m3/m2/week), housing projects were the highest (0.025), followed by other projects (0.021), stores (0.019), and offices (0.007), probably because these types of building are currently being constructed under certification standards (such as LEED certification). No significant composition pattern was observed, except for a greater amount of drywall in commercial buildings. Better storage was found in commercial building projects (i.e. 31% on the ground, 44% in cylinders, 15% in dumpsters, and 10% in ecological boxes). However, although storage on the ground is performed in 61% of the cases, housing project respondents assert that they perform the greatest proportion of segregation (69%) because of the lack of space. For all planned uses, disposal is mainly performed in informal dump trucks, particularly in the case of housing projects (57%). Regardless of the type of use, there is willingness to segregate the waste (for environmental reasons or the company’s image). However, main obstacles are related to the increase in construction costs.
Environmental management instrument (EMI)
The performance of construction sites claiming that they have an EMI was compared with those that do not have one. It was found that construction where this instrument was in place had better storage (i.e. used the ground 25% less and used more dumpsters), greater segregation (i.e. 75% vs. 22%), better disposal (i.e. increased use of EO-RS: 41.5% vs. 12.3%), and finally, a greater percentage knew the disposal site compared with those constructions that do not have any EMI (42.8% vs 36.6%). Furthermore, construction sites that have an EMI in place were asked about the influence of stakeholders, and it was found that municipalities are highly influential; however, the influence of ministries was average. However, the Ministry of Housing, Construction and Sanitation is responsible for supervising CDW issues, and it should be highly influential.
Stage of greatest CDW generation
Waste generation as perceived by survey respondents was contrasted with the waste generation rate by each stage of construction, which was obtained based on the number of trucks with waste that exit the construction site. There is a perception that the coarse plastering stage generates more waste than the foundation and structure stage. However, upon verifying the waste generation rates obtained from information about trucks per week, the more advanced the construction is, the less waste it generates ().
Figure 9. Stage of greatest generation: perceived vs. actual generation.
Reclamation
In construction sites that reclaim waste, storage is not performed properly (60% on the ground), whereas constructions that do not reclaim waste store it in cylinders. A good storage method does not necessarily imply waste reuse and vice versa.
Disposal
Of the companies that said they are aware of the disposal site, 35% use dump trucks, 61% use their own vehicles, and 43% use vehicles authorized by the Ministry of Environment. However, the disposal site is informal (i.e. quarries and other places) for 71% of dump trucks, 100% of own vehicles, and 76% of EO-RS.
Discussion
An effective waste management strategy should involve combining complementary instruments such as the legislature, economic incentives, and educational tools (Gálvez-Martos et al. Citation2018). In terms of legislation, the first step is to eliminate the legal gap and to regulate the responsibility transfer from contractor to demolition or transport company. The CDW management should be centralized, and laws should be clear and must address all CDW generated regardless of the quantity or type, and the construction size or type. Clear laws will reduce CDW generation in the urban areas (Lu and Tam Citation2013). For economic incentives, there is an opportunity to enact laws based on the principle that whoever causes pollution must pay (Morlok et al. Citation2017), which follows ideas such as the closed-loop or circular economy, which should be implemented at the macro-economic level (Górecki et al. Citation2019) or protocols such as ‘cradle to cradle.’ These instruments can ensure good reception because most construction companies seek to manage waste efficiently; there are several new businesses and projections of growth in construction, and the public is very interested in environmental issues. Finally, in terms of education, both technicians and professionals should be instructed; however, they should pay special attention to low-income districts for supervision and instruction. Local governments should organize workshops and incentives for foremen and construction workers. Around 4 out of 5 construction sites need to implement a waste reduction plan, and therefore, it would be very valuable to establish guidelines for its implementation as part of an educational program and legislation.
Demolition is perceived as a significant generator of CDW; however, it is usually not considered part of the construction of a new building; this is perhaps because it is a process carried out under different building permits. The responsibility for demolition waste is transferred from the building contractor to a demolition or transportation company; hence, regulations should pay especial attention to the legal liability between them. Some recommendations to reduce demolition impact are to provide incentives for selective demolition and valorisation; evidence proper waste management as a condition to obtain the building permit, ensure a valorisation chain from the source to the recycling plant, and if the contractor hires a demolition company, it should be issued a certification of correct waste management, before providing the permit.
To separate CDW effectively, segregation should be implemented during demolition (site) and after demolition (on recycling/transfer plants) (Fukuda and Ojima Citation2002). Implementing transfer plants and debris dumps can contribute to simplifying supervision by centralizing control points. However, the availability of plots to locate transfer plants is limited in high-income districts, which are more consolidated, thereby generating a contradiction that these districts generate the greatest volume of CDW, which is transferred to low-income districts, which generate less CDW but have empty plots or fewer resources for inspection and control. It is necessary to identify plots for transfer and valorisation plants and larger land pieces for debris dumps at metropolitan and district levels. In case no plots are located, especially on central districts, mechanisms for CDW transfer between districts should be evaluated, including social, economic, and environmental alliances between districts based on the different areas in Lima (i.e. north, south, east, and downtown) or by creating macro districts for CDW management.
For control over CDW management in construction sites by both contractors and authorities in line with the idea of simplifying the oversight process, it is recommended that segregation should occur outside the construction site; therefore, the three main obstacles to proper segregation (costs, time, and large area) are solved. It is necessary to devise a system to set a condition for obtaining the construction site compliance report such that the contractor can provide evidence that formal EO-RS are being used and that waste valorisation and subsequent disposal are performed properly.
As stated by survey respondents, waste tends to reduce as the construction moves forward. Therefore, special attention should be paid in the initial stages of construction (demolition, coarse plastering, and structures and foundation), and inspection should be reinforced during this period. Earthwork should have a more specific legislature and control.
In Peru, as in many developing countries, valorisation applies to easily and rapidly valuable and recoverable products, such as metal or wood. For brick or concrete, there is no legislation that encourages the use of recycled concrete or an industry to recover them. Thus, further research in this field is necessary to promote the manufacturing and the use of recycled products in compliance with national standards.
Estimating CDW generation rates and coefficients is of utmost importance because of the standardization in construction. The CDW generation rate per planned use (e.g. home, store, etc.) can be extrapolated to the current informationFootnote9 on the built area to estimate the mean of waste generation. Most reviewed literature identifies the percentage that RCD represents related to the total waste generated by the society. This has not been estimated in Lima, and although this study presents an initial and general approach, it is necessary to conduct specific studies for each aspect of the CDW cycle, particularly concerning composition and quantification, where the Lau method (i.e. stockpiled, gathered, scattered or stacked) can be used.
Because of the small percentage of on-site reclamation and the high use of informal dump trucks, there is an opportunity to improve waste management with formalization by means of incentives to dump truck drivers, the creation of recycling companies, and proper CDW management by construction companies, thereby emphasizing the monetary benefits of recycling.
Finally, the implementation of a pilot system to improve CDW management is most feasible in Lima because it has the greatest concentration of economic activity and political force in Peru. Thus, the problem becomes visible and awareness can be raised locally and across the country. The enhanced management of CDW improves certain environmental aspects and the quality of life of the community and therefore becomes a source of financial income for peripheral districts and low-income people. Theus, the study of CDW management and the implementation of steps in this respect are relevant and necessary.
Conclusions
This article and the attached appendices present the first academic study in Peru on CDW. The obtained data and information are essential for planning and decision making related to CDW management in the LMA. The results can be extrapolated and used in similar developing country contexts.
It is essential to reinforce legislature and government control. The legislature needs to be established clearly and to promote recycling, certifications, and economic incentives because these are useful tools. For government control, this could have two main stages: In the first stage, it should focus on construction sites because waste is produced in a significant amount. It is important to include small and medium projects. In the second stage, supervision should be moved to transfer plants and debris dumps, including transportation companies. On construction sites, segregation is common; however, all efforts are nulled during informal transportation and illegal disposal.
In this sense, polluters pay principlesFootnote10 should be established clearly by the legislature and applied mainly at two scales. First, at constructors to transport and disposal companies (supervised by local governments), and second, at waste generators or polluters districts to waste recipient districts (supervised by central government). The receptor entity should clearly show that waste was managed correctly. In this scenario, collectors’ communities should prioritize implementing transfer plants and debris dumps because they have an opportunity to establish a recycling industry, thereby obtaining a double economic benefit—for receiving CDW and then selling recycled products. The central government can promote this close loop system.
Finally, it is crucial to continue research regarding the quantification and composition of CDW to exploit discarded resources and establish strategies for reuse, recycling, and appropriate spatial distribution at the metropolitan level and to define CDW as potential generators of economic and social well-being and not as an environmental polluter.
Supplemental Material
Download MS Word (159 KB)Supplemental Material
Download MS Word (5.1 MB)Acknowledgments
This research has been made possible because of the support of the Scientific Research Institute of the University of Lima (IDIC). We are grateful to the Research Interns Victor A. Llajaruna Zuzunaga and Valeria Burga-Cisneros Vega for collaboration and support in the processing of information and throughout the research.
Disclosure statement
No potential conflict of interest was reported by the authors.
Additional information
Funding
Notes
1 According to the Ministry of Environment's information, the daily amount of solid waste is over 18,000 tons (Radio Programas del Perú, Citation2016). Further, about 19,000 tons of construction debris is generated in Lima every day (Peruvian Chamber of Construction, Citation2017). Moreover, 100–150 dump trucks with the capacity to haul 20 tons of construction debris arrive at an informal garbage dump daily (León, Citation2017).
2 For construction sites generating less than 3 m3 of CDW, the regulator is the Local Government, whereas the CDW produced in sites with environmental management instruments (EMI) in place is regulated and supervised by the Ministry of Housing, Construction, and Sanitation. There is no clear policy for sites that generate more than 3 m3 of waste and that do not require an EMI. Paradoxically, most construction sites (i.e., residential, commercial, or public buildings) in Lima are within this range. Furthermore, construction companies that do not have any EMI in place are released from the obligation to adopt a CDW management plan.
3 Surveys have a margin of error of ±5%. They were developed by a team of pollsters of the University of Lima Scientific Research Institute (October–November 2018). For district selection, a multi-stage random sampling was used considering the composition of SES. For construction site selection, systematic sampling was used. This procedure guarantees an optimal level of dispersion. IBM SPSS Statistics 25 and Microsoft Excel spreadsheets were used to process the information. The research team performed quality control using consistency checking and random supervision for 30% of the samples.
4 The research team visited 28 sites in November and December 2018 to quantify CDW using SGSS method described by Lau (Citation2008). The results are part of a larger study: An Approximation to CDW Management and Composition in the Lima Metropolitan Area (IDIC, 2018).
5 Socio-economic status (SES) in Peru is linked with access to services, housing conditions, household goods and possessions, degree of education, and access to health services. It is categorized as A (high/ high-medium); B (medium); C (upper-low); D (lower-low); E (marginal). The C category is an emerging SES.
6 According to the legislation, the surveyed construction sites are exempt from EMIs. The response probably refers to the Health Safety Plan, which is related to labour rather than environmental conditions and is required by law.
7 Ecological boxes are containers handled by a solid waste operating company that has a CDW transfer plant.
8 This stage should generate inert material and not CDW. Survey respondents believed that demolition takes place at this stage.
9 From [Cámara Peruana de la Construcción, CAPECO] (Peruvian Construction Chamber, 2017).
10 This principle stipulates that the person [or company] who damages the environment must bear the cost of such damage (Luppi, Parisi, & Rajagopalan, Citation2012).
Related Research Data
References
- Abarca-Guerrero L, Maas G, Hogland W. 2013. Solid waste management challenges for cities in developing countries. Waste Manag. 33(1):220–232.
- Abdelhamid MS. 2014. Assessment of different construction and demolition waste management approaches. HBRC J. 10(3):317–326.
- Al-Khatib IA, Monou M, Zahra ASFA, Shaheen HQ, Kassinos D. 2010. Solid waste characterization, quantification and management practices in developing countries. A case study: Nablus district - Palestine. J Environ Manag. 91(5):1131–1138.
- Bergsdal H, Bohne RA, Brattebø H. 2008. Projection of construction and demolition waste in Norway. J Ind Ecol. 11(3):27–39.
- Cheng JCP, Ma LYH. 2013. A BIM-based system for demolition and renovation waste estimation and planning. Waste Manag. 33(6):1539–1551.
- Chinda T. 2016. Investigation of factors affecting a construction waste recycling decision. Civil Eng Environ Syst. 33(3):214–226.
- Fistola R. 2011. The unsustainable city. Urban entropy and social capital: The needing of a new urban planning. Procedia Eng. 21:976–984. http://www.sciencedirect.com.
- Fukuda H, Ojima T. 2002. The necessity for “Two Step Separation” to recycle construction and demolition waste. J Asian Arch Build Eng. 1(1):157–165..
- Gálvez-Martos JL, Styles D, Schoenberger H, Zeschmar-Lahl B. 2018. Construction and demolition waste best management practice in Europe. Resous Conserv Recycling. 136:166–178.
- Ghaffar SH, Burman M, Braimah N. 2020. Pathways to circular construction: An integrated management of construction and demolition waste for resource recovery. J Cleaner Prod. 244:118710.
- Górecki J, Núñez-Cacho P, Corpas-Iglesias FA, Molina V, Shukla SK. 2019. How to convince players in construction market? Strategies for effective implementation of circular economy in construction sector. Cogent Eng. 6(1):1690760.
- Katz A, Baum H. 2011. A novel methodology to estimate the evolution of construction waste in construction sites. Waste Manag. 31(2):353–358.
- Kleemann F, Lederer J, Aschenbrenner P, Rechberger H, Fellner J. 2016. A method for determining buildings’ material composition prior to demolition. Build Res Info. 44(1):51–62.
- Lau HH, Whyte A, Law PL. 2008. Composition and characteristics of construction waste generated by residential housing project. Int J Environ Res. 2(3):261–268.
- Legislative Decree No. 1278 2017. Ministerio del Ambiente. http://www.minam.gob.pe/wp-content/uploads/2017/04/Decreto-Legislativo-N%C2%B0-1278.pdf.
- León JP. 2017. En Lima se generan 19 mil toneladas de desmonte al día y el 70% va al mar o ríos from: El Comercio Perú. https://elcomercio.pe/lima/sucesos/lima-generan-19-mil-toneladas-desmonte-dia-70-mar-rios-noticia-453274-noticia/.
- Luppi B, Parisi F, Rajagopalan S. 2012. The rise and fall of the polluter-pays principle in developing countries. Int Rev Law Econ. 32(1):135–144. doi:.
- Lu W, Tam VWY. 2013. Construction waste management policies and their effectiveness in Hong Kong: A longitudinal review. Renew Sust Energy Rev. 23:214–223.
- Lu W, Webster C, Peng Y, Chen X, Zhang X. 2017. Estimating and calibrating the amount of building-related construction and demolition waste in urban China. Int J Const Manage. 17(1):13–24.
- Ministry of Environment, & Ministry of Housing, Construction and Sanitation 2016. GUÍA INFORMATIVA: Manejo de residuos de construcción y demolición en obras menores [Informative Guide: Waste management construction and demolition in minor works]. http://redrrss.minam.gob.pe/material/20160622094218.pdf.
- Ministry of Housing, Construction and Sanitation 2016. Decreto Supremo N° 019. El Peruano. http://busquedas.elperuano.pe/normaslegales/aprueban-reglamento-para-la-gestion-y-manejo-de-los-residuos-decreto-supremo-n-003-2013-vivienda-899557-2/.
- Ministry of Housing, Construction and Sanitation 2017. Yearly statement of solid waste management for construction and demolition activities. http://nike.vivienda.gob.pe/SICA/modulos/rrss.aspx.
- Morlok J, Schoenberger H, Styles D, Galvez-Martos J-L, Zeschmar-Lahl B. 2017. The Impact of Pay-As-You-Throw Schemes on Municipal Solid Waste Management: The Exemplar Case of the County of Aschaffenburg, Germany. Resources. 6(1):8.
- National Statistics and Information Technology Institute (INEI). 2016. Planos estratificados de Lima metropolitana a nivel de manzana. https://www.inei.gob.pe/media/MenuRecursivo/publicaciones_digitales/Est/Lib1403/libro.pdf.
- Ola-Adisa SO. (Diciembre de 2015. An Architectural Approach to Solid Waste Management on Selected Building Construction Sites in Bauchi Metropolis. Int J Emerging Eng Res Technol. 3(12):67–77.
- Osmani M, Glass J, Price A. 2008. Architects’ perspectives on construction waste reduction by design. Waste Manage. 28(7):1147–1158.
- Pacheco C, Fuentes L, Sánchez E, Rondón H. 2017. Residuos de construcción & demolición (RCD), una perspectiva de aprovechamiento para la ciudad de Barranquilla desde su modelo de gestión [Construction demolition waste (CDW), a perspective of achievement for the city of Barranquilla since its management model]. Ingeniería y Desarrollo. 35(2):533–555.
- Peruvian Chamber of Construction. 2017. El mercado de edificaciones urbanas en Lima Metropolitana y el Callao, 22ʻ estudio. CAPECO.
- Poon CS. 1997. Management and recycling of demolition waste in Hong Kong. Waste Manag Res. 15(6):561–572.
- Poon CS, Yu ATW, See SC, Cheung E. 2004. Minimizing demolition wastes in Hong Kong public housing projects. Const Manag Eco. 22(8):799–805.
- Radio Programas del Perú. 2016. Cada día se generan más de 18 mil toneladas de residuos sólidos en el Perú. https://rpp.pe/lima/actualidad/cada-dia-se-generan-mas-de-18-mil-toneladas-de-residuos-solidos-en-el-peru-noticia-995798?ref=rpp.
- Rodríguez-Robles D, García-González J, Juan-Valdés A, Morán-Del Pozo JM, Guerra-Romero MI. 2015. Overview regarding construction and demolition waste in Spain. Environ Technol. 36(23):3060–3070.
- Solís-Guzmán J, Marrero M, Montes-Delgado MV, Ramírez-de-Arellano A. 2009. A Spanish model for quantification and management of construction waste. e Waste Manag. 29(9):2542–2548.
- Tam V. 2008. On the effectiveness in implementing a waste-management-plan. Waste Manag. 28(6):1072–1080.
- Umar UA, Shafiq N, Ahmad FA. 2020. A case study on the effective implementation of the reuse and recycling of construction & demolition waste management practices in Malaysia. Ain Shams Eng J. DOI: 10.1016/j.asej.2020.07.005.
- Wahi N, Joseph C, Tawie R, Ikau R. 2016. Critical Review on Construction Waste Control Practices: Legislative and Waste Management Perspective. Procedia Soc Behav Sci. 224:276–283.
- Wang JY, Touran A, Christoforou C, Fadlalla H. 2004. A systems analysis tool for construction and demolition wastes management. Waste Manag. 24(10):989–997.
- Wu Z, Yu AT, Shen L, Liu G. 2014. Quantifying construction and demolition waste: An analytical review. Waste Manag. 34(9):1683–1692.
- Yuan H. 2013. A SWOT analysis of successful construction waste management. J Cleaner Prod. 39:1–8.