
 ?Mathematical formulae have been encoded as MathML and are displayed in this HTML version using MathJax in order to improve their display. Uncheck the box to turn MathJax off. This feature requires Javascript. Click on a formula to zoom.
Abstract
Construction projects are associated with construction and demolition waste (CDW) generated at different stages. In Egypt's case, the CDW problem has become a significant challenge, anad the need to find sustainable solutions is overwhelming. Based on recent investigations in the literature, it was found that six main factors are affecting CDW reduction (CDWR) as follows: (1) waste-efficient materials procurement measures; (2) waste-efficient materials procurement models; (3) green materials procurement approach; (4) legislation; (5) culture & behaviour; and (6) awareness. In this study, a representative sample of Egyptian construction firms was screened to (1) investigate the applicability and effectiveness of CDWR factors in the Egyptian construction sector; and (2) examine the relationship between these factors and CDWR. The results revealed that (1) among different factors, ‘correct materials purchase’ is the most applied item while ‘reducing overall material use by using prefabricated elements and highly durable materials’ is the most effective item; and (2) there are statistically significant positive relationships between CDWR and different factors except ‘legislation’. The results demonstrate the necessity of developing a conceptuweal framework, as a next research initiative, consisting of these different factors for CDWR in Egypt.
Introduction
The construction industry is one of the most significant industries contributing to countries' social and economic development. It provides the community with high living standards by providing society with socio-economic projects and infrastructure facilities such as roads, hospitals, and schools. Unfortunately, construction and demolition waste (CDW) is a growing challenge that the whole globe faces (Hussin et al. Citation2013). According to the latest report published by the World Bank in 2012, it is expected that the amount of solid waste (SW) generated worldwide will increase from 1.3 billion tonnes to 2.2 billion tonnes by 2025 (Hoornweg and Bhada-Tata Citation2012). CDW constitutes about half of the annual generated SW worldwide (Yılmaz and Bakış Citation2015; Redling Citation2018). A report published by Transparency Market Research in 2017 claims that there will be a tremendous increase in the volume of the CDW generated over the coming years (Redling Citation2018). Unfortunately, the dumping of CDW is a common global trend that negatively affects society and the environment (Slowey Citation2018). In the Middle East and North Africa (MENA) region, including Egypt, dumping is the dominant practice of dealing with CDW. This action has led to the SW problem's escalation, resulting in severe negative impacts on society, environment, and economy, which are the triple bottom line (TBL) of sustainability (Abdelhamid Citation2014; Aden Citation2017; El-Sherbiny et al. Citation2011; Nassour et al. Citation2016; United Nations Environment Programme (UNEP)), Citation2009; Zafar Citation2016). Accordingly, proper actions and strict measures need to be taken to alleviate the MENA region's CDW problem.
Waste in construction materials represents a severe problem for the Egyptian construction industry (Garas et al. Citation2001). In Egypt, up to 40% of total construction materials cost is wasted, and this is equivalent to 16% of total building cost (i.e. labour and materials cost). It is worth mentioning that the waste in total materials cost must not exceed 4% under any circumstances (Shamseldin Citation2003). CDW is dumped on roads and in facilities that lack effective management. Most of the dumping sites are unsafe and marked by the non-existence of sufficient precautions to prevent the self-ignition of waste, leading to environmental pollution (Abdelhamid Citation2014; Azmy and El Gohary Citation2017). The biodegradation of CDW in landfills results in severe health and environmental problems (Azmy and El Gohary Citation2017; Mahamid Citation2020). Also, CDW negatively impacts the efficiency, effectiveness, value, and profitability of construction companies. CDW severely harms countries’ economies and the TBL of sustainability (Memon et al. Citation2015; Park and Tucker Citation2017; Jalaei et al. Citation2021). Caldas et al. (Citation2014) claimed that construction materials and equipment constitute between 50 and 60% of total project cost and affect 80% of its schedule.
Based on several investigations carried out by Daoud et al. (Citation2018a), Daoud et al. (Citation2018b), Daoud et al. (Citation2020a), and Daoud et al. (Citation2020b) about solving the CDW problem in Egypt, several factors affecting CDW reduction (CDWR) were compiled, which helped build the theoretical framework presented in this study. This framework depends mainly on six main factors, consisting of several items, as follows: (1) waste-efficient materials procurement measures; (2) waste-efficient materials procurement models; (3) green materials procurement approach of green building (GB) practices; (4) legislation; (5) culture & behaviour measures; and (6) awareness measures. All these factors are considered independent variables (IDVs), affecting CDWR as a dependent variable (DV). In this study, the main aim is to understand and investigate the causes of a phenomenon (i.e. CDWR). In a cause-effect relationship, the presumed cause is called ‘IDV’, and the presumed effect is called ‘DV’ (Flannelly et al. Citation2014). In other words, an IDV is a variable that is assumed to affect another variable (i.e. DV). A DV is a variable that depends on IDVs. Researchers are usually interested in understanding and predicting the DV and how it is affected by IDVs (Flannelly et al. Citation2014). Each IDV and the DV, which are named constructs, are represented and measured by indicators or items. These indicators were extracted based on extensive investigations as aforementioned. It is worth mentioning that all indicators measuring the same factor are assumed to have equal weights and independent of each other. For straightforward representation of the theoretical framework, each indicator (i.e. item) is given an initial code used later in the data analysis. The IDVs, DV, relevant items, and corresponding codes are tabulated in , and the theoretical framework is shown in .
Figure 1. The theoretical framework of the study.
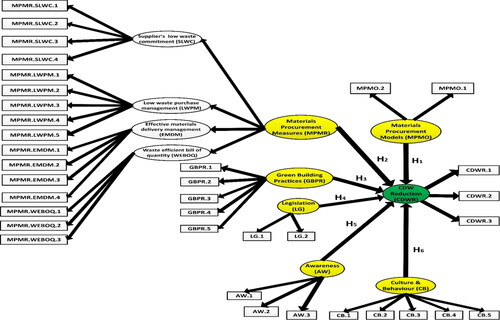
Table 1. Independent and dependent variables with their relevant items and corresponding codes.
The detailed aims of this paper are to (1) determine the perceptions and attitudes towards the CDW problem in Egypt; (2) rank the different IDVs based on their effectiveness and applicability in the Egyptian construction sector; and (3) examine the relationships (i.e. bivariate cowerrelations) between the different IDVs and the DV. This paper starts by discussing the research methodology adopted to achieve the different aforementioned aims. Then, the data analysis and results are presented in detail to demonstrate the outcomes of investigating the paper's aforementioned aims. Finally, conclusions and recommendations for future research are presented.
Research methodology
The research methodology, designed to achieve the abovementioned aims, adopts a ‘survey’ research strategy. The survey strategy is helpful when the researcher tries to investigate both following aspects: (1) attitudes, opinions, and organisational practices; and (2) relationships between different variables, mainly cause-effect relationships (Saunders et al. Citation2016). It helps collect data from a sufficient sample size to allow generalisation of the findings. The research methodology consists of several steps, as discussed in the following subsections.
Design of the survey questionnaire
The survey questionnaire was divided into five sections main sections. Section one investigates demographic information of the respondents and their firms. Also, it investigates the CDW problem in Egypt and its current status. Section two evaluates: (1) the current applicability of materials procurement models and measures and green building practices within the Egyptian construction industry; and (2) their effectiveness towards CDWR. Section three evaluates the applicability of Egyptian CDWM legislation and their effectiveness towards CDWR. Section four evaluates the applicability of awareness and culture & behaviour measures in Egypt and their effectiveness towards CDWR. In other words, the first four sections evaluate the factors affecting CDWR in terms of current applicability and effectiveness in reaching the goal of CDWR. Finally, section five evaluates the agreement on the expected improvement of different project dimensions (i.e. cost, time, and quality) via CDWR. In other words, the last section (i.e. section five) evaluates the expected outcomes or goals of CDWR, which would result from the effectiveness of the factors behind it.
All the questions used in the survey questionnaire are close-ended. Three types of five-points Likert scales were developed, based on studies of Vagias (Citation2006) and Brown (Citation2010), to answer the sections mentioned above. First, the ‘applicability’ Likert scale was used to assess the current degree of applicability of different factors contributing to CDWR in the Egyptian construction industry as defined by the literature and investigated in the theoretical framework. In this scale, ‘1’ means ‘not applicable at all’, and ‘5’ means ‘extremely applicable’. Second, ‘effectiveness’ Likert scale was used to assess the degree of effectiveness of these different factors towards CDWR, in which ‘1’ means ‘not effective at all’ and ‘5’ means ‘extremely effective’. Finally, ‘agreement’ Likert scale was used to assess the degree of agreement on the expected outcomes of CDWR towards project dimensions’ improvement. In this scale, ‘1’ means ‘strongly disagree’, and ‘5’ means ‘strongly agree’. Before proceeding to next steps, the designed interview questionnaire was submitted for review by ‘Built Environment and Architecture Ethics Panel’ at London South Bank University (LSBU). The ethics application, with ID ETH1819-0067, was approved until 16th of May 2023.
Pilot testing
An initial pilot study was carried out to assess the survey questionnaire's comprehensiveness, clarity and feasibility (Ruel et al. Citation2018). The recommended minimum sample size for pilot testing is 10 participants (Saunders et al. Citation2016). The sample included in this pilot test consisted of 30 participants as shown in , of which 15 participants are industry professionals, and the other 15 participants are academics with more than ten years’ experience of industrial work and teaching & research, respectively. Face and content validation were achieved through piloting with the experts mentioned above. Feedback was received from the selected experts, and the survey questionnaire was modified accordingly. The average time taken to complete the questionnaire was approximately 45–60 min from the respondents' feedback. There was a consensus among the selected experts that the survey questionnaire should be designed in Arabic and English. This is due to the complexity of some used terminologies and concepts and that the English language is not the first language in Egypt. Accordingly, this recommendation was taken into consideration. The survey questions were translated, and the survey questionnaire was redesigned to include Arabic and English questions.
Table 2. Profiles of the participants in the pilot study.
As the survey questionnaire was going to be distributed among a large sample size, as discussed later in this paper, it is difficult to repeat the process to get a second round of responses. Accordingly, the internal consistency and reliability of the survey questionnaire were checked before conducting the actual study. It was essential to ensure that the expected responses will be consistent and the used measurement tools (i.e. Likert scales) are reliable before actual data collection (Daoud et al. Citation2017). Through the pilot testing of the survey questionnaire, Cronbach’s alpha was calculated for the different variables included in the questionnaire using SPSS V26© software to check consistency and reliability. All the values exceeded the threshold value of 0.7, as stated by George and Mallery (George and Mallery Citation2003).
Sample size – targeted participants
The Egyptian Federation for Construction and Building Contractors (EFCBC) currently includes 28,000 construction companies as active members (Sada Elbalad Citation2018). These firms are classified into seven grades based on eight main criteria as follows: (1) invested financial capital; (2) contractor’s years of experience; (3) number of technical staff; (4) financial structure; (5) administrative and legal structure; (6) the highest value of the work carried out during the last five years; (7) the value of the largest operation completed during the five years before the submission of the upgrade application; and (8) the upper limit of the allowable value of the tender (El Ehwany Citation2009; Egyptian Federation for Construction and Building Contractors (EFCBC Citation2017). Grades one, two, and three are considered ‘large firms’, grades four and five are considered ‘medium firms’, and grades six and seven are considered ‘small firms’ (El Ehwany Citation2009). According to El Ehwany (El Ehwany Citation2009), more than 80% of the registered firms belong to the sixth and seventh grades. This statistic means that most Egyptian construction firms are small-sized ones that carry out small-scale and simple construction activities and depend mainly on the workforce more than advanced construction techniques.
In this study, the population considered for sample size calculation was the construction firms registered at EFCBC and located in Greater Cairo (GC). GC was chosen as the central area of investigation for this study for the following reasons: (1) it includes all similarities and contradictions; (2) diversity in levels of education; (3) large number of construction projects; (4) it is political, financial, commercial, and administrative governance; and (5) it includes more than 60% of Egypt’s CDW (Hany and Dulaimi Citation2014). According to the data provided by EFCBC (Egyptian Federation for Construction and Building Contractors (EFCBC Citation2019), it was indicated that GC includes 1400 construction firms with different grades, as summarised in .
Table 3. Number of different construction firms in Greater Cairo.
First, the representative sample size was calculated from the total population (i.e. 1400 construction firms) in GC using a sample size calculator provided by SurveyMonkey©. This calculator needs three inputs to calculate the sample size as follows: (1) population; (2) confidence level %; and (3) margin of error (i.e. confidence interval) %. The margin of error is a percentage that indicates how much higher or lower it can be expected that the survey results (i.e. sample mean) compared to the actual views (i.e. mean) of the population. The confidence level is a percentage that represents how confident the researcher can be that the population would choose an answer within the confidence interval (Smith Citation2013). Based on a study carried out by Conroy (Citation2006), 95% is the most recommended confidence level in survey research. Also, it was recommended to adopt a confidence interval between 5% and 10%. Accordingly, this research adopted a confidence level of 95% and a confidence interval of 7.5%, leading to a sample size equal to 153 firms approximately.
Second, stratified random sampling was done for the seven grades to determine the number of companies to be chosen from each category of the total sample size (i.e. 153 firms). The main advantages of stratified sampling are as follows: (1) decreasing the occurrence of bias in the selection of cases to be involved in the sample, and this means that the sample will be highly representative to the population under investigation; (2) permitting the generalisation (i.e. statistical inferences) from the sample to the population because the cases chosen to be involved in the sample are selected based on probabilistic methods, and this is a tremendous advantage as such generalisation seems to have external validity; and (3) ensuring the involvement of sufficient sample points to help in a separate analysis of any strata (Sharma Citation2017; Stat Trek Citation2018). EquationEquation 1(1)
(1) calculates the sample size for each stratum (i.e. grade) as follows:
(1)
(1)
The stratified sample size for each stratum is summarised in . Finally, simple random sampling was done using random numbers using Microsoft Excel 2016© software to randomly choose the number of companies from each grade resulting from the stratified sampling.
Table 4. Stratified sampling of construction firms in Greater Cairo.
Results ànd discussions
The quantitative analysis of the collected responses from the survey questionnaire was carried out using descriptive and inferential statistical analysis via SPSS V26© software. Descriptive statistics (e.g. mean, frequency, standard deviation, cross-tabulation, and relative importance index (RII)) is useful in describing, summarising, and visualising collected data in numerical and graphical formats to show different patterns coming out from the data (Sutanapong and Louangrath Citation2015). It helps understand the data's nature in a meaningful way with simple interpretations before proceeding to statistical modelling using multivariate techniques. Descriptive statistics were used to determine respondents' demographic information, the perspectives towards the CDW problem in Egypt, and ranking the different factors affecting CDWR based on their applicability and effectiveness. RII analysis was carried out using Microsoft Excel 2016© software to develop an excel sheet, including the formula of RII, to rank the different factors.
On the other hand, inferential statistics (e.g. correlation analysis) help make predictions or inferences from the collected data, which helps reach conclusions about the relationships between different separated variables from the collectweed data and generalising them to general conditions (Sutanapong and Louangrath Citation2015). Bivariate correlation analysis was carried out tweo examine the relationships between the different factors (i.e. IDVs) and CDWR (i.e. DV). This step is a matter of checking the significance of the cause-effect relationship between each IDV and DV without being affected by any other surrounding variable (i.e. IDV).
Demographic information
This sub-section presents the demographics of respondents. The respondents have different years of work experiences ranging between ‘0 to 5 years’ and ‘more than 20 years’. Most of the respondents, about 77% of respondents, have experiences of ‘0 to 5 years’ and ‘5 to 10 years’. This may indicate that younger generations are more ambitious and curious about solving the CDW problem in the Egyptian construction industry. Regarding the department at which the respondent is working; 53% of respondents were in the project management department, 16% of respondents were in the procurement management department, and 31% of respondents were in other departments such as the technical office, contracts department, QA/QC department, and operations department. Regarding the highest degree or level of education the respondent had completed; 57% of respondents had a bachelor's degree, 8% of respondents had a postgraduate diploma, 24% of respondents had a master's degree, and 11% of respondents had a doctorate. This indicates that a high percentage of the respondents, about 43% of respondents, are highly educated and holders of postgraduate diploma, master’s degree, and a doctorate in civil and architectural engineering.
General perceptions and attitudes towards CDW problem in Egypt
The participants answered a specific question which is ‘to what extent do you agree that efficient practices, legislation, culture & behaviour and awareness positively affect CDW minimisation?’. 48% of respondents chose ‘agree’, while 52% of respondents chose ‘strongly agree’. This result demonstrates the initial consensus on the hypothesised theory that efficient practices, legislation, culture & behaviour, and awareness can reduce CDW in Egypt.
Also, the participants were asked ‘to what extent do you agree that the Egyptian construction industry needs a framework for improving current practices, legislation, culture & behaviour, and awareness in order to minimise CDW?’. 57% of respondents chose ‘agree’, while 43% of respondents chose ‘strongly agree’. This demonstrates that the research motive and objectives are on the right track given the full consensus on the necessity of developing a framework to improve the current practices, legislation, culture & behaviour, and awareness for reducing CDW in Egypt.
Moreover, the participants were asked ‘how often do the procurement management and/or project management departments in your firm tend to reduce CDW during projects execution?’. 11% of respondents chose ‘never’, 21% of respondents chose ‘rarely’, 38% of respondents chose ‘sometimes’, and 31% of respondents chose ‘often’. This result demonstrates that about 70% of the respondents’ firms do not pay careful attention to CDWR given the lack of efficient practices, legislation, culture & behaviour, and awareness in Egypt.
Applicability and effectiveness of different factors affecting CDWR
In this subsection, descriptive statistical analysis is carried out to determine the mean of responses towards evaluating the items (i.e. indicators) of different factors (i.e. IDVs) contributing to CDWR. These items were evaluated on five-point Likert scales based on their current level of applicability in the Egyptian construction sector and their level of effectiveness in solving the CDW problem in Egypt according to respondents’ perspectives. Accordingly, these items were accorded two evaluation codes in which a code is used to represent the evaluation of the item based on its applicability level (e.g. MPMO.AP.1), and the other code is used to represent the evaluation of the item based on its effectiveness level (e.g. MPMO.EF.1). First, mean and standard deviation were calculated for the applicability and effectiveness levels of the different items. Second, the RII was calculated to rank and rearrange the different items under investigation (Holt Citation2014).
Items were ranked once based on their applicability levels and another time based on their effectiveness levels. For instance, Enshassi and Saleh (Citation2019) used RII for ranking different lean construction techniques used in reducing accidents in construction projects based on their applicability levels. Also, Mendis et al. (Citation2017) used RII for ranking different associated practices of a safe working cycle (SWC) in the Sri Lankan construction industry based on their applicability levels. On the other hand, Othman et al. (Citation2005) used RII for ranking different factors that drive brief development in the construction industry based on their influence (i.e. effectiveness) levels. RII is calculated using EquationEquation 2(2)
(2) as early investigated by Olomolaiye et al. (Citation1987) and Shash (Citation1993):
(2)
(2)
Where ‘W’ represents the weights accorded to each item based on its applicability or effectiveness. It ranges from 1 to 5, where 1 = not applied at all or not effective at all, and 5 = extremely applied or extremely effective. ‘A represents the highest weight in the rating scales (i.e. five in this study). ‘N’ represents the total number of engaged respondents (Kometa and Olomolaiye Citation1997). RII value ranges from zero to one. In this study, high RII values indicate that some items are more applicable or more effective than those with relatively lower RIIs. According to Chen et al. (Citation2010), the ranking importance levels resulting from the RII analysis are derived as investigated in as follows:
Table 5. Importance levels.
The results of RII are reported in , along with the corresponding ranking and their importance level based on the items’ applicability levels. It is obvious from the ranking table that most of the items (i.e. 25 items) were identified with ‘Medium’ and ‘Medium-Low’ importance levels, while the rest of the items (i.e. eight items) were identified with ‘High’ and ‘High-Medium’ importance levels. This indicates that most of the items are not efficiently applied in the Egyptian construction sector and that the Egyptian construction firms are reluctant towards CDWR. These items of ‘Medium’ and ‘Medium-Low’ importance levels have RIIs range of 0.597–0.293. The items of ‘High’ and ‘High-Medium’ importance levels have RIIs range of 0.911–0.602. Overall, the most applied item among different factors is ‘MPMR.LWPM.AP.5’ (i.e. correct materials purchase), and the least applied item among different factors is ‘LG.AP.2’ (i.e. Article 39 of the Egyptian Environment Law 4/1994 and Article 41 of the executive regulations for the Egyptian Environment Law 4/1994).
Table 6. Descriptive statistics and ranking of different items based on applicability levels.
On the other hand, the results of RII are reported in , along with the corresponding ranking and their importance level based on the items’ effectiveness levels. It is obvious from the ranking table that all the items were identified with ‘High’ importance levels, except only one item (i.e. MPMO.EF.1), which was identified with a ‘High-Medium’ importance level. This indicates that almost all items are considered of prime effectiveness for reducing CDW generation even though being not efficiently applied in Egypt. These items of ‘High’ importance levels have RIIs in the range of 0.961–0.811. The item of ‘High-Medium’ importance level has an RII of 0.798. Overall, the most effective item among different factors is ‘GBPR.EF.3’ (i.e. reducing overall material use by using prefabricated elements and highly durable materials), and the least effective item among different factors is ‘MPMO.EF.1’ (i.e. SCPM).
Table 7. Descriptive statistics and ranking of different items based on effectiveness levels.
Examination of relationships – bivariate correlation between independent and dependent variables
In this subsection, the relationships between IDVs and DV are investigated through correlation analysis. An examination of the effect of each IDV on the DV was carried out to indicate what are the strongest and weakest variables' associations as a matter of checking the internal validity of the cause-effect proposed model (Mitchell Citation1985). Internal validity check helps determine the degree of confidence that the investigated model's cause-effect relationships are trustworthy and not affected by any other surrounding variables. In this correlation analysis, IDVs are represented by the level of effectiveness, while DV is represented by the level of agreement on reaching targeted outcomes of CDWR. The Pearson product-moment correlation coefficient () was calculated to determine the strength of the relationships and the effect of each IDV on the DV (Zhang et al. Citation2019). Pearson correlation gives an indication of both directions (i.e. positive or negative) and the strength of a relationship (i.e. weak, moderate, strong) between two variables (Field Citation2009). A positive correlation means that if one variable increases, then the other variable will also increase, while a negative correlation means that if one variable increases, the other variable will decrease (Norusis Citation2004; Pallant Citation2010).
The values of range from −1 (i.e. perfect negative correlation) to +1 (i.e. perfect positive correlation). Accordingly, the following values of
determine the strength of the relationship between the variables: 0.00 means no linear relationship; 0.01–0.30 means a weak relationship; 0.31–0.70 means a moderate relationship; 0.71–1.00 means a strong relationship; and 1.00 means a perfect linear relationship (Ratner Citation2009). Values of
were used to examine the association of CDWR with MPMO, MPMR, GBPR, LG, AW, and CB. The values of
were reported altogether with significance level values (i.e.
-values) to determine whether a relationship is significant or not. Suppose P-value is below 5% (i.e. 0.05). In that case, this means that there is sufficient evidence to reject the null hypothesis H0 (i.e. there is no relationship existing between the IDV and DV) in favour of the alternative hypothesis Hn (i.e. there is a positive linear relationship existing between the IDV and DV).
shows the correlation analysis results (i.e. and
values) and descriptive statistics (i.e. mean and standard deviation) of the IDVs and DV. It shows a matrix of
(i.e. first row) and
(i.e. second row) values corresponding to each variable. The
and
values demonstrate significant positive relationships among the DV and IDVs except ‘LG’. There is a statistically significant moderate positive relationship between MPMO and CDWR, in which
(244) = 0.533 and
< 0.001. Also, there is a statistically significant moderate positive relationship between MPMR and CDWR, in which
(244) = 0.452 and
< 0.001. Moreover, there is a statistically significant moderate positive relationship between GBPR and CDWR, in which
(244) = 0.509 and
< 0.001. Additionally, there is a statistically significant moderate positive relationship between AW and CDWR, in which
(244) = 0.566 and
< 0.001. Furthermore, there is a statistically significant moderate positive relationship between CB and CDWR, in which
(244) = 0.563 and
< 0.001. In contrast, there is a statistically non-significant weak positive relationship between LG and CDWR, in which
(244) = 0.086 and
= 0.183. The
-value exceeds 0.05; accordingly, there is no evidence to reject the null hypothesis H0 in favour of the alternative proposed hypothesis H4 here.
Table 8. Descriptive Statistics and Bivariate Correlations among Variables.
The non-significant relationship between ‘LG’ and ‘CDWR’ can be demonstrated by the responses of participants towards the following question: to what extent do you agree on the following statement ‘the Egyptian legislation lack effective waste minimisation strategies and they only focus on waste transfer, charge, and dumping’? 50.8% of the respondents strongly agreed and 49.2% of the respondents agreed, which shows that the Egyptian legislation are not fully effective in reducing CDWG efficiently. Egyptian legislation only focus on CDW collection, transfer, and disposal without encouraging the adoption of reduction technique or any other technique of the 4Rs techniques (Daoud et al. Citation2020b). Egyptian CDWM legislation can be better improved by including guidance for adopting waste-efficient materials procurement practices to foster CDWR and apply incentives to adopt them.
Conclusions and recommendations
CDW is one of the global challenges which threaten developed and developing nations. It contributes up to 50% of the total global annual generated SW, and it represents approximately 10% of the total cost of materials used in construction projects. In Egypt, the problem is serious, in which CDW represent up to 40% of total materials cost in construction projects. Moreover, the dominant practice of handling CDW in Egypt is illegal dumping which negatively affects society and the environment. This indicates the negative impact of CDW on sustainable development in Egypt. According to different studies, it has been found that there are different factors compiled under six main factors which may help in CDWR as follows: (1) waste-efficient materials procurement measures; (2) waste-efficient materials procurement models; (3) green materials procurement approach of green building (GB) practices; (4) legislation; (5) culture & behaviour measures; and (6) awareness measures. These factors are considered as the IDVs which affect the DV, namely ‘CDWR’.
This study provides a new contribution to knowledge through a quantitative research approach using a survey questionnaire which helped in (1) determining the perceptions and attitudes towards CDW problem in Egypt; (2) ranking the different IDVs based on their effectiveness and applicability in the Egyptian construction sector; and (3) examining the relationships between the different IDVs and the DV. Through the descriptive statistical analysis, demographic information of respondents and their firms were investigated. Given the participants’ responses, there was a consensus among the respondents that efficient practices, legislation, culture & behaviour, and awareness can help reduce CDW in Egypt. The respondents also pointed out the need to develop a framework that can integrate all these factors for reducing CDW in Egypt. Besides, the respondents agreed that Egyptian CDWM legislation are ineffective in reducing CDWG efficiently because they do not foster CDWR. Unfortunately, the responses showed that most respondents’ firms do not care for reducing CDW as they do not efficiently apply the abovementioned factors, which can greatly help CDWR.
Based on the RII formula, the different CDWR factors were ranked based on their current applicability level in the Egyptian construction sector and their level of effectiveness towards CDWR. It was found that ‘correct materials purchase’ is the most applied item among the different factors, while the most effective item among different factors is ‘reducing overall material use by using prefabricated elements and highly durable materials’. Finally, correlation analysis was carried out to investigate the cause-effect relationship between each IDV and the DV. It was found that there are significant positive relationships between the DV and all IDVs except ‘LG’. This demonstrates that Egyptian legislation are not fully effective solely in reducing CDWG. The next step of this research recommends carrying out a multivariate statistical analysis of the survey questionnaire’s responses using the structural equation modelling (SEM) technique. This is helpful to test and validate the theoretical framework of different hypotheses and different factors in a multiple system in favour of developing a conceptual framework for minimising CDW in the Egyptian construction sector.
Disclosure statement
No potential conflict of interest was reported by the authors.
References
- Abdelhamid MS. 2014. Assessment of different construction and demolition waste management approaches. HBRC J. 10(3):317–326.
- Aden A. 2017. Waste prevention in Middle East – prospects and challenges | EcoMENA. https://www.ecomena.org/waste-prevention/.
- Ajayi SO, Oyedele LO, Akinade OO, Bilal M, Alaka HA, Owolabi HA. 2017. Optimising material procurement for construction waste minimization: an exploration of success factors. Sustain Matertechnol. 11:38–46.
- Arif S, Abaza H. 2012. Towards greening the solid waste sector in the Middle East and North Africa Region.
- Azmy AM, El Gohary R. 2017. Environmental and Sustainable Guidelines for Integrated Municipal Solid Waste Management in Egypt. International Conference on Advanced Technology in Waste Water and Waste Management for Extractive Industries, October. https://www.researchgate.net/publication/320728195_Environmental_and_Sustainable_Guidelines_for_Integrated_Municipal_Solid_Waste_Management_in_Egypt.
- Brown S. 2010. Likert scale examples for surveys.
- Caldas CH, Menches CL, Reyes PM, Navarro L, Vargas DM. 2014. Materials management practices in the construction industry. Pract Period Struct Des Constr. 20(3):1–8. https://doi.org/10.1061/(ASCE)SC.1943-5576.0000238.
- Chen Y, Okudan GE, Riley DR. 2010. Sustainable performance criteria for construction method selection in concrete buildings. Autom Constr. 19(2):235–244.
- Conroy R. 2006. Sample size: a rough guide. Dublin.
- Daneshgari P, Harbin SJ. 2003. Procurement chain management in the construction industry, Mechanical contracting education and research foundation. Rockville, MD.
- Daoud AO, Othman AAE, Ebohon OJ, Bayyati A. 2020a. Overcoming the limitations of the green pyramid rating system in the Egyptian construction industry: a critical analysis. Archit Eng Des Manag. 16:1–14.
- Daoud AO, Othman AAE, Robinson H, Bayyati A. 2018a. Towards a green materials procurement: investigating the Egyptian green pyramid rating system. In Adel M, El Maghraby R, & Fathi S, editors. Green heritage international conference (chance –change –challenge). Cairo: Elain Publishing House; p. 575–591. https://www.researchgate.net/publication/323588948_Towards_a_Green_Materials_Procurement_Investigating_the_Egyptian_Green_Pyramid_Rating_System.
- Daoud AO, Othman AAE, Robinson H, Bayyati A. 2020b. An investigation into solid waste problem in the Egyptian construction industry: a mini-review. Waste Manag Res. 38(4):371–382.
- Daoud AO, Tsehayae AA, Fayek AR. 2017. A guided evaluation of the impact of research and development partnerships on university, industry, and government. Can J Civ Eng. 44(4):253–263.
- Daoud AO, Othman AA, Robinson H, Bayyati A. 2018b. Exploring the relationship between materials procurement and waste minimization in the construction industry: the case of Egypt. The 4th NZAAR International Event Series on Natural and Built Environment, Cities, Sustainability and Advanced Engineering, 76–85. https://static1.squarespace.com/static/565bcedee4b09e25856124af/t/5a6b801a0852293fdbf7ad07/1516994747704/NZAAR+Jan + 2018+Proceedings.pdf.
- Daoud, AO, Othman, AAE, Ebohon, OJ, Bayyati, A. 2021. Quantifying materials waste in the Egyptian construction industry: a critical analysis of rates and factors, Ain Shams Engineering Journal. DOI:10.1016/j.asej.2021.02.039.
- Egyptian Federation for Construction and Building Contractors (EFCBC). 2017. Registration requirements and the criteria of classification and ordering. https://tasheed.org/Admin/EditorDocs/EFCBC_Regestration&Classifications.pdf.
- Egyptian Federation for Construction and Building Contractors (EFCBC). 2019. Database of Egyptian contractors. http://www.tasheed.org/ar/Default.aspx.
- El Ehwany N. 2009. The construction and related engineering services in Egypt: challenges and policies. Cairo, Egypt.
- El-Sherbiny R, Gaber A, Riad M. 2011. 2011 Report of the Arab forum for environment and development. http://www.afedonline.org/Report2011/PDF/En/chapter7Waste.pdf.
- Enshassi A, Saleh N. 2019. Application level of lean construction techniques in reducing accidents in construction projects. J Financial Manag Prop Constr. 24(3):274–293.
- Field A. 2009. Discovering statistics using SPSS. In Advances in experimental medicine and biology. Vol. 622., 3rd ed. Thousand Oaks (CA): SAGE Publications Ltd.
- Flannelly LT, Flannelly KJ, Jankowski KRB. 2014. Independent, dependent, and other variables in healthcare and chaplaincy research. J Health Care Chaplain. 20(4):161–170.
- Garas GL, Anis AR, El Gammal A. 2001. Materials waste in the Egyptian construction industry. In Chua D, Ballard G, editors. 9th international group for lean construction conference. Singapore: National University of Singapore; p. 1–8. http://cic.vtt.fi/lean/singapore/Garasetal.pdf.
- George D, Mallery P. 2003. SPSS for Windows step by step: A simple guide and reference. 11.0 update. 4th ed. Boston (MA): Allyn & Bacon.
- Hany O, Dulaimi M. 2014. Creating a sustainable future: solutions for the construction waste in the Greater Cairo. In Okeil A, editor. The First International Conference of the CIB Middle East & North Africa Research Network (CIB-MENA 2014) (Issue December, p. 281–305. https://www.researchgate.net/publication/275646393_Creating_a_sustainable_future_Solutions_for_the_construction_waste_in_the_Greater_Cairo.
- Holt GD. 2014. Asking questions, analysing answers: relative importance revisited. Constr Innov. 14(1):2–16.
- Hoornweg D, Bhada-Tata P. 2012. What a waste: A global review of solid waste management (Issue 15). https://siteresources.worldbank.org/INTURBANDEVELOPMENT/Resources/336387-1334852610766/What_a_Waste2012_Final.pdf.
- Housing and Building National Research Center (HBRC). 2011. The green pyramid rating system – first version. (Vol. 2011, Issue May 2010).
- Housing and Building National Research Center (HBRC). 2017. The green pyramid rating system – second version. (Issue 2).
- Hussin J, Rahman IA, Memon AH. 2013. The way forward in sustainable construction: Issues and challenges. Int J Adv Appl Sci (IJAAS). 2(1):31–42. https://doi.org/10.11591/ijaas.v2i1.1321.
- Jalaei F, Zoghi M, Khoshand A. 2021. Life cycle environmental impact assessment to manage and optimize construction waste using Building Information Modeling (BIM). Int J Constr Manag. 21(8):718–784.
- Kometa ST, Olomolaiye PO. 1997. Evaluation of factors influencing construction clients’ decision to build. J Manag Eng. 13(2):77–86.
- Mahamid I. 2020. Impact of rework on material waste in building construction projects. Int J Constr Manag. 20:1–8.
- Memon NA, Akram M, Khahro SH, Nicolae P. 2015. Reduction of construction waste at site. 3rd International Conference on Energy and Environment: Innovation, Research & Sustainability 2015 (ICEE’15), February.
- Mendis NSK, Rajini PAD, Samaraweera A, Sandanayake YG. 2017. Applicability of safe working cycle (SWC) concept to Sri Lankan construction industry. In Ruddock L, Van-Dijk H, Houghton C, editors. Inernational research conference 2017: shaping tomorrow’s built environment. Salford: University of Salford; p. 151–163.
- Mitchell TR. 1985. An evaluation of the validity of correlational research conducted in organizations. Acad Manage Rev. 10(2):192–205.
- Nassour A, Elnaas A, Hemidat S, Nelles M. 2016. Development of waste management in the Arab Region. In Thomé-Kozmiensky KJ, Thiel S, editors. Waste management – waste-to-energy. Vol. 6. Munich: Universal Medien GmbH; p. 117–128. http://www.vivis.de/phocadownload/Download/2016_wm/2016_WM_117-128_Nassour.pdf.
- Norusis MJ. 2004. SPSS 13.0 advanced statistical procedures companion. Hoboken (NJ): Prentice Hall.
- Olomolaiye PO, Wahab KA, Price ADF. 1987. Problems influencing craftsmen’s productivity in Nigeria. Build Environ. 22(4):317–323.
- Othman AAE, Hassan TM, Pasquire CL. 2005. Analysis of factors that drive brief development in construction. Eng Constr Archit Manag. 12(1):69–87.
- Pallant J. 2010. SPSS survival manual. 4th ed. Maidenhead: Open University Press.
- Park J, Tucker R. 2017. Overcoming barriers to the reuse of construction waste material in Australia: a review of the literature. Int J Constr Manag. 17(3):228–237.
- Ratner B. 2009. The correlation coefficient: its valuesrange between + 1/−1, or do they? J Target Meas Anal Mark. 17(2):139–142.
- Redling A. 2018. Construction debris volume to surge in coming years. http://www.cdrecycler.com/article/global-volume-construction-demolition-waste/.
- Ruel E, Wagner WE, Gillespie BJ. 2018. Pretesting and pilot testing. In Ruel E, editor. The practice of survey research: theory and applications. Thousand Oaks (CA): SAGE Publications, Inc; p. 101–119.
- Sada Elbalad. 2018. President of EFCBC: National projects contributed in doubling the number of construction companies. http://www.elbalad.news/show.aspx?id=3114367.
- Saunders M, Lewis P, Thornhill A. 2016. Research methods for business methods. 7th ed. London: Pearson Education Limited.
- Shamseldin AK. 2003. Energy conservation in the building construction phase. Cairo: Ain Shams University.
- Sharma G. 2017. Pros and cons of different sampling techniques. Int J Appl Res. 3(7):749–752. www.allresearchjournal.com.
- Shash AA. 1993. Construction management and economics factors considered in tendering decisions by Top UK contractors. Constr Manag Econ. 11(2):111–118.
- Slowey K. 2018. Report: Global construction waste will almost double by 2025. https://www.constructiondive.com/news/report-global-construction-waste-will-almost-double-by-2025/518874/.
- Smith SM. 2013. Determining sample size: how to ensure you get the correct sample size? Provo, UT.
- Stat Trek. 2018. Stratified random sampling. https://stattrek.com/survey-research/stratified-sampling.aspx.
- Sutanapong C, Louangrath PI. 2015. Descriptive and inferential statistics. Int J Res Methodol Soc Sci. 1(1):22–35.
- United Nations Environment Programme (UNEP). 2009. Arab regional strategy for sustainable consumption and production (final draft). http://www.unep.fr/scp/marrakech/publications/pdf/FinalDraftArabStrategyonSCP–06-10-09.pdf.
- Vagias WM. 2006. Likert-type scale response anchors. Clemson, SC.
- Yılmaz M, Bakış A. 2015. Sustainability in construction sector. Procedia Soc Behav Sci. 195:2253–2262.
- Zafar S. 2016. Waste management challenges in Middle East. https://www.bioenergyconsult.com/waste-management-middle-east/.
- Zaki T, Khial A. 2014. Country report on the solid waste management in Egypt (Issue April). http://www.sweep-net.org/sites/default/files/EGYPTRAANG14_1.pdf.
- Zhang S, Pei J, Li R, Zhou J, Xue B, Hu D. 2019. Effect of coarse aggregate composition on physical and mechanical properties. J Mater Civ Eng. 31(10):1–8.