
 ?Mathematical formulae have been encoded as MathML and are displayed in this HTML version using MathJax in order to improve their display. Uncheck the box to turn MathJax off. This feature requires Javascript. Click on a formula to zoom.
ABSTRACT
N-phenylmaleimide (N-PMI) and its precursor, (Z)-4-oxo-4-(phenylamino)but-2-enoic acid, were synthesized from aniline and maleic anhydride. Copolymerization between N-phenylmaleimide and styrene was initiated in micropores and outside surface of porous polyvinyl chloride (PVC) resin suspended in aqueous phase. The modified PVC was characterized with Gel Permeation Chromatography, thermal gravimetric analysis and scanning electron microscopy. The result of high performance liquid chromatography shows that the purity of N-PMI reached 97.3%. Thermal gravimetric analysis indicated that the introduction of N-PMI could clearly affect the thermal degradation behavior of PVC, and when PMI was at 6.25% of the PVC mass, the decomposition temperature T0.5 of modified polymer was increased to 314.2°C. The glass transition temperature of modified polymer was increased from 70°C to 80°C.
Introduction
In the past decades, remarkable progress has been made in the investigation of polymer structure and property [Citation1]. Nowadays polyvinyl chloride (PVC), as one of the most productive polymer materials all over the world [Citation2], is widely used in daily life, chemical industry, mining, pharmaceutical, machinery and agriculture due to its inflammability and processability. But because of its low softening temperature, its application in some special fields is extremely limited. For instance, hot water pipes need to be used above 80℃ in many cases [Citation3]. However, the highest working temperature of ordinary PVC is approximately only 65℃ [Citation4]. The ordinary filling modification is effective in reducing cost and strengthening mechanical properties, but limited in improving heat-resistance [Citation1,Citation5].
Majority of PVC resin are obtained from the suspension polymerization of vinyl chloride monomer (VCM). In the traditional suspension polymerization of VCM, disproportionation reaction between the macromolecular free radicals leads to the formation of allyl double bond, and thus introduction of allyl chlorine units in PVC chains. In addition, branched structures in PVC chain are formed in the process of chain transfer if the macromolecular free radicals transfer toward the polymer chains which are growing, and this process is a condition for the formation of the tertiary carbons which link with a chlorine atom. These unstable structures will generate reactive free radicals which could initiate degradation of PVC resins if the PVC samples are heated to 185℃ [Citation6]. Zhu, H. M., Jiang, X. G. and co-authors used simultaneous technique TG-FTIR to characterize the thermal degradation of PVC and to shed light on the thermal degradation processes of PVC mixed with additives during heating in nitrogen [Citation7]. It was shown that the pyrolysis of PVC took place in two temperature ranges, namely 280–400℃ and 400–560℃, accompanied by the release of HCl, and then decomposition of the carbon framework of PVC chains, respectively. In the latter range of temperature, the PVC samples basically lost all mechanical property because the carbon framework of PVC chains was broken [Citation6].
In processing some heat-stabilizers, usually zinc-/calcium-/barium-containing compounds, are blended with PVC to enhance the heat-resistance, but this method does not change the unstable allyl structure in the polymer chain. In PVC, the allyl structure and suspended chlorine atom are highly reactive, which provides possibilities for chemical modification and functionalization of PVC materials [Citation8–Citation10]. Narkis, M., Caplan, M. S. and co-authors [Citation11] conducted the surface graft-copolymerization of styrene and methyl methacrylate to obtain impact-resistant and thermally stable PVC resins.
N-phenylmaleimide (PMI or N-PMI) is a newly reactive monomer which has been widely used to prepare heat-resistant acrylic acid-butadiene-styrene (ABS) resins. In this work, N-PMI and styrene dissolved in toluene–ethanol were copolymerized in the pore of PVC particles suspended in water–DMF–DMAC, and thus obtained heat-resistant and flame retardant PVC materials were characterized with scanning electron microscopy (SEM), elemental analysis (EA), gel permeation chromatography (GPC), thermal gravimetric analysis (TGA) and differential scanning calorimetry (DSC).
Materials and methods
Instrumentation
FT-IR spectra were recorded on an IRAffinity-1 FT-IR spectrometer (Shimadzu, Japan) with KBr pellet. EA was carried out on a Euro EA 3000 Elemental Analyzer (Leeman Labs, the USA). The purity of (Z)-4-oxo-4-(phenylamino)but-2-enoic acid was confirmed by titration. The purity of N-PMI was recorded on an LC-20A liquid chromatograph (Shimadzu, Japan). 13C-NMR and high-resolution mass spectrum (HRMS) of both (Z)-4-oxo-4-(phenylamino)but-2-enoic acid and N-PMI were recorded on a Bruker Avance III 400 MHz nuclear magnetic resonance spectrometer (the USA) and a Thermo Fisher TSQ Quantum Ultra mass spectrometer (the USA), respectively.
Analytical instruments of the polymers are given in as a list.
Table 1. A list of the analytical instruments.
Materials
All reagents, unless otherwise specified, were obtained from Chengdu Chron Chemical Co. Ltd, Jinshan Chemical Reagent Co. Ltd and Micxy Reagent Co. Ltd and were used as received. All solvents were carefully dried and purified.
Synthesis of monomer
Synthesis and characterization of (Z)-4-oxo-4-(phenylamino)but-2-enoic acid
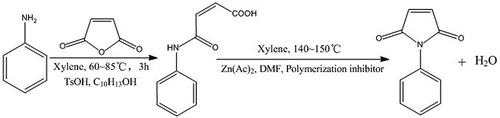
(Z)-4-oxo-4-(phenylamino)but-2-enoic acid (PMA) was synthesized by a mechanism of carbonyl nucleophilic addition and was obtained as follows: 603 g (6.15 mol) maleic anhydride, 1500 mL xylene, 11.05 g P-Toluenesulfonic acid monohydrate (TsOH•H2O) and 0.21 g 4-tert-Butylcatachol were added to a 5000-mL flask equipped with a condenser, thermometer, nitrogen pipe and stirrer (Nitrogen purging should be proceeded before the experiment). The mixture was degassed with nitrogen and heated up to 80–90℃, and stirring was continued. Besides, 558 g (6 mol) aniline was dissolved in 500 mL xylene to obtain the solution of aniline. After the maleic anhydride was completely dissolved, the nearly crystal solution was cooled to 55℃–60℃. To this mixture was added the solution of aniline, which was achieved with a dropping funnel. After dropping the solution of aniline, the mixture was heated and maintained at 60–65℃ for 0.5 h, 70–75℃ for 1 h then 80–85℃ for 1.5 h. White materials gradually generated in the nearly crystal solution when the solution of aniline was dropped into the mixture. At the end of the reaction, the mixture was filtrated at 50–60℃. The filtrate was removed to recycle the xylene in it then the filter cake was washed three times with 100 mL 1%(w/w) alcoholic solution of citric acid (1 g citric acid was dissolved in 99 g ethyl alcohol). The filter cake was then dried under vacuum at 50℃ for 8 h. A yield of 1111.6 g of the product was obtained (Yield 96.9%). The FT-IR spectra, EA, HRMS, 13C-NMR and acid value were recorded. Melting range of the product is 189–191℃, measured by capillary tube.
Values obtained from the elemental analysis (63.1% C, 4.87% H and 7.39% N) are slightly higher than theoretical values (62.8% C, 4.71% H and 7.32% N). It could be thought that the content of each element basically matches with the theoretical values calculated by the unit formula C10H9NO3 of PMA. The vibrational frequency of characteristic groups in PMA was obtained from FT-IR and manifested in . As a result of conjugative effect in the molecular structure, the absorption frequency of each group moved to lower wavenumbers than theoretical value.
Table 2. The IR group vibrational frequency of PMA.
Acid value of PMA
NaOH standard solution was used to titrate a sample of the dried filter cake until the sample was exactly dissolved. To this nearly crystal solution was added cresol red as an indicator. Hydrochloric acid standard solution was used to titrate the above amaranth solution until the color becomes yellow. The volume of the NaOH and hydrochloric acid solution were recorded. The purity of PMA was confirmed by the acid value obtained from titration. An example of calculation was demonstrated as follows:
According to the titration, the average volume of the NaOH (0.2134 mol/L) and HCl (0.1058 mol/L) were 12.39 mL and 0.48 mL, respectively. Mole of the NaOH reacted with unit mass of sample (mol/g) was calculated then corrected to the acid value represented with standard KOH solution (mg/g).
, the formula of acid value is
56.1 is the molecular weight of KOH. A is volume of the KOH standard solution (mL). N is normal concentration of the KOH standard solution. Here, acid value of this sample was
For pure PMA, , IA (pure PMA) = 293 mg/g, purity of the sample could be represented as
Here, ω ≈ 99.3%.
The results of titration showed that the purity of PMA attains more than 99%.
13C-NMR and HRMS of PMA
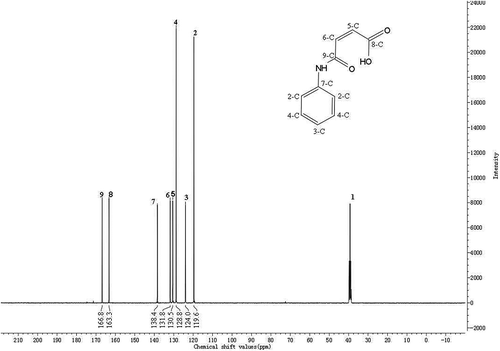
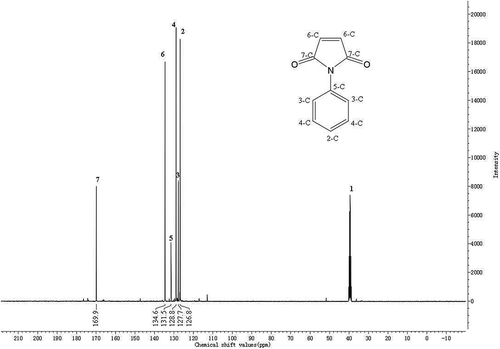
In the 13C-NMR of PMA, DMSO-d6 was used as the solvent. Tetramethylsilane (TMS) was employed as the internal standard substance. No. 1 peak is the chemical shift of –CD3 in DMSO-d6, which could be found in and , respectively. No. 2–9 peaks correspond to the chemical shift of the carbons described in the structural formula of PMA in . The values are 119.6 ppm, 124.0 ppm, 128.8 ppm, 130.5 ppm, 131.8 ppm, 138.4 ppm, 163.3 ppm and 166.8 ppm, respectively. It could be thought that the 13C-NMR result of PMA basically matches with the standard spectrum.
Figure 1. The 13C-NMR of PMA.
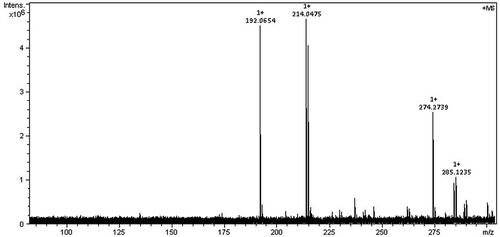
is the HRMS of PMA. Electrospray ionization (ESI) was used as the ion source. The mode was positive. In , it could be found that the intensity of the ion-molecule complexes, MH+ and MNa+, is the highest. Their m/z are 192.0654 and 214.0475, respectively. The result of HRMS basically matches with the relative molecular weight of PMA.
Figure 2. The HRMS of PMA.
Synthesis and characterization of N-PMI
N-PMI was synthesized by a ring-closure reaction of the PMA and was obtained as follows: 860.3 g (4.5 mol) PMA acquired from above process and 2000 mL xylene were added to a 5000-mL flask equipped with a condenser, thermometer, nitrogen pipe, manifold and stirrer. The system was purged continuously with nitrogen. A total of 0.90 g copper dibutyldithiocarbamate, 7.50 g zinc acetate and 11.25 g DMF were dissolved in 500 mL xylene to obtain breen slurry. To the flask was added the breen slurry. The mixture was gradually heated up to 140–150℃ and stirring was continued. The water generated by the ring-closure reaction of PMA was separated and removed by the manifold. The xylene was condensed then reflowed to the mixture. When the mixture did not generate water, it could be thought that the reaction finished. At the end of the reaction, the temperature was cooled to 110–120℃, and then 1000 mL xylene was added to dilute the mixture for 30 min. The mixture was filtrated at 50–60℃. The filtrate was collected then washed with 200 mL 2%(w/w) Na2CO3 solution at 60–70℃. The temperature of the process of phase separation should not be lower than 50℃. The organic phase was collected then washed with 60–70℃ deionized water three times. The water phase was removed. The organic phase was distilled at a vacuum of −0.090 MPa to recycle xylene. The concentrate was cooled to −5℃ for 12 h. N-PMI was crystallized and precipitated in the concentrate. The mixture was filtrated immediately. The filter cake was dispersed and washed with 500 mL cyclohexane three times. A yellow product was obtained and dried at the room temperature. A yield of 553.1 g product was obtained (Yield 71%). The FT-IR spectra, EA, HRMS, 13C-NMR and HPLC were recorded. Melting range of the product is 89–90℃, measured by capillary tube.
Values obtained from EA (69.4% C, 4.38% H and 8.16% N) are slightly higher than theoretical values (69.3% C, 4.04% H and 8.08% N). It could be thought that the content of each element basically matches with the theoretical values calculated by the unit formula C10H7NO2 of N-PMI. The Ar–H stretching frequency and outward bending vibration of =CH–H of olefin structure could also be observed in the IR spectrum of N-PMI. presented the vibrational frequency of characteristic groups in N-PMI. As the result of the cooperative influence of conjugative effect and tension of imide ring, the C=O stretching frequency of imide structure in N-PMI was observed at 1708.9 cm−1.
Table 3. The IR group vibrational frequency of N-PMI.
The synthesis route is shown in .
Figure 3. The synthesis of N-PMI.
Purity of N-PMI
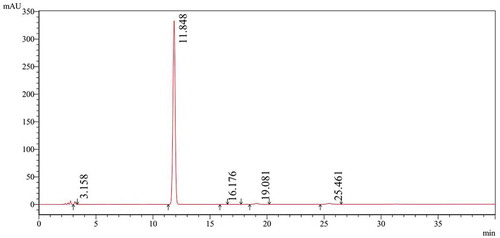
The purity of N-PMI was confirmed by the HPLC. The HPLC chromatogram of N-PMI is illustrated in . The detecting conditions are presented in . The analysis results of area normalization method indicated that purity of more than 97% was obtained.
Table 4. Detecting conditions of the HPLC.
Figure 4. The HPLC of N-PMI.
13C-NMR and HRMS of N-PMI
The 13C-NMR spectrum of N-PMI is manifested in . DMSO-d6 was utilized for dissolving the sample. TMS was employed as the internal standard substance. No. 2–7 peaks correspond to the chemical shift of the carbons described in the structural formula of N-PMI in . The values are 126.8 ppm, 127.7 ppm, 128.8 ppm, 131.5 ppm, 134.6 ppm and 169.9 ppm, respectively. The 13C-NMR result of N-PMI basically matches with the standard spectrum.
Figure 5. The 13C-NMR of N-PMI.
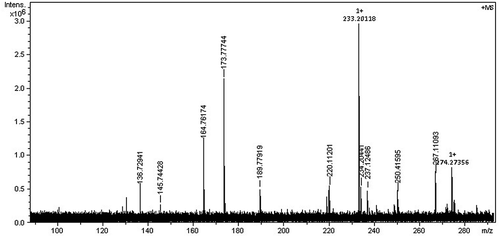
is the HRMS of N-PMI. ESI was used as the ion source. The mode was positive. In , except the molecular ion peak of N-PMI (m/z = 173.78), there are a few ion-molecule complexes formed by the fragmentation of imide and phenyl structure in N-PMI. Limited by space, there was no further discussion on this complex fragmentation of the ring structure. It could be thought that the result of HRMS basically matches with the relative molecular weight of N-PMI.
Figure 6. The HRMS of N-PMI.
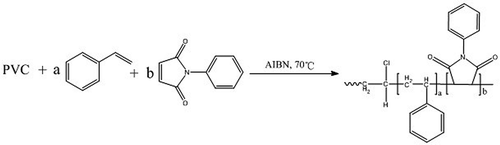
Grafted copolymerization
In the following experiment, sodium dodecyl benzene sulfonate (SDBS) was used as the surfactant of suspension polymerization. PMI was recrystallized in ethyl alcohol to achieve the required purity for copolymerization.
Synthesis of PMI-styrene copolymer
To a 500 mL-flask equipped with a condenser, thermometer, nitrogen pipe and stirrer was added 100 g deionized water and 0.50 g SDBS. The mixture was purged continuously with nitrogen and heated up to 60℃. Stirring was continued. A total of 12.01 g PMI, 10.12 g styrene and 0.55 g azodiisobutyronitrile (AIBN) were dissolved in 110.6 g mixed solvent of toluene:alcohol (7:4) to give a transparent golden solution. To the mixture in the flask was added the golden solution, which was achieved with a dropping funnel. The copolymerization was initiated by the AIBN at 65–70℃ and proceeded for 4.5 h. At the end of the reaction, the mixture was cooled to the room temperature, and then filtrated. The filter cake was dispersed and washed with 100 g 95% alcohol. The wet product was collected and dried under vacuum to give 16.14 g (Yield 72.9%) copolymer as a yellow block. The result of GPC was recorded.
Grafted copolymerization of monomers adsorbed on PVC
The specification of the PVC used in this experiment is presented in .
Table 5. The specification of the PVC.
To a 500 mL-flask equipped with a condenser, thermometer, nitrogen pipe and stirrer were added 90 g PVC, 1.85 g SDBS, 150 g deionized water, 50 g DMF and 50 g DMAC. The mixture was purged with nitrogen and stirred continuously at 28–32℃. N-PMI, styrene and AIBN were dissolved in 100–110 g mixed solvent of toluene and alcohol to obtain a transparent golden solution (Dosage of the AIBN accounted for 1.5% total mass of N-PMI and styrene.). To the mixture in the flask was added the golden solution, which was achieved with a dropping funnel. After the dropping of the solution of monomers, the mixture was kept at 28–32℃ for 30 min, and then gradually heated up to the temperature of polymerization. The polymerization was initiated at 70℃ and proceeded for 4–5 h. At the end of the reaction, the mixture was cooled to the room temperature and then filtrated. The filter cake was dispersed and washed with 180–220 g 95% alcohol. The wet product was collected and dried under vacuum to give the modified PVC particle. The results of EA, GPC, SEM, TG and DSC were recorded.
The synthesis route is illustrated in .
Figure 7. The grafted copolymerization.
Results and discussion
The calculated yields of N-PMI and modified PVC were 65–71% and 80.2–97.1%, respectively. According to the proportion of monomers, the modified PVC resins were named as NxSy-mPVC, which means that the PVC was modified with xg N-PMI and yg styrene. Appearance and morphology of the modified PVC were affected by the dosage of N-PMI. With the increase of N-PMI dosage, the color of modified PVC gradually became yellowish, which was different from original pure white.
Characterization of the modified PVC
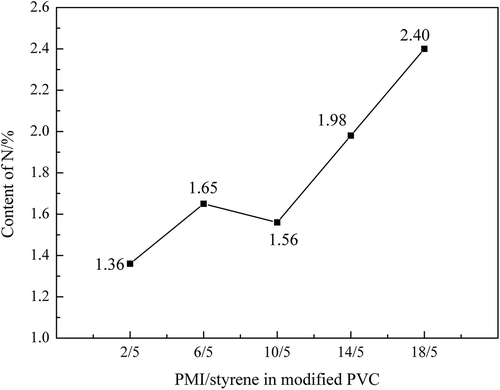
Estimation of the graft amount
The content of the N in the modified PVC obtained from the elemental analysis could approximately reflect the graft amount of PMI. The result of EA is illustrated in . With the increment of N-PMI, the content of the N in the modified PVC gradually enhanced but slightly declined to 1.56% when the mass of N-PMI was 10 g. According to , it could be concluded that PMI was successfully grafted into the PVC matrix.
Figure 8. Content of N in the modified PVC.
Microtopography of the modified PVC
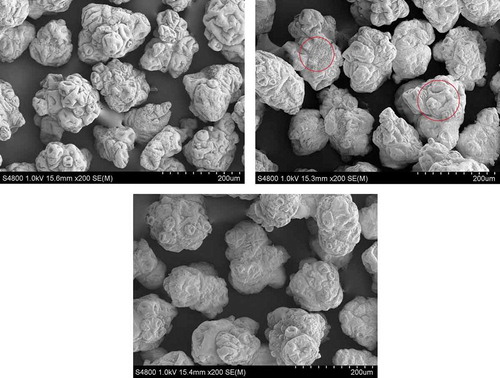
The images of SEM of ordinary PVC and modified PVC are presented in . Porous structure and irregular shape of PVC resin could be observed in ). This structure makes PVC particles adsorb the monomers under the experimental condition. The size is from 90 μm to 180 μm. The copolymerization between N-PMI and styrene was initiated in the pores and channels of PVC particle. As a consequence, the porous structure of PVC particles was covered by network of the PMI-styrene copolymer. Both the covered copolymer and original pores could be observed in the red circles of Figure 9(b) because of a small dosage of N-PMI. More copolymer could be observed on the surface of PVC when the dosage of N-PMI was increased .
Figure 9. (a) Ordinary PVC resin (Image of the SEM).(b) N2S5-mPVC (Image of the SEM).(c) N10S5-mPVC (Image of the SEM).
Estimation of the molecule weight
GPC was utilized for confirming the molecule weight of the polymerization product. demonstrated the detecting conditions of GPC. The molecular weight distribution (MWD) of PVC, N2S5-mPVC and PMI-styrene copolymer is presented in (Molecular weight was abbreviated MW.). Obviously, the average molecular weight of PMI-styrene was lower than PVC and modified PVC.
Table 6. Detecting conditions of the GPC. (Differential refractive index detector was abbreviated RID in this table.).
Figure 10. The MWD of PVC and the polymerization products.
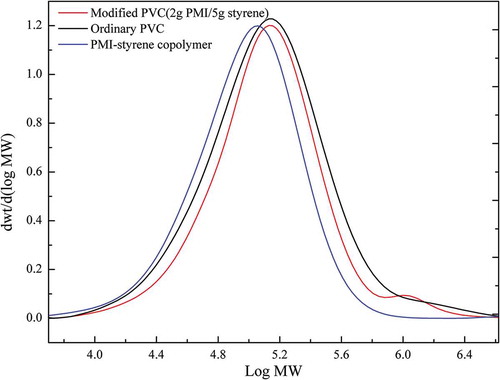
A small quantity of long-chain polymer molecule, including the highly branched structures, existed in the commercial PVC resins, the signal of these polymer chains could be found on the black curve at the range of higher Log MW (5.8–6.4). According to the experiment of grafted copolymerization, majority of PMI and styrene were copolymerized in the pore of PVC particles. Nevertheless, there was a small number of monomers (PMI and styrene) copolymerizing with the reactive double bond in PVC chains. In the view of probability theory, the longer PVC chains are, the higher probability of forming unstable allyl structure is. Therefore, the monomers were mainly copolymerized with the reactive double bond in long-chain molecule of the PVC to form a small number of high molecular weight (PMI-co-styrene)-g-PVC. As a consequence, a short but visible peak appeared on the red curve (modified PVC) at this range of Log MW, which could be explained that the formation of (PMI-co-styrene)-g-PVC in modified PVC led to the centralization of the MWD. Because the long-chain structures accounted for a low proportion in PVC chains, there was a small quantity of (PMI-co-styrene)-g-PVC existing in the modified PVC. A similar consequence could be obtained from . The number-average molecular weight (Mn), weight-average molecular weight (Mw), z-average molecular weight (Mz) and polydispersity index (PDI) acquired from GPC analysis of the samples are manifested in . Compared to ordinary PVC, Mw of the modified PVC enhanced from 1.901 × 10⁵ to 2.067 × 10⁵. The increasing of Mw meant that the proportion of large polymer molecule in PVC resin after the modification was higher than before.
Table 7. Analysis results of the GPC.
TG and DSC analysis of the PVC samples
TG curves of the PVC samples
The atmosphere and heating rates were N2 and 10℃/min, respectively. As shown in which completely described the thermal degradation behavior of the PVC and modified PVC from 34℃ to 650℃ under an atmosphere of N2, two apparent thermal degradation stages are detected for all of the PVC samples. To clearly describe the pyrolysis of each PVC sample, is divided into three parts according to the range of temperature, namely (34–200℃), (200–350℃) and (350–600℃).
Figure 11. The complete process of pyrolysis of the PVC samples. The complete process of pyrolysis of the PVC samples.(a) The TG curves from 34℃ to 200℃.(b) The TG curves from 200℃ to 350℃.(c) The TG curves from 350℃ to 600℃.
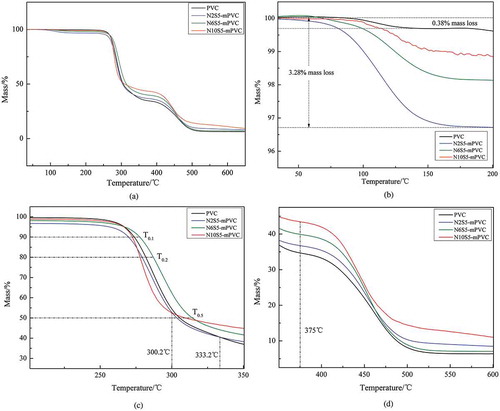
showed the results of TGA of PVC and modified PVC from 34℃ to 200℃. The reason why a slight loss of weight (0.38–3.28%) could be observed from 75℃ to about 200℃ is that the porous PVC particles adsorbed a small amount of solvent in process of the experiment or water in the air. In this range of temperature, the mass loss of N10S5-mPVC manifested a trend of fluctuation and decline; however, there was no fluctuant trend in the blue and green curve. After 200℃, the red curve also became smooth, which could be observed in .
presented the first stage of pyrolysis of the PVC samples. The most obvious trend of the drop could be observed on the red curve (N10S5-mPVC) from about 280℃ to 300℃. At the same time, it could be found that the curve of N10S5-mPVC firstly turns to be more gentle after about 300.2℃ than PVC, N2S5-mPVC and N6S5-mPVC.
N2S5-mPVC, which had the smallest dosage of PMI, showed the almost same trend of weight loss as ordinary PVC before about 333.2℃, but after this temperature, the weight loss of N2S5-mPVC became slower than ordinary PVC. Furthermore, in , T0.1, T0.2 and T0.5 were employed to represent the temperatures corresponding to mass loss 10%, 20% and 50% of the PVC samples. These intuitional temperatures could be utilized for describing the effect of each dosage of N-PMI for stabilizing PVC in . Basically, the T0.1, T0.2 and T0.5 of each modified PVC sample presented a similar trend, with the increment of N-PMI. It could be observed that these specific temperatures of N6S5-mPVC were the highest in the samples. T0.1, T0.2 and T0.5 of N6S5-mPVC were, respectively, 277.4℃, 287.2℃ and 314.2℃. However, according to the trend of the red curve in , it could be predicted that the T0.55 of N10S5-mPVC was the highest when the temperature was increased to about 350℃. A similar trend could be observed in which used the residual mass of the samples to illustrate the effect of each dosage of N-PMI.
Figure 12. Specific mass loss temperature of the PVC samples.
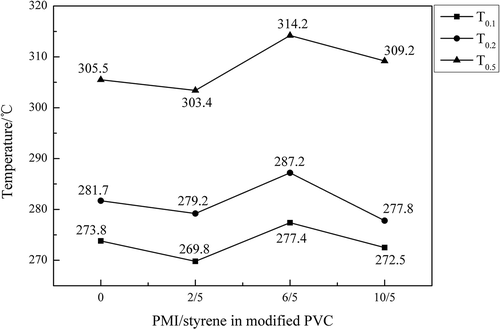
Figure 13. The residual mass of each PVC sample at different temperatures.
manifested the TG curve of each PVC sample from 350℃ to 600℃. A visible step of weight loss could be observed from about 420℃ to 500℃. The downtrend of black (PVC), blue (N2S5-mPVC) and red (N10S5-mPVC) curve gradually tended to be consistent when the temperature exceeded 400℃, but the decrement of N6S5-mPVC became more dramatical in this range of temperature than before.
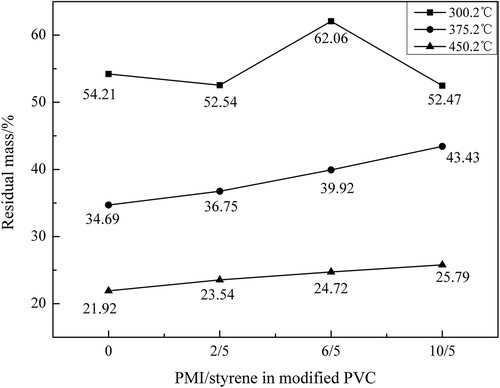
The trends of residual mass of each PVC sample at 300.2℃, 375.2℃ and 450.2℃ are demonstrated in . At 300.2℃, the residual mass of N6S5-mPVC, 62.06%, exceeded the other samples at this temperature then rapidly declined to 39.92% with the increase of temperature. N6S5-mPVC experienced a mass loss of 22.14% which was more than N10S5-mPVC (only 9.04%) from 300.2℃ to 375.2℃. At 375.2℃, there was an increasing trend of residual mass, which could be found in the middle broken line. Incremental residual mass at the same temperature meant the introduction of PMI could enhance the heat resistance of PVC resins to a certain extent.
DSC of the PVC samples
The glass transition temperature (Tg) of each PVC sample was determined by DSC. In order to avoid the adverse effects of heat history on the Tg, the PVC samples were firstly heated with a rate of 20℃/min from 25℃ to 190℃ under an atmosphere of N2, and cooled with a rate of 10℃/min. Then, the DSC data were obtained by again heating the samples with a rate of 20℃/min from 25℃ to 190℃ under an atmosphere of N2, which are illustrated in . To obtain monomers dosage for the influence of Tg, the ratio of styrene and PVC was also investigated in this part.
Figure 14. The DSC curves of the PVC samples.
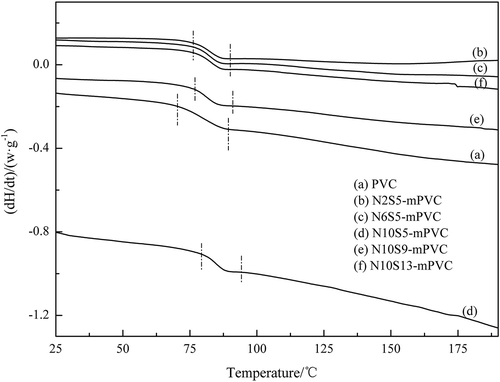
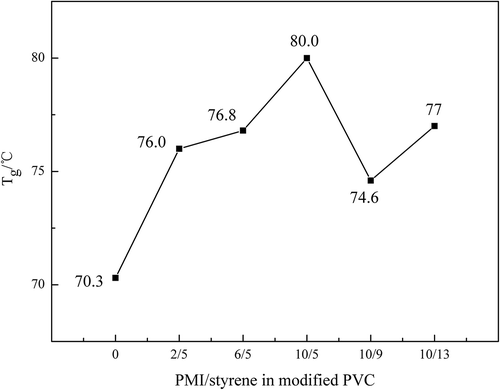
The temperature range of glass transition was illustrated by dot-dash in . The compatibility of the components in nonhomogeneous polymer could be confirmed according to Tg, single Tg means that the components are compatible. Only one area of glass transition was observed in each DSC curve of the PVC sample, which indicates that the PVC matrix and monomers (N-PMI and styrene) are compatible. The exact Tg of each PVC sample was confirmed by the stipulation of International Confederation for Thermal Analysis. demonstrated the relationship between Tg and proportion of the monomers. It could be found that the highest Tg of modified PVC reached to 80℃, but the Tg of PVC was only 70.3℃. Moreover, it is not obvious that the Tg was enhanced by adding styrene.
Figure 15. Glass transition temperature of each PVC sample.
Conclusion
N-PMI was synthesized by the two-step method and characterized by FT-IR and EA. Basically, the 13C-NMR of PMA and N-PMI matches with the standard spectrum. The N-PMI with 97.3% purity was obtained. The grafted copolymerization between N-PMI and styrene was initiated in the pores of PVC particles to obtain the heat-resistant PVC materials. The modified PVC were characterized by EA, SEM, GPC, TGA and DSC. Results of the EA showed that the monomers were successfully grafted into the PVC matrix. Above experiment method enhanced the heat resistance of PVC resin to a certain degree. TGA indicated that the introduction of N-PMI could clearly affect the pyrolysis behavior of PVC under an atmosphere of N2, and when N-PMI was at 6.25% of PVC mass, the decomposition temperature T0.5 of the PVC was increased from 305.5℃ to 314.2℃. DSC curves indicated that the PVC resin and monomers (N-PMI and styrene) are compatible. In addition, it could be concluded that both N-PMI and styrene affected the Tg of PVC, but N-PMI mainly contributed enhancement of the Tg.
Acknowledgments
Thank for the guidance of Professor Jiang Wenwei. The results of EA and DSC was provided by The Center of Testing and Analysis of Sichuan University. The experimental instrument and sectional results of the analysis were provided by the Fine Chemical Engineering Laboratory of Sichuan University.
Disclosure statement
No potential conflict of interest was reported by the authors.
Related Research Data
References
- Allcock HR, Lampe FW. Contemporary polymer chemistry. New Jersey : Prentice-Hall; 1981.
- Darvishi R, Esfahany MN, Bagheri R. S-PVC grain morphology: a review. Ind Eng Chem Res. 2015;54(44):151020140412000.
- Zhao YW. Synthesis, application and market prospect of N-phenyl maleimide. Technol Dev Chem Ind. 2007;36(11):38–41.
- Cui MS, Zhang P, He SX. Research progress and prospects of the PVC modification. China Chlor-Alkali. 2017;5:11–14.
- Pi H, Guo SY. A study on mechanochemical modification of PVC/flame-retardant and smoke-suppressant additives system. Polym Mater Sci Eng. 2004;20(4):156–159.
- Gao JG, Yang LT, Li YF. Modified polyvinyl chloride new materials. Beijing: Chemical Industry Press; 2002.
- Zhu HM, Jiang XGYan JH, et al. Zhu, h. M., Jiang, X. G. and Co-authors Used Simultaneous Technique Of Tg-ftir to Characterize The Thermal Degradation Of Pvc and to Shed Light on The Thermal Degradation Processes Of Pvc Mixed with Additives during Heating in Nitrogen. J Anal Appl Pyrol. 2008;82(1):1–9.
- Kiskan B, Demiray G, Yagci Y. Thermally curable polyvinylchloride via click chemistry. J Polym Sci Pol Chem. 2010;46(11):3512–3518.
- Herrero M, Tiemblo P, Reyes L,J, et al. PVC modification with new functional groups. Influence of hydrogen bonds on reactivity, stiffness and specific volume. Polymer. 2002;43(9):2631–2636.)
- Bicak N, Karagoz B. Merrifield-like resin beads by acid catalyzed incorporation of benzyl chloride into dehydrochlorinated PVC. Eur Polym J. 2007;43(11):4719–4725.
- Narkis M, Shach C, Haba M, et al. PVC modification through polymerization of a monomer absorbed in porous suspension-type PVC particles. J Vinyl Addit Technol. 2004;10(3):109–120.