
 ?Mathematical formulae have been encoded as MathML and are displayed in this HTML version using MathJax in order to improve their display. Uncheck the box to turn MathJax off. This feature requires Javascript. Click on a formula to zoom.
ABSTRACT
The objective of this paper was to develop a PLGA carrier Ticagrelor sustained-release microspheres preparation, which was expected to continue to release Ticagrelor for 14 days with a high encapsulation rate. Ticagrelor microspheres were prepared successfully with average diameter of 7.31 µm, drug loading of 12.49 ± 0.32% and EE up to 79.09 ± 1.69%. In the release medium of PH7.4 PBS, the microspheres showed good drug release behavior in vitro. In vivo release results also showed that the sustained-release microspheres could effectively control drug release in vivo and maintain a relatively stable blood drug concentration for about 2 weeks. The results indicate that Ticagrelor sustained-release microspheres can be used for long-term treatment of acute coronary syndrome.
1. Introduction
Acute coronary syndrome (ACS) is a clinical syndrome that causes thrombosis due to the rupture of atherosclerotic coronary plaques. It has become one of the main fatal diseases in my country in recent years. Therefore, the treatment of ACS is urgent. Platelet therapy is particularly important. At present, aspirin combined with clopidogrel, which is applied to antiplatelet therapy, is often used clinically [Citation1]. Clopidogrel is an antagonist of the P2Y12 receptor on the platelet surface. It is a prodrug and needs to be metabolized in the liver into an active product-a thiol derivative, so it has a slow onset of action. The recovery time of platelet function after discontinuation of clopidogrel is longer in patients, and clopidogrel has low resistance to some medications, which increases the risk of thrombosis after percutaneous coronary intervention (PCI).
Ticagrelor is a new type of cyclopentyltriazole pyrimidine (CPTP) antiplatelet drug developed by AstraZeneca, UK, as a drug for the treatment of acute coronary syndrome. As a medicine for the treatment of acute coronary syndrome, it can directly and reversibly antagonize the P2Y12 receptor on the platelet surface, preventing the platelet membrane glycoprotein GP□b/□a coupled with it from binding to fibrinogen, thereby inhibiting platelet aggregation [Citation2]. Compared with clopidogrel, Ticagrelor has a faster onset of action. Under normal circumstances, the degree of platelet inhibition will reach the highest value within 2 hours. At the same time, Ticagrelor is a non-prodrug, and liver metabolism is not required in this process, so the drug will not be affected by liver function. According to existing studies, genotypes such as CYP2C19 and ABCB1 will not affect Ticagrelor, and Ticagrelor is equally effective for patients with low clopidogrel responses. Therefore, Ticagrelor has a better curative effect than that of previous standard treatments, which can significantly reduce the incidence of cardiovascular events in ACS patients without increasing the risk of bleeding [Citation2]. The marketed dosage form of Ticagrelor is an oral yellow film-coated tablet, which has been recommended by many international treatment guidelines for the treatment of patients with acute coronary syndrome (ACS). It has been approved for listing in nearly 100 countries around the world and has been included in medical insurance projects in many countries. In November 2012, this product obtained an import drug license issued by the CFDA and was approved to be marketed in China under the trade name Belinda. However, due to the high price, a single dosage form is far from meeting clinical needs, and the absorption of oral administration is affected by food, which easily leads to the appearance of peaks and valleys in blood concentration, which seriously hinders its wide clinical application. Therefore, what measures will be taken to improve the clinical efficacy of Ticagrelor and reduce the toxic and side effects caused by peak blood concentration is an urgent problem in the medical field.
In recent years, research on PLGA sustained-release microspheres has been hot [Citation3,Citation4]. In 2019, Luye Pharma Group announced that its new drug in development for the treatment of Parkinson’s disease – Rotigotine sustained-release micropellets for injection – had been approved by the China Food and Drug Administration (CFDA) to conduct a phase III clinical trial in China. Exenatide sustained-release microspheres for injection have also been approved by the China Food and Drug Administration to enter clinical trials and so on. PLGA sustained-release microspheres can realize long-term drug action, reduce the time of administration and decrease the fluctuation of blood drug concentration. Therefore, PLGA has become an ideal carrier material for sustained-release and controlled-release systems at present [Citation5–8]. In this paper, Ticagrelor PLGA microspheres for injection were prepared by an improved emulsification solvent evaporation method, and their structure was characterized by DCS, XRD, SEM and other techniques. Its drug release in vitro and its pharmacokinetics in rabbits were studied systematically. The detailed report is as follows.
2. Experimental materials
2.1. Materials and animals
Reagents: PLGA (lactide/glycolide 75/25, MW 5000 Da, acid-terminated) was purchased from Shanghai Mengya Biological Co., Ltd. The polyvinyl alcohol (PVA) was used to make microspheres originated from Shenchuang Chemical Co., Ltd. (Guangzhou). Methanol and triethylamine were purchased from Sinopharm Chemical Reagent Co., Ltd. (Beijing). Dichloromethane, acetonitrile, tetrahydrofuran and other reagents were of analytical grade.
Instrument: Micropipette, Vortex oscillator, SCIENTZ-12 N freeze dryer, TD5A-WS desktop low-speed centrifuge, liquid chromatograph, UV detector, etc.
Animal: Rats (male, 180–220 g) were raised in a 22 ± 1°C environment prior to the experiment and given a standard diet and water. All animal experiments were in compliance with the ‘Guidelines for the Care and Use of Laboratory Animals’.
2.2. Preparation of microspheres
The PLGA microspheres of Ticagrelor were prepared by an improved emulsification solvent evaporation method [Citation9]. After dissolving 150 mg PLGA and 30 mg Ticagrelor in 4.0 ml dichloromethane and petroleum ether (oil phase), 4.0 ml 1% (volume fraction, same as below) PVA solution was added, and the O/W emulsion was obtained by phacoemulsification in an ice bath for 2 min. It was then added drop by drop with a syringe to a polyvinyl alcohol solution of 50 mL of 3% PVA. The emulsion was stirred at 25°C at 1750 r/min for 3 h to remove the oily solvent. The microspheres were collected by centrifugation at 4000 r/min for 20 min and washed with distilled water 3 times. After lyophilization, the low temperature was stored at −20 °C.
2.3. Formulation optimization of microspheres
On the basis of the investigation of various factors, four factors (namely, mixed solvent ratio [A, dichlothane: petroleum ether, volume ratio], PLGA concentration in the oil phase [B, mass-to-volume ratio], dosage ratio [C, mass ratio] and stirring speed [D]) were selected to optimize the microsphere preparation process by response surface methodology. Three levels of each factor were selected for response surface analysis experiments. The experiment arrangement is shown in .
Table 1. Levels and codes of response surface test factors
2.4. Characterization of microspheres
2.4.1. Observation of surface morphology, particle size and distribution
The morphology of the microspheres was observed and photographed with an optical microscope during the preparation process, and they should be a round, spherical, or elliptical entity. A Laser particle size analyzer (MD-1, Chongqing, China) was used to measure the particle size of the successfully prepared microspheres, and SPSS10.0 statistical software was used to obtain the average particle size. The measured particle size dispersion was expressed by span (span of dispersity), and the calculation formula was span = (D90 − D10)/D50, where D10, D50 and D90 indicated that 10%, 50% and 90% of the microspheres had particle sizes smaller than those indicated by this value. The size distribution was considered as narrow for span values <0.45.
2.4.2. Differential scanning calorimetry
Thermogravimetric analysis was performed through the use of a German TG209F1 thermogravimetric analyzer. Thermal analysis was performed on PLGA, blank microspheres, Ticagrelor, drug-carrying microspheres and the physical mixture of blank microspheres and Ticagrelor to determine the physical state of the drugs mixed into the microspheres, so as to study the influence of drugs on the glass transition temperature of PLGA.
Specific steps: A 35 mg sample was first placed in an aluminum tray, using purified indium (99.9%) as the standard reference material. Calibrate the instrument temperature and energy scale and perform thermal analysis after sealing with a pinhole aluminum cap. Analysis of the atmosphere: nitrogen; heating rate: 10°C/min; scanning range: 30–210°C.
2.4.3. X-ray powder diffraction
In this test, Ticagrelor powder, blank microsphere, drug and blank microsphere physical mixture and drug-loaded microsphere samples were analyzed by X-ray diffraction. Test conditions: X-ray diffraction, 40 kV, 40 mA, scanning rate of 5°/min, scanning range of 5–45°. Finally, the physical form of the drug in the sample was determined by comparing the peak intensity of the XRD images obtained.
2.4.4. Determination of drug loading volume and encapsulation rate
First, 30 mg of lyophilized Ticagrelor microsphere powder was dissolved in 1.0 mL dimethyl sulfoxide. Then, 0.16 ml was placed in a 10-mL volumetric flask and the volume was fixed with anhydrous ethanol on the scale. The suspension was centrifuged at 2000 r/min for 10 min to separate PLGA, and the absorbance of the supernatant was measured at 300 nm, and the concentration was calculated according to the standard curve to obtain the drug content.
The Ticagrelor loading and encapsulation efficiency were calculated by the use of the following formulae:
2.4.5. UV analysis
Precisely weigh 25 mg of Ticagrelor and place it in a 250-mL flask. Dilute 0.2% polysorbate 80 solution to scale, shake well, and serve as a linear reserve solution. Measure an appropriate amount of the above reserve solution into the corresponding flask, dilute it with 0.2% polysorbate 80 solution to scale, shake it well, and prepare a reference solution with a mass concentration of 1, 2, 5, 10, 20, 25 µg/mL, respectively. An appropriate amount of the above solutions was taken and the absorbance (A) was measured at the wavelength of 300 nm. Linear regression was conducted between A and the corresponding mass concentration (C), and the linear equation was obtained as A = 0.0266 C-0.0296 (R2 = 0.9983). The linear detection mass concentration range of the indicator was 1–25 μg/mL.
2.4.6. In vitro accelerated release study
In vitro drug release experiments of Ticagrelor microspheres were carried out by simulation of the environment of the body and gastric juice, and the release types were evaluated. 30 mg Ticagrelor sustained-release microspheres were accurately weighed in 6.0 mL phosphate buffer saline (PBS, pH = 7.4). Then, put it into a dialysis bag and put it in a 100 ml sealed conical flask [Citation10]. It was incubated in a 37 ± 0.5°C thermostatic water bath oscillator at 100 r/min for 14 days. Samples were taken at the sampling points of 0.25, 0.5 1, 3, 6, 12 h, and 1–14 days, respectively, and the same volume of blank fresh phosphate buffer was added at the same time. The suspension was separated at 3500 r/min for 5 min, and the supernatant was separated and tested.
2.5. Factors experiment
In order to explore the inherent stability of the prepared Ticagrelor sustained-release microspheres, we took an appropriate amount of prepared microspheres and investigated the influence of temperature, humidity and light on the three unilateral factors [Citation11]. Each test was repeated 3 times. The verified accelerated release determination method was used to determine the release characteristics of the injected microspheres in the stability test, and the similarity factor (f2) of the release curve of the freshly prepared microspheres was used as the evaluation index. An optical microscope was used to observe the appearance and shape changes and dispersion of the injected microspheres.
Accelerated release determination method: in (37 ± 0.5) °C constant temperature water bath, 300 r/min shaking conditions, with 20% ethanol and pH 7.4 phosphate buffer salt as the release medium. Take samples at 0.5 h, 1 h, 2 h, 6 h, 12 h and 2–4 days, and then determine the drug content and calculate the release amount. By investigating the above-mentioned three-phase indicators, observe the influence of different influencing factors on the stability of the injected microspheres [Citation12].
2.5.1. Experimental design of temperature, humidity and illumination
High-temperature test: Take the injected Ticagrelor sustained-release microspheres and seal them in an Erlenmeyer flask, place them at 5°C, 25°C, and 40°C for 14 days, and then take samples on the 7th and 14th day for testing.
Humidity experiment: Take self-made injection Ticagrelor sustained-release microspheres and place them in a weighing bottle. Place them in a constant humidity airtight container with relative humidity (RH) (70 ± 5%)% and (90 ± 5%)% respectively at room temperature for 14 days. Take samples and test on the 7th and 14th day. At the same time, the hygroscopic and deliquescent properties of the microspheres were investigated by calculating whether they gained weight before and after the test and observing their fluidity.
Illumination experiment: Place the injected microspheres in transparent and brown vials respectively, and place them for 14 days under strong light conditions with an illuminance of (4,000 ± 500) lx. Take samples for testing on the 7th and 14th days and observe the changes in appearance, shape and color to explore the effect of strong light on the stability of the injected microspheres.
2.6. Pharmacokinetic study
2.6.1. Pharmacokinetic study design
All rats were fasted for 12 h prior to the experiment, and then randomly divided into two groups: one group (n = 6) received Ticagrelor hydrochloric acid aqueous solution (30 mg/kg) intravenously, and the other group (n = 6) received Ticagrelor microspheres (250 mg/kg) intramuscularly.
At predetermined time intervals, blood was drawn through the orbital vein. Sampling time points for the Ticagrelor·HCl group were 10, 20, 40, 60, 90, 120, 160, 200, 250, 300, 360, 420, 490 and 576 min, respectively. Ticagrelor microspheres were sampled for 0.5, 1, 1.5, 2, 2.5, 3, 3.5, 4, 4.5, 5, 6, 7 days and once daily to 14 days thereafter. The blood samples were placed in the heparin anticoagulant collection vessel, centrifuged at 4000 r/min at 4°C for 5 min, and the plasma was separated and refrigerated at −70°C for later use.
2.6.2. Plasma sample treatment
Plasma sample treatment: Take 100 µL of plasma sample to 1.5-mL EP tube, and 20 μL methanol and 200 μL acetonitrile were added to the tube, then the plasma sample was vortex oscillated for 1 min. Centrifuged at 23,000 r/min at 4°C for 5 min, 100 μL supernatant was transferred into the injection flask for 1 μL injection analysis.
2.6.3. High-performance liquid chromatography conditions
Plasma sample processing: Take 100 µL of plasma sample to 1.5-mL EP tube, add 20 µL of methanol and 200 µL of acetonitrile, vortex for 1 min. Centrifuge at 23,000 r/min for 5 min at 4°C, transfer 100 µL of the supernatant, and transfer 1 µL into a sample bottle for analysis. The standard curve of ticagrelor in plasma was: A = 31,795 C + 895.27, r = 0.992. The linear range was 0.1–5 μg/mL, and the lower limit of quantification was 100 ng/mL. Then, 0.1 –1.5 μg/mL of drug-containing plasma were prepared by using low, middle and high concentrations of drug-containing plasma. The concentration of Ticagrelor after extraction was determined by HPLC, and the chromatogram peak area A1 was recorded. The standard solution of ticagrelor was determined by the same method, and the chromatogram peak area A2 was recorded. The recoveries of (A1/A2)×100% were 85.21 ± 3.42%, 86.91 ± 1.55% and 85.87 ± 0.57%, respectively.
2.7. Statistical analysis
All values were expressed as mean ± standard deviation (SD). P < 0.05 indicated that the difference was statistically significant, and ANOVA was used when necessary. Pharmacokinetic parameters were obtained using the DAS 2.0 (Drug and Statistics for Windows) program.
Illustration: Using PLGA as a carrier, Ticagrelor microspheres were wrapped to form microspheres. Through intramuscular injection into mice and observed its pharmacokinetics.
3. Results and discussion
3.1. Response surface test results and variance analysis
The experimental data was analyzed using Design-Expert 10.0.3 software, and the quadratic polynomial regression equation was finally obtained: Encapsulation rate (%) = −272.17541 + 13.20950·A + 22.86003·B + 5.63957·C + 0.019084·D-0.0221·AB-5.02·AC+8.236· AD-0.0459·BC+2.08·BD-2.13·CD-0.77256· A2-0.53421·B2-0.12535·C2-7.7561D2. The obtained variance analysis results of the regression equation are shown in , in which the F value was used to test the significance of the influence of various variables on the response value. The larger the F value is, the higher the significance is. When the probability of the significance test of the model was P < 0.05, the model was considered statistically significant. It could be seen from that the order of the influence of process conditions on the encapsulation efficiency was as follows: C > A > D > B (dosing ratio>mixed solvent ratio>stirring speed>PLGA concentration).The model’s determination coefficient, R2 Adj = 0.9841, indicated that 98.41% of the changes in the encapsulation efficiency of Ticagrelor microspheres were due to the above four factors. The signal-to-noise (S/N) = 25.864 > 4 also showed that the model was reliable from another aspect, which indicated the degree of fitting between the experimental model and the real data, which has a practical guiding significance. This model could be used to analyze and predict the encapsulation efficiency of the optimal extraction process.
Table 2. Experimental design and results
R2 = 0.9841, Adj R2 = 0.9681, Pred R2 = 0.9094, S/N = 25.864.
3.2. Response surface analysis of various factors
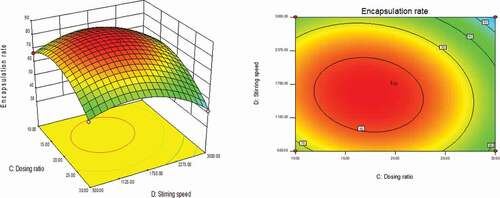
As could be seen from , with the changes in the levels of the four factors, the encapsulation rate had shown a trend of first increase and then decrease. The contour line was a closed ellipse and the response surface was convex, which indicates that their interaction is strong and has a maximum value.It can be seen from that the influence of PLGA concentration and dosing ratio on the encapsulation efficiency presents a parabolic distribution. When the PLGA concentration was controlled at 19–21% and the dosage ratio was 1:18–1:22, the encapsulation efficiency could reach the highest. The influence of mixed solvent ratio and PLGA concentration on the encapsulation efficiency is shown in , which was an arcuate surface, and the encapsulation efficiency first increased and then decreased with the increase in PLGA concentration. When only considering the influence of these two factors on the encapsulation efficiency, the optimized process conditions were as follows: 20% PLGA concentration and 10:1 mixed solvent ratio. As shown in , the dosing ratio had a greater impact on the encapsulation efficiency than the mixed solvent ratio. When the dosing ratio was reduced from 1:10 to 1:20, there was a positive correlation with the encapsulation rate, and then the opposite. Therefore, we could conclude that the dosing ratio of 1:20 was the best process parameter. shows that when only the stirring speed and the mixed solvent ratio were considered, the fluctuation of the encapsulation ratio in the direction of the mixed solvent ratio was much greater than the effect of the stirring speed on it, indicating that the stirring speed had a more significant influence on the encapsulation ratio. It can be seen from that the combined effect of the stirring speed and the PLGA concentration on the encapsulation efficiency was the lowest among the interactions of the four factors, and it could be seen from the figure that the optimal process condition for the stirring speed was 1750 r/min. In the interaction of , under the two factors of dosing ratio and stirring speed, the lowest encapsulation rate was 41.78% and the highest was 81.96%. When the rotation speed was 1750 r/min and the dosage ratio was 1:20, the encapsulation efficiency was the most significant. In summary, the best prescription after optimization by the response surface effect method was as follows: mixed solvent ratio: 10:1, PLGA concentration 20%, dosage ratio 1:20, stirring speed: 1750 r/min.
Figure 1. Curved surface effect diagram of the influence of dosing ratio and PLGA concentration on encapsulation efficiency
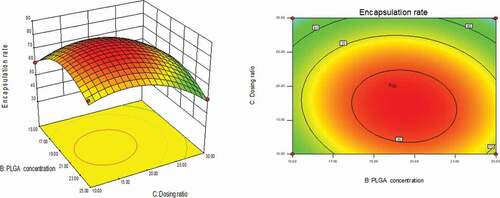
Figure 2. Curved surface effect diagram of the influence of PLGA concentration and mixed solvent ratio on the encapsulation efficiency
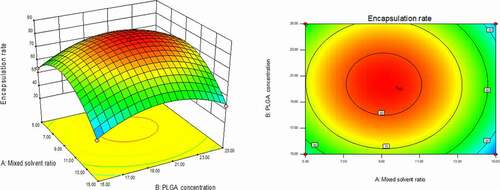
Figure 3. Curved surface effect diagram of the influence of dosing ratio and mixed solvent ratio on the encapsulation efficiency
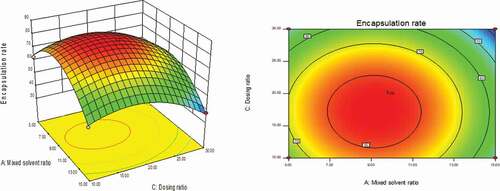
Figure 4. Curved surface effect diagram of the influence of stirring speed and mixed solvent ratio on the encapsulation efficiency
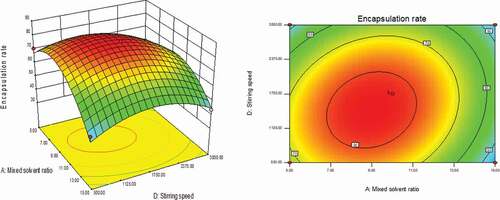
Figure 5. Curved surface effect diagram of the influence of stirring speed and PLGA concentration on the encapsulation efficiency
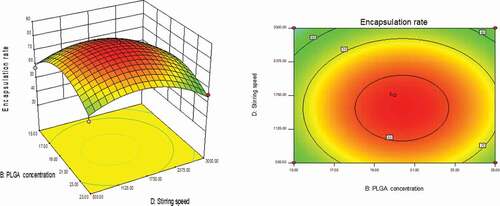
Figure 6. Curved surface effect diagram of the influence of stirring speed and dosing ratio on the encapsulation efficiency
3.3. Observation of microscope morphology
Figure 7. Microsphere morphology under the microscope during the preparation process
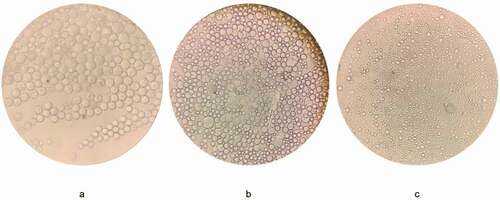
According to the optimized formula, the modified oil-in-water emulsion solvent evaporation method was used to prepare Ticagrelor-loaded PLGA microspheres. However, in our preliminary research, we observed serious damage to the microspheres, and found that the concentration of polyvinyl alcohol in the outer water phase was a decisive factor affecting the integrity of the microspheres [Citation13]. In order to obtain drug-loaded microspheres with a smooth appearance and a low burst rate. We further optimized the formula by changing the concentration of the outer water phase. As shown in , when 1% polyvinyl alcohol was used as the water phase, obvious holes appear on the surface of the microspheres after the dichloromethane volatilizes. This might be caused by the low PVA concentration in the external water phase during the volatilization of methylene chloride. When the concentration of the primary emulsion and water phase was increased to 2% PVA, it could be seen from the optical microscope that some of the microspheres () were slightly damaged, but the spherical shape was more uniform and the holes were significantly reduced. This indicated that increasing the concentration of polyvinyl alcohol had the potential to improve the surface morphology of the microspheres. As expected, when 3% PVA was used in the outer water phase, the spherical, intact, nonporous and smooth surface microspheres were successfully prepared ().
3.4. Characterization of microspheres, drug loading and encapsulation efficiency
Figure 8. The statistical diagram of the influence of ticagrelor’s particle size distribution and the volume ratio of mixed solvents on the encapsulation rate and burst release rate of ticagrelor microspheres
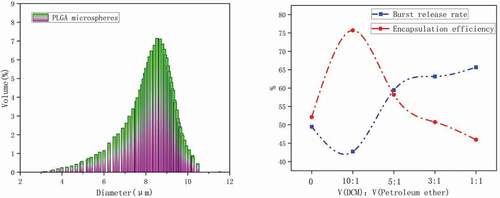
Figure 9. SEM images of prepared ticagrelor microspheres under different viewing angles
The optimized Ticagrelor microspheres were characterized by particle size, surface morphology and particle size distribution, and their drug loading and encapsulation efficiency were tested. As shown in , the prepared Ticagrelor microspheres had a narrow particle size distribution and were monodisperse, with an average particle size of 7.31 ± 1.5 μm, and no microspheres larger than 12 μm. Because the particle size and its distribution significantly affect the mode of administration of the microspheres and the distribution and absorption of the microspheres, the high ratio of surface area to volume was also conducive to drug release [Citation14].
According to research reports, the removal rate of the oil phase solvent was an important factor affecting the microsphere morphology, drug loading capacity and drug release kinetics [Citation15]. The drug encapsulation rate and burst release rate are shown in . When the mixed solvent ratio was 10:1, the microsphere encapsulation rate had reached the maximum, and the corresponding drug burst release rate had decreased to the minimum. As the ratio increases, the encapsulation rate gradually decreases, while the drug burst rate will rise linearly. The reason why the mixed solvent of dichloromethane and petroleum ether was used in the formula was because petroleum ether had a higher saturated vapor pressure than methylene chloride and was very volatile at room temperature. The high volatility of petroleum ether makes the volume of the solution in the dispersed phase oil droplets decrease rapidly, thereby speeding up the solidification process. Because of its water insolubility, numerous small bubbles were formed in the outer water phase when volatilized from the oil droplets. The specific surface area of the gas-liquid interface increases, which could speed up the extraction rate of dichloromethane from the external water phase, and help with the rapid deposition of PLGA to form solidified microspheres [Citation16]. As shown in , when the PVA concentration was 1%, many holes appeared on the surface of the microspheres, which led to drug loss and enhanced burst release. When the mixed solvent ratio was 5:1, the scanning electron microscope of the microspheres was shown in , and the curing speed was too fast, which caused the blank microspheres to be extremely easily broken. The microspheres prepared with the optimized formula are shown in d–f. It could be observed that the microspheres were nonporous, smooth and had no drug crystals loaded on the surface of the microspheres and had uniform size [Citation17]. Ultimately, the drug loading of the microspheres was 12.49 ± 0.32%, and the encapsulation efficiency reached 79.09 ± 1.56% using ultraviolet spectrophotometry. This result did not exceed expectations, because when the emulsification solvent volatilization method was used to make microspheres, the solubility of the drug, the molecular weight of PLGA and its concentration played an important role in the process of making microspheres. In particular, the ionic interaction between the drug and the terminal group of PLGA during the preparation process will increase the molecular weight. In order to reduce the influence of these factors, we used PLGA with a ratio of 75:25 and a low molecular weight [Citation15].
3.5. Thermogravimetric and XRD analysis
Figure 10. Ticagrelor, blank, microspheres, physical mixture DSC(e) and XRD(f) patterns
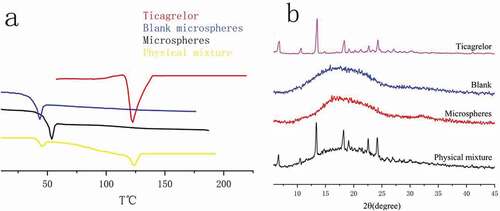
In order to understand the changes in the physical state of the drug during the preparation of microspheres, we used differential scanning calorimetry to perform thermal analysis on Ticagrelor, blank, microspheres and physical mixture. The thermogram is shown in . Whether it was a drug or a physical mixture of a drug and PLGA, there was a corresponding endothermic peak at the position corresponding to its melting point. The peak of the Blank microspheres group appeared at 43.67°C, while the glass transition temperature of the Microspheres group increased to 54.02°C. This situation rarely occurs because, in most cases, when the drug was encapsulated in the microspheres, the interaction between the drug and PLGA will reduce the glass transition temperature of PLGA [Citation18]. However, the same phenomenon was observed in the gentamicin/polylactic acid copolymer, in which gentamicin base and gentamicin sulfate both increased the molecular weight of the polymer [Citation19]. Therefore, it could be guessed that this result may be caused by stronger hydrogen bonding. Because there were as many as 12 hydrogen bond acceptors in the Ticagrelor molecule, they could interact with the carboxyl group at the end of the carrier PLGA to form a more stable cluster, thereby increasing the molecular weight. Glass (Tg) and melting (Tm) transition temperatures and melting enthalpy increase with the increase in polymer molecular weight [Citation20], which could explain why the glass transition temperature has increased by nearly 10.35°. In addition, the peaks of the blank microspheres and Ticagrelor physical mixture groups appeared at 44.45°C and 123.49°C, respectively, indicating that the blank microspheres and Ticagrelor were mixed with two substances, and the thermal energy between the components did not change. There was no endothermic peak at 127.5°C in microspheres. These thermograms showed that the drug was encapsulated to form a new phase and did not exist on the surface of the microspheres, which proved that the drug was dispersed into the microspheres in an amorphous or molecularly dispersed state.
Wide-angle X-ray diffraction (XRD) can monitor possible changes in the crystal form of the drug, so as to further study the crystalline properties of Ticagrelor in the microspheres. shows the XRD patterns of Ticagrelor, blank, microspheres, and physical mixture. The analysis results has shown that there are many diffraction bands peculiar to crystalline materials. The absence of the characteristic peak of the drug Ticagrelor in the XRD pattern of the drug-loaded microspheres further indicates that the drug was mainly in the amorphous state in the microparticles, which proved the formation of the drug-loaded microspheres.
3.6 Experimental results affecting factors
The results are shown in , and the optical microscopy results are shown in . It can be seen from the table that the injected microspheres were placed at 5°C and 25°C for 14 days, and there was no significant change in each index (P > 0.05, f2 > 50). And when placed at 5°C, the color, fluidity, dispersion and release behavior of the injected microspheres were better than 25°C. After being placed at 40°C for 7 and 14 days, although the color of the microspheres did not change, the microspheres were slightly melted and agglomerated and adhered to the container wall. The results of accelerated release of microspheres in vitro are shown in . Although the content of Ticagrelor in the microspheres did not change significantly (P > 0.05), the (f2) of its drug release curve was lower than 50, and the drug release rate was significantly accelerated. The reason may be that 40°C is close to the glass transition temperature of the injected microsphere carrier material PLGA, which increases the volume of the PLGA space, resulting in unstable structure of the injected microspheres, resulting in faster release of the microspheres with diffusion as the main drug release mechanism [Citation21].
Table 3. Variance results
Table 4. Experimental results of influencing factors of injected microspheres
The humidity test results are shown in , and the optical microscope results are shown in d–e. It can be seen from that after the injected microspheres were placed under high humidity conditions, their appearance had changed significantly, and they all appeared to aggregate, absorb moisture, and agglomerate. At the same time, it can be seen from and that although the main drug content of the injected microspheres has no significant change (P > 0.05), it was placed under the conditions of (75 ± 5%) and (90 ± 5%)%RH for 7 and 14 days. However, the release curve of the drug changed significantly (f2 < 50), and the release rate was significantly accelerated. The reason may be that the infiltration of water accelerates the degradation of the PLGA ester bond of the injection microsphere carrier material [Citation22], which accelerates the degradation rate and release of PLGA.
The results of the illumination experiment are shown in , and the results of the optical microscope are shown in f–g. After being placed under strong light for 7 and 14 days, the color of the injected microspheres in the transparent vial was irradiated with strong light, from white to yellow. The main drug content of injected microspheres was significantly reduced (P < 0.05). The in vitro release results of the injected microspheres are shown in . The release curve of the injected microspheres has obviously changed (f2 < 50), and it can be seen that the release rate has been significantly accelerated. There was no change in the microspheres placed in the brown vial.
Figure 11. Influencing factors in vitro release curve of injected microspheres
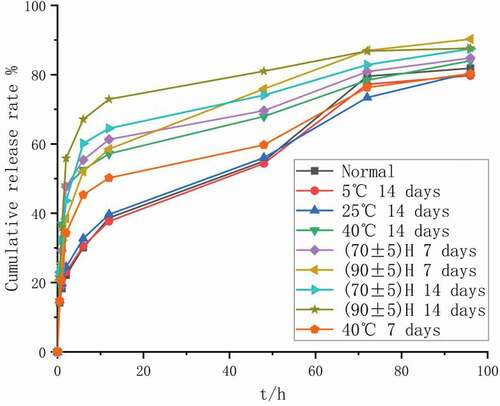
Figure 12. In vitro release curve of injected microspheres after 14 days of illumination under different conditions
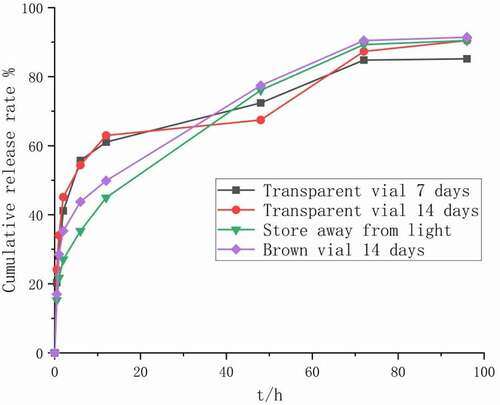
Figure 13. The optical microscope image of the microspheres injected in the experiment
3.7. In vitro drug release profile
Figure 14. In vitro release curve of PLGA microspheres containing Ticagrelor
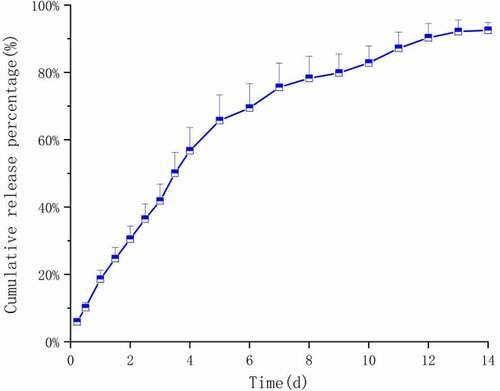
The in vitro release curve of the prepared Ticagrelor sustained-release microspheres is shown in . We have systematically studied the in vitro release behavior of the prepared microspheres. It could be seen from the in vitro release curve that the microspheres were slowly and continuously released, and there was a slow release period of about 5 days. Five days after the release, due to the accelerated degradation of the polymer and the accelerated solution erosion rate, the microspheres slowly appeared in more and more pores. On the 13th day, the release rate reached 89.2% and almost no longer released. Compared with the typical three-phase release mode (i.e., burst release period, delayed release period, and second release period), the initial burst release phase was not obvious here. We have performed related mathematical model fitting on the in vitro release data of the drug. As shown in , the Weibull model and the first-level model were obviously suitable for simulating the drug release behavior of Ticagrelor microspheres [Citation23]. The fitting of the first-order model with the first-order release constant of greater than 0.5 shows that the concentration of gradient diffusion was the main release mechanism of the drug. When b > 1 (b = 1.114), the sigmoid shape of the Weibull function indicates that a complex mechanism dominates the release process in the Weibull model. In fact, this was because the release rate did not change monotonously. It initially increases to the inflection point non-linearly, and then decreases gradually. In addition, the drug was dispersed in the microspheres in an amorphous or molecularly dispersed state, so the diffusion and release of the drug needed to pass through the PLGA matrix or water-filled pores [Citation24].It was observed that there were no obvious pores on the surface and inside of the microsphere system. The release of the drug outside the bound microspheres indicates that the drug release mechanism of the microspheres was controlled by both diffusion and matrix erosion. As a diffusion barrier, PLGA’s properties will significantly affect drug release. Since the PLGA we chose had a smaller molecular weight and shorter polymer chains compared with other commonly used ones, their overall chain mobility is higher than others, so Ticagrelor passes through the polymer matrix faster. In addition, the carboxyl end group in glycolic acid could further improve the hydrophilicity of PLGA, which makes water easy to penetrate into the polymer and brings about the hydration of polymers.
Table 5. Results of Ticagrelor release profile fitting for different mathematical models
Although the explanations of various experimental results indicated that the PLGA was a kind of hydrophobic polymer, it would soften in the aqueous phase. This change leads to a decrease in the mechanical properties of the polymer. Liang et al. have used different ratios of PLGA to explore whether changes in the internal pores of the microspheres affect the dissolution of the drug. Finally, it was observed that during the coagulation process of microspheres with a polymer mixture as a carrier, low molecular weight PLGA may cover a large proportion of pores created by solvent evaporation [Citation25].
3.8. Pharmacokinetic results
Figure 15. Plasma Ticagrelor concentration–time curve (n = 6) after injection of Ticagrelor 30 mg/kg (dissolved in saline [1 mg/mL]) in rats
![Figure 15. Plasma Ticagrelor concentration–time curve (n = 6) after injection of Ticagrelor 30 mg/kg (dissolved in saline [1 mg/mL]) in rats](/cms/asset/76eb6390-5fc7-4bf8-966d-ec6c4803dd14/tdmp_a_1984008_f0015_oc.jpg)
Figure 16. Plasma concentration–time spectrum of PLGA microspheres (250 mg/kg) loaded with Ticagrelor in rats (n = 6)
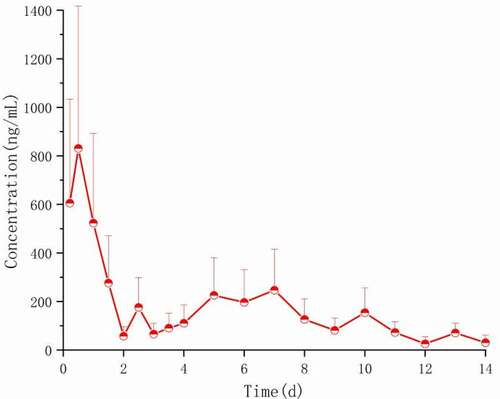
The average blood drug concentration-time distribution after Ticagrelor·HCl solution was injected into the tail vein and Ticagrelor PLGA microsphere was injected into the muscle, as shown in and 16. The main calculated pharmacokinetic parameters are shown in . As can be seen from , the peak concentration (Cmax) of Ticagrelor microspheres in rats reached 830.681 ± 84 ng/mL 1 day after being intramuscularly injected, followed by a linear decline, and then increased slightly on the 5th day, and could still be detected on the 14th day. Compared with the Ticagrelor·HCl solution, the MRT value of Ticagrelor microspheres can be extended to 5.51 dayd, which is 62 times that of the Ticagrelor microspheres. It is further proved that the prepared Ticagrelor-loaded microspheres have good sustained-release properties.
Table 6. The pharmacokinetic parameters of rats after intramuscular injection of Ticagrelor·HCl solution (30 mg/kg) and Ticagrelor PLGA microspheres (250 mg/kg)
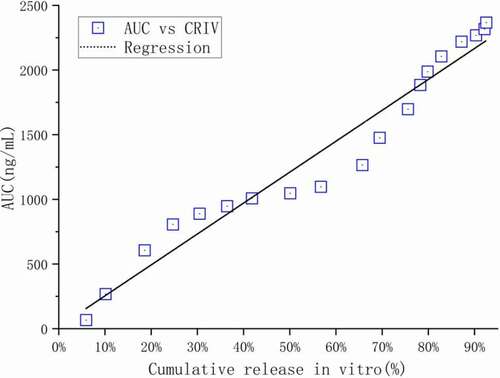
In vitro in vivo correlation (IVIVC) is a mathematical model with predictive ability. The established IVIVC model can provide a basis for exempting bioequivalence research during clinical research on the one hand; on the other hand, it can assist developers in formulating more reasonable release quality standards [Citation26]. As shown in , the in vitro cumulative percentage release at the corresponding time point was significantly correlated with the in vivo pharmacokinetic parameter AUC (R2 = 0.9542). Therefore, the cumulative percentage release of Ticagrelor in vitro can be used to predict the AUC value at the corresponding time point in vivo. Based on the good in vivo/in vitro correlation, the in vitro drug release test can be used to predict the in vivo performance of the corresponding prescription. That is, by using the dissolution test to replace the in vivo bioequivalence test (BE), so as to save time and cost in product development and the entire life cycle of the drug. The exploration of the correlation between in vivo and in vitro release is an important part of the research of sustained-release microspheres. It is the basis and the main basis for establishing a technical platform for the preparation and evaluation of sustained-release microsphere drug delivery systems [Citation27]. The establishment of this in vivo and in vitro release correlation model provides an important way to speculate on the pharmacokinetic process of sustained-release microspheres in animals.
Figure 17. Correlation between the area under the blood drug concentration curve with time in vivo and the percentage of cumulative release in vitro
4. Conclusion
In this paper, PLGA was used as the carrier material, and the improved O/W emulsification solvent evaporation method was used to prepare biodegradable and spherical complete Ticagrelor sustained-release microspheres for injection. The encapsulation rate was as high as 79.09 ± 1.56%, and it could be continuously released in vitro for 14 days. The released data are well in line with the first-level and Weibull models. The sustained and stable plasma drug concentration was obtained after intramuscular injection in rats, indicating that Ticagrelor was absorbed slowly in the body, and a good in vitro–in vivo correlation was obtained. These results indicate that the Ticagrelor sustained-release microspheres, as a new drug delivery method, provide the possibility for effective treatment of patients and strong research support for its extensive clinical application in the future.
Acknowledgments
The authors acknowledge the financial support of the People’s Livelihood Science and Technology Project of Qingdao.
Disclosure statement
No potential conflict of interest was reported by the author(s).
Additional information
Funding
References
- Dlfox B. Clopidogrel and aspirin versus aspirin alone for the prevention of atherothrombotic events[J]. Digest World Core Med J(Cardiology). 2006;142(2):1706–1717.
- Huber K, Hamad B, Kirkpatrick P. Ticagrelor[J]. Nat Rev Drug Discov. 2011;10(4):255–256.
- Li W, Han W, Zhao NA, et al. A novel embolic microspheres with micro nano binary progressive structure for transarterial chemoembolization applications - ScienceDirect[J]. Eur J Pharm Sci. 2020;153:105496.
- Li T, Chandrashekar A, Beig A, et al. Characterization of attributes and in vitro performance of exenatide-loaded PLGA long-acting release microspheres[J]. Eur J Pharm Biopharm. 2021;158:401–409.
- Cz A, Liang YB, Feng WC, et al. Quality by design thinking in the development of long-acting injectable PLGA/PLA-based microspheres for peptide and protein drug delivery[J]. Int J Pharm. 2020;585:119441.
- B B P A, C M A C, D K B, et al. Importance of single or blended polymer types for controlled in vitro release and plasma levels of a somatostatin analogue entrapped in PLA/PLGA microspheres[J]. J Control Release. 2004;96(3):437–448.
- Chu DF, Fu XQ, Liu WH, et al. Pharmacokinetics and in vitro and in vivo correlation of huperzine A loaded poly(lactic-co-glycolic acid) microspheres in dogs[J]. Int J Pharm. 2006;325(1–2):116–123.
- Vlugt-Wensink KDF, De Vrueh R, et al. Preclinical and clinical in vitro in vivo correlation of an hGH dextran microsphere formulation[J]. Pharm Res. 2007;24(12):2239–2248.
- Yanyun H. Jingjing, et al. SN-38-Loaded PLGA microspheres injected intratumorally for cancer: preparation, characterization and evaluation - ScienceDirect[J]. J Drug Delivery Sci Technol. 2019;53:101178.
- Myha B, Ytha C, Cjwb D, et al. Preparation and in vitro/in vivo evaluation of doxorubicin-loaded poly[lactic-co-glycol acid] microspheres using electrospray method for sustained drug delivery and potential intratumoral injection[J]. Colloids Surf B Biointerfaces. 2020;190:110937.
- Ma C, Fu H, Huang Z, et al. Accelerated dissolution method to facilitate in vitro evaluation of risperidone-containing microspheres[J]. Dissolution Technol. 2019;26(2):48–55.
- Sun Y, Long D. Preparation, characterization and in vitro/in vivo evaluation of lovastatin-loaded PLGA microspheres by local administration for femoral head necrosis[J]. Drug Des Devel Ther. 2021;15:601–610.
- Hadi N, Braihi A, Mohammed SK. Effect of flow behavior on the production of PVA/dextrin microspheres. [J].j Controlled release. 2018;7:669–675.
- Hui ZA, Lzh B, Jap A, et al. Microfluidic fabrication of inhalable large porous microspheres loaded with H 2 S-releasing aspirin derivative for pulmonary arterial hypertension therapy[J]. J Control Release. 2021;329:286–298.
- Jyothi N, Prasanna M, Prabha S, et al. Microencapsulation techniques, factors influencing encapsulation efficiency: a review[J]. J Microencapsul. 2010;27(3):187–197.
- Al-Maaieh A, Flanagan DR. New drug salt formation in biodegradable microspheres[J]. Int J Pharm. 2005;303(1–2):153–159.
- Rawat A, Burgess DJ. Effect of ethanol as a processing co-solvent on the PLGA microsphere characteristics[J]. Int J Pharm. 2010;394(1–2):99–105.
- Rouse JJ, Mohamed F, Walle C. Physical ageing and thermal analysis of PLGA microspheres encapsulating protein or DNA[J]. Int J Pharm. 2007;339(1–2):112–120.
- Mauduit J, Bukh. Ordinary, with rt. M. Gentamycin/poly (lactic acid) blends aimed at sustained release local antibiotic therapy administered per-operatively. III. The case of gentamycin sulfate in films prepared from high and low molecular weight poly (DL-lactic acids)[J]. J Control Release. 1993;25(1–2):43–49.
- Liggins RT, Burt HM. Paclitaxel loaded poly(L-lactic acid) microspheres: properties of microspheres made with low molecular weight polymers[J]. Int J Pharm. 2001;222(1):19–33.
- Rawat A, Burgess DJ. Effect of physical ageing on the performance of dexamethasone loaded PLGA microspheres[J]. Int J Pharm. 2011;415(1–2):164–168.
- Tamani F, Bassand C, Hamoudi MC, et al. Mechanistic explanation of the (up to) 3 release phases of PLGA microparticles: monolithic dispersions studied at lower temperatures[J]. Int J Pharm. 2021;596:120220.
- Vasiliki P, et al. On the use of the Weibull function for the discernment of drug release mechanisms.[J]. Int J Pharm. 2006;309(1–2):44–50.
- Wischke C, Schwendeman SP. Principles of encapsulating hydrophobic drugs in PLA/PLGA microparticles[J]. Int J Pharm. 2008;364(2):298–327.
- Wang T, Xue P, Wang A, et al. Pore change during degradation of octreotide acetate-loaded PLGA microspheres: the effect of polymer blends[J]. Eur J Pharm Sci. 2019;138:104990.
- O’Hara T, Hayes S, Davis J, et al. In vivo–in vitro (IVIVC) modeling incorporating a convolution step[J]. J Pharmacokinet Pharmacodyn. 2001;28(3):277–298.
- Andhariya JV, Jog R, Shen J, et al. Development of Level A in vitro-in vivo correlations for peptide loaded PLGA microspheres[J]. J Control Release. 2019;308:1–13.