Abstract
To properly evaluate the effect of government policy we need to be able to determine the individual effects of policy measures and other trends. This can be done in various ways. This article describes several methods for distinguishing the effects of societal trends or specific (government) measures on the emission of CO2 by the electricity generation sector. We found that the CO2 effects attributed to the separate factors depend on the method chosen. This means that when effects of policy measures are reported in the literature, the method of analysis should be indicated. Using a baseline as a reference does not lead to an exemption of this rule.
1. Introduction
The public sector takes a variety of (policy) measures with the aim of reducing energy consumption and the associated environmental burden. To properly evaluate the (cost) effectiveness of these policies and measures there is a need to discern the separate effects. The fact that these types of measures and effects occur simultaneously is a complicating factor. Basically, there is only one trend that can be established with relatively high certainty: the resulting trend in CO2 emissions (measured). Even the choice of a reference situation (with no policy and no measures at all) can be disputed. Some organizations prefer using a baseline for comparison (e.g. CitationEEA 2002), whereas we use a reference situation with frozen efficiency and other references as well. Using a baseline is a suitable and easy way to communicate an approach, in many cases for specifically evaluating policy alternatives. In our case we would like to show other effects with no link to policy as well to compare different structural developments.
As no unequivocal method for policy evaluation has been established, a broad distribution of effects can be obtained depending on the method chosen. The differences arise from the algorithm used for determining the separate effects on the level of emissions, as they cannot be measured. If we are to target policies as effectively as possible, we need to obtain insight into how the calculated effect of a measure depends on the computational method used. This article describes various methods for analysing the effectiveness of policy measures.
The emission of CO2 by the electricity generation sector has been chosen as a case study. Since 1990 electricity production has risen at a faster rate than the amount of CO2 emitted during the generation of this electricity. How can this be explained and what role has policy played in this change? The following analysis does not examine the actual costs of the policies pursued, which is discussed elsewhere (CitationRIVM, 2003). The data for this analysis has been obtained from the CBS (2004).
2. CO2 emissions from electricity production
Since the end of the 1980s Dutch policy has been aimed at encouraging energy savings and reducing CO2 emissions. The production of electricity and associated CO2 emissions are briefly described below.
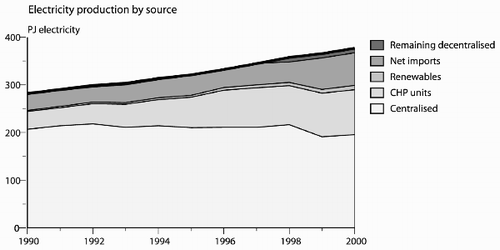
In 2000 total electricity production in the Netherlands was 377 PJ, having risen from 282 PJ in 1990 (Elzenga et al. 2002). For the purposes of this article, the electricity production is divided into:
| 1. | Central generation: production by companies primarily engaged in electricity generation. | ||||
| 2. | Decentralized generation: production by companies for whom electricity generation is a secondary task – mainly combined heat and power units (CHP units). | ||||
| 3. | Remaining decentralized generation: production by companies for whom electricity generation is a secondary task – all non-CHP units. | ||||
| 4. | Renewable generation: production from renewable sources (wind, solar, etc.). | ||||
| 5. | Net imports: the balance of imported and exported electricity. | ||||
shows that the balance in production is shifting from central generation to decentralized generation and imports. Production from renewable sources (solar, wind, etc.) remains limited.
Figure 1. Electricity production by source 1990 – 2000 (in PJ of electricity).
shows the CO2 emissions from electricity generation from 1990 to 2000. Renewable generation and net imports have been allocated no emissions because these sources of electricity involve no emissions on Dutch territory. CO2 emissions are calculated to be 45.1 Mton in 2000 and 41.7 Mton in 1990.
Figure 2. CO2 emissions by energy source (in Mton).
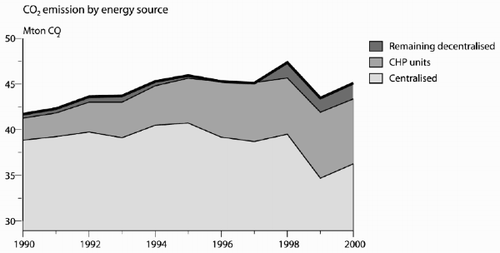
Comparing and , we can see that electricity production is rising much faster than CO2 emissions. The possible causes of this decoupling are:
| 1. | import of electricity; | ||||
| 2. | increased production of electricity by decentralized CHP plant; | ||||
| 3. | more efficient generation by the central power stations; | ||||
| 4. | shift in fuel mix by the central power stations; and | ||||
| 5. | increase in renewable electricity generation. | ||||
There are various methods to determine the effects on CO2 emissions of the above trends. For the purposes of this article the effects have been analysed using the following methods: (1) analysing the effects of each individual trend; (2) composition method; and (3) decomposition method.
The next section looks at the effects of each individual trend separately and then discusses the composition and decomposition methods.
3. Effects of each individual trend
3.1. Effects of increasing net imports
Net electricity imports in 2000 were 68 PJ, compared with 33 PJ in the baseline year of 1990. This rise is attributed to the stepwise liberalization of the energy market, which made it relatively cheaper for the major consumers to import electricity from neighbouring countries (CitationRIVM 2001). But what would CO2 emissions have been if, other things being equal, the extra 35 PJ of imported electricity compared with 1990 had not been imported but generated in the Netherlands?Footnote1 For this study we assumed two different alternatives (references) for the way this electricity would have been generated in the Netherlands: (1) expanding the capacity of the central power stations, but not with units fuelled by blast furnace gas, or (2) a modern combined cycle gas turbine (CCGT) unit (fuelled by natural gas, 55% conversion efficiency).
Ref. 1
As stated above, the central power stations are operated by the production companies primarily engaged in generating electricity. From 1990 to 2000 electricity generation by the central power stations fell from 207 PJ to 195 PJ ( – 6%). In the same period CO2 emissions declined from 29 Mton to 36 Mton ( – 8%). In this situation it is assumed that the amount of electricity that was imported would have been generated by a corresponding expansion of central generating capacity, excluding power stations fuelled by blast furnace gas.Footnote2
Ref. 2
A combined cycle gas turbine (CCGT) consists of a gas turbine and a steam turbine. Electricity is generated by the gas turbine and the hot exhaust gases are used to fire the steam turbine (CitationGijsen & Spakman, 2001). This “double” generation can achieve efficiencies of 55% or even higher.
Comparing these two reference systems with the avoided imports, we calculated a CO2 saving of 6.1 Mton for the central power stations “without blast furnaces”, and a saving of 3.6 Mton for modern CCGT units. This makes clear that the difference resulting from the choice of reference of both alternatives is enormous and therefore very important if the effect of net imports is reported.
3.2. Effect of the increase in decentralized CHP units
Electricity production from decentralized CHP units rose from 39 PJ in 1990 to 98 PJ in 2000 and CO2 emissions from these plants rose from 11 to 20 Mton. Because CHP units supply heat as well as electricity, we have to decide how to allocate the emissions from CCGT units: to the heat produced or to the electricity. For this study the following rules for allocating these emissions were used: if the CHP units had not existed, the heat would have been supplied by a steam generator burning natural gas with an efficiency of 85% (CitationElzenga et al. 2002). The extra emissions from a CHP unit resulting from the generation of electricity as well as heat are allocated to the electricity.
These emissions were then compared with the emissions that would have resulted if the decentralized CHP plants had generated electricity at a constant level of 39 PJ per year. For the alternative to generation by the decentralized CHP units, the same two situations are assumed as for imports (central power stations not fuelled by blast furnace gas and CCGT units). The calculated CO2 savings for 2000 are 6.1 Mton when the reference is central power stations not fuelled by blast furnace gas, and 1.6 Mton when the reference is modern CCGT units. Again, these two options give very different results.
3.3. Effect of an increase in renewable electricity
The effect on CO2 emissions of an increase in the amount of renewable electricity was determined as follows. In 2000 the amount of renewable electricity generated was 9.2 PJ, compared with 2.6 PJ in 1990 – a rise of 7.6 PJ. But what would CO2 emissions have been, other things being equal, if this extra 7.6 PJ had not come from renewable sources but had been generated in “another way”. For this “other way” we again examined the same situations as in the case of imports.Footnote3 The result in 2000 is a saving of 1.2 Mton when the reference is the central power stations not fuelled by blast furnace gas, and 0.7 Mton when the reference is modern CCGT units.
3.4. Effect of a change in the fuel mix by the central power stations
illustrates the trend in CO2 emissions from the central power stations, per fuel, from 1990 to 2000.
Figure 3. CO2 emissions per fuel from 1990 to 2000.
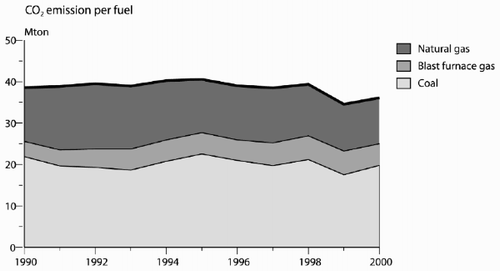
A notable feature is the difference in emissions from the various fuels compared with their share in production. Blast furnace gas, for example, accounted for 6% of fuel used in 2000 but was responsible for 14% of emissions. But what would CO2 emissions have been if, other things being equal, the mix of fuels consumed by the central power stations during the period 1990 – 2000 remained the same as in 1990?
CO2 emissions in 2000 were 36 Mton. If, all other things being equal, there had been no shift in the mix of fuels, emissions would have been 34 Mton. This means that the shift has had a detrimental effect on CO2 emissions. The explanation is that there has been a shift in the mix of fuels consumed by the central power stations from natural gas to coal and blast furnace gas, both of which have higher emission factors than natural gas. This shift to “dirtier” fuels was probably influenced by the relatively high price of natural gas.
3.5. Effect of the increase in efficiency of the central power stations
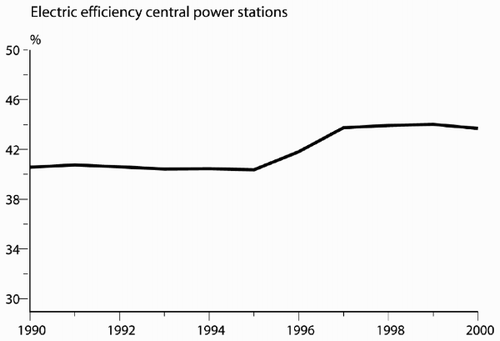
We turn now to the question of what the CO2 emissions would have been if power station efficiency had remained constant from 1990 to 2000.
shows the trend in electric efficiency of the central power stations. From 1990 to 2000 efficiency rose from 41% to 44%. In 2000 the effect of the efficiency improvements on CO2 emissions was a fall in emissions of 2.8 Mton.
Figure 4. Trend in electric efficiency of the central power stations.
4. The composition and decomposition methods
The “individual effects” described above are determined by assuming that certain changes would not have taken place and others would. However, if a number of trends occur simultaneously they will influence each other. Composition/decomposition methods assume simultaneous occurrence of various trends, the outcome being determined by the chosen sequence.
The composition method starts from the actual situation in which all effects are included and then calculates what the emissions would have been if effect A had not occurred, and then if effects A and B had not occurred, etc. With this method, every effect is being compared with another baseline. The baseline of effect A is “the real world”, the baseline of effect B is “the real world + effect A”, etc.
The decomposition method starts from the situation in which no effect besides the growth in demand for electricity is included (“frozen efficiency”), and then calculates what the emissions are if only effect A had occurred, and then if effects A and B had occurred, etc. With this method, every effect is being compared with another baseline too. The baseline of effect A is “frozen efficiency”, the baseline of effect B is “the frozen efficiency + effect A”, etc.
4.1. Composition method
Starting from the actual situation, two different sequences of the trends described above were analysed.
Sequence 1:
| 1. | the CO2 emissions from the central power stations in the actual situation; | ||||
| 2. | actual emissions without a change in fuel mix; | ||||
| 3. | ditto, without efficiency improvements; | ||||
| 4. | ditto, without increase in renewable electricity; | ||||
| 5. | ditto, without growth in CHP; | ||||
| 6. | ditto, without increase in imports. | ||||
The last series in the above sequence represents the situation in which no “trend” at all would have occurred.
The increase in renewable electricity, CHP and imports were compared with the situation in which these trends would not have occurred. But even in this case the situation described in the previous section applies. Therefore, because we do not know what would otherwise have occurred, a number of options are possible. The reference situation for calculating these changes was “proportional expansion in capacity of the central power stations not fuelled by blast furnace gas”.
The above sequence (sequence 1) was then compared with the reverse order (sequence 2), i.e. beginning with imports and ending with fuel mix (see ). This analysis revealed that the total effect could vary by more than 2 Mton by choosing a different sequence. The reason for this is that every step influences the outcome of the next step in the sequence, because the baseline or reference situation can be different. So if you reverse the sequence, the baselines of every step will also be different. Logically, the influences of the same steps in the different sequences will not be the same. For example, a striking result is the large difference in the effect of efficiency improvements in the central power stations. The explanation for this is that in sequence 2 first the central generating capacity is expanded and then the efficiency gain is calculated for this larger capacity. While in sequence 1 first the efficiency gain is calculated and then the central generating capacity is expanded. The choice of sequence affects the choice of baseline(s). The efficiency gain in sequence 1 affects therefore a smaller central park than in the case of sequence 2, resulting in a smaller effect in sequence 1.
Table I. Effect of various measures on CO2 emissions (2000 vs 1990, in Mton) under the composition method.
4.2. Decomposition method
The decomposition method starts with a reference situation in which there are no effects except the growth in demand for electricity.Footnote4 Then emissions are calculated for situations in which only effect A, and then if effects A and B, etc., occur.
The choice of sequence of effects is again an arbitrary one. There is no methodological preference for one sequence or another. But some trends affect the average emission factor of the central power stations and others do not. If, for example, the effect of imports is calculated before the effect of a shift towards greater use of coal, the increase in imports is compared with a different emission factor than if the shift to greater use of coal is calculated first, followed by the increase in imports. Therefore, it would seem logical to calculate the effects of the trends assumed to have no direct effect on the average emission factor of the central power stations after each other in the sequence. These are the effects of imports, the shift towards CHP units and the increase in renewable electricity. Otherwise, for example, the reduction in central electricity production due to electricity imports might be compared with the emission factor for the central power stations in 1990, while the reduction due to an increase in renewable electricity is compared with the emission factor corrected for the efficiency improvement in 2000. The sequence chosen for the Environmental Balance 2001 was:
| 1. | increase in imports; | ||||
| 2. | increase in number of CHP units; | ||||
| 3. | increase in renewable electricity; | ||||
| 4. | efficiency improvements by the central power stations; | ||||
| 5. | fuel mix of the central power stations. | ||||
When attempting to evaluate government policy another sequence is preferred. The effects are subtracted from the baseline reference (frozen efficiency) in the order in which policies have had an increasing influence on the relevant trends. For example, no single policy has been pursued that has stimulated imports, but there has been a policy pursued to promote production from renewable sources and the introduction of CHP units. By first removing trends from the reference situation that have not been influenced, or hardly influenced, by policy, the total influence of policy can be revealed. This leads to the following sequence:
| 1. | increase in imports; | ||||
| 2. | fuel mix of the central power stations; | ||||
| 3. | efficiency improvements of the central power stations; | ||||
| 4. | increase in number of CHP units; | ||||
| 5. | increase in renewable electricity. | ||||
The difference is the result of choosing a different calculation sequence, which leads to comparing the steps with different baselines. The difference in the effect on emissions of the trends that policies have focused on most (renewables and CHP) between the “Environmental Balance” sequence and the “Policies” sequence is 1.1 Mton in 2000 ().
Table II. Effect of various measures on CO2 emissions (2000 vs 1990, in Mton) under the decomposition method.
5. Comparison of methods
The analysis clearly shows that effects that can be ascribed to policy measures and trends can be determined using a variety of methods. Each method gives significantly different results (see ).
Table III. Comparison of various methods for calculating CO2 emission reductions in 2000 compared with 1990.
Whatever method is chosen, CO2 emissions from electricity generation in 1990 – 2000 were influenced mainly by the shift towards decentralized CHP and the rise in imports. An important finding is that the changes in fuel mix of the central power stations caused a rise in emissions because this shift was from natural gas to coal and blast furnace gas.
The calculation method “composition, sequence 2” gave a reduction in CO2 emissions 9.4 Mton greater than the “individual effects, reference CCGT”. The difference between the composition and decomposition method is about 4 Mton. The choice of reference in the “individual effects” method made a difference of 7.4 Mton.
6. Conclusions
A number of conclusions can be drawn with regard to the application and utility of the various methods for determining the effects of trends relevant to policy measures. The “individual effects” method is particularly useful for estimating effects separately, with the associated margins of uncertainty, for example the incidental rise in imports in 1990. The composition method, in effect, defines a theoretical reference situation if the various effects are added up. This can be a useful comparison with the “frozen efficiency” reference situation. The decomposition method is useful for estimating combined effects. The Environmental Balance sequence can be used for historical analysis and shows the effects over time with reference to the “1990 frozen situation”. The Policies sequence can be used when the central issue is the influence of energy or environmental policy.
None of the three methods compared has a computational advantage. As a result, a number of different outcomes can be obtained depending on the choice of method and reference situation. Statements on the effects of policy measures should, therefore, be made with caution and interpreted with care. The relevance of the difference in outcome becomes clear when the cost-effectiveness of government policies is analysed. Small changes in reduction effects can lead to substantial variation in the costs per tonne of CO2 reduced.
Notes
According to international agreements, the emissions belonging to imported electricity are allocated to the country in which the electricity was generated: more imports means fewer emissions allocated to the Netherlands and thus a greater reduction.
Power stations fuelled by blast furnace gas use a waste product (blast furnace gas) from the metal industry as a fuel. If less electricity is imported the metal industry will not suddenly produce more metal. It is, therefore, more logical to assume that the central power stations not fuelled by blast furnace gas would increase production than that production would increase proportionally at all power stations.
It seems logical to assume that if this electricity had not been generated from renewable sources, the decentralized CHP production would have risen because renewable electricity is mainly generated in decentralized plants. In this study, however, it is assumed that CHP capacity is determined by heat supply. Less renewable electricity would not then automatically lead to more CHP units.
This is the level of emissions if only the demand for electricity influences the level of emissions – also called the “frozen efficiency”.
References
References
- CBS 2004 Statline. Voorburg: Statistics Netherland. Available at: http//www.statline.ne
- EEA 2002 Environmental issue report no. 31 Copenhagen: European Environment Agency
- Elzenga H Koots J et al. 2002 Warmtekrachtkoppeling in Nederland: waarneming, beleidsontwikeling, brandstofbesparing en CO2-reductie CBS EnergieMonitor 2001/4
- Gijsen A Spakman J 2001 DAMES. Een bestand voor de macro-emissies van het Nederlandse elektriciteitsaanbod in 1995, 1998, 2010 en 2030 Bilthoven: Rijksinstituut voor Volksgezondheid en Milieuhygiëne
- RIVM 2001 Milieubalans 2001 Het Nederlandse milieu verklaard Bilthoven: Rijksinstituut voor Volksgezondheid en Milieuhygiëne
- RIVM 2003 Milieubalans 2003 Het Nederlandse milieu verklaard Bilthoven: Rijksinstituut voor Volksgezondheid en Milieuhygiëne