Abstract
Madagascar is well-known among conservationists for both its unique forest ecosystems and its alarmingly high rates of deforestation. This paper studies the factors driving deforestation in Madagascar using a nation-wide data set of commune-level variables. The analysis suggests that higher population and fertility rates were associated with higher deforestation in the moist forest region in the 1990s. Deforestation was lower in vanilla producing areas and higher in coffee producing areas. This finding runs counter to the theory that higher prices for crops drive deforestation, since prices for vanilla growers in Madagascar were more favourable than for coffee growers. Provincial road access also led to more forest loss, but other road and market access variables were insignificant. In the dry and spiny forest areas, market-oriented maize production plays a significant role. The study also makes a methodological contribution by addressing the potential bias introduced by missing data due to cloud cover in satellite images.
Keywords:
1. Introduction
Known both as a biodiversity hotspot and as an ecological disaster area, the debate surrounding the causes of and potential solutions for high deforestation in Madagascar has drawn in numerous international conservation groups, development/donor organizations, and academic institutions, in addition to government agencies, politicians and community-based organizations. Understanding the causes of deforestation has become even more important since the 2003 World Parks Congress, where the President of Madagascar pledged to more than triple the country's protected area from 1.7 to 6 million hectares over 5 years (U.N. Wire Citation2003). This study attempts to inform the debate by presenting a unique nation-wide, socio-economic analysis of the relationship between forest loss in the 1990s and commune (county) level characteristics, such as population, agricultural activities and road access. This exceptional data set also allows us to investigate how deforestation differs across different forest types in Madagascar.
The issue of deforestation in the tropics has received a great deal of attention in the economics literature, not only because of increasing public interest, but also because of the increasing availability of land cover data and other geo-referenced data layers, such as soil types, rainfall, elevation and temperature. The land cover data and forest loss estimates usually come from satellite images, which can be obscured by cloud cover or shadow for much of the year in the world's rainforests. The common practice of dropping data obscured by clouds from an analysis assumes that cloud cover is random and not associated with forest loss or forest cover. Butler and Moser (Citation2007) reject the independence of clouds from observed land type in statistical tests using data from Madagascar – even when cloud cover obscures a small percentage of land. The methodological contribution of this study is thus to correct for the potential bias introduced by the missing satellite images.
The article is organized as follows: The second section reviews the major empirical findings in the deforestation literature. The third and the fourth sections describe the data and the methodological issues. The final sections of the article present the estimation results and conclusions.
2 Review of previous work
2.1 Deforestation in Madagascar
The causes and scale of deforestation in Madagascar are hotly debated. Deforestation is most often attributed to the slash and burn cultivation technique known as tavy and other burning practices, such as for pastureland. Tavy is a traditional upland rice production system, practiced mainly along the eastern escarpment, in which forest is cleared and planted in rice the first year, then with rice or other crops for several more years. When the soil becomes too poor to support crops (usually after 3 – 5 years), more land is cleared and the process starts again.
Jarosz (Citation1993) disputes the claim that tavy has historically been the principal cause in an analysis of deforestation during the French colonial period. She finds that French logging concessions and the promotion of cash crop plantations contributed to deforestation both directly through land clearing and indirectly through changing migration and long-term land use practices. The frequently cited massive scale of deforestation in Madagascar has also been disputed. Kull (Citation2000) finds that the long-held assumption that as much as 90% of the island was once forested has been greatly exaggerated. While he does not dispute that current rates of deforestation and erosion are high, he, too, concludes that traditional practices are unfairly blamed for most of the losses.
Most studies, including those cited above, are primarily concerned with the moist forests found in the eastern and northeastern parts of the island (other examples include Green & Sussman Citation1990; Mercer & Kramer Citation1994; Freudenberger et al. Citation1999; McConnell Citation2002; Agarwal et al. Citation2005). While the moist forests have received most of the attention from conservation groups, the spiny forest ecosystem is now being recognized as equally unique and possibly more threatened. Found primarily in the southern province of Toliara, there is evidence that the rise of maize production for export in the 1990s was one of the principal causes of deforestation in southern Madagascar (Minten & Méral Citation2006). Much less is known about the dry forest areas found in the west and north of the country and biologists are still in the early stages of studying these ecosystems.
2.2 Theories of tropical deforestation
Most recent analyses of deforestation follow Chomitz and Gray (Citation1996) who model deforestation as a choice made by a profit-maximizing farmer to clear or not to clear land. This work draws heavily on the ideas of von Thunen's theory of radial markets. Areas closest to a city would tend to grow higher value, perishable vegetable crops, areas at a greater distance would grow grains for the city market, and the most remote areas would find it unprofitable to serve this market. Major factors in the farmer's decision would thus be access to markets (measured by road access and/or quality and distance to market), the prices of the products that could be grown on the land (or the price of timber) and the productivity of the land. In Chomitz and Gray, the effect of roads and market access would make growing food for larger markets more attractive and thus would unambiguously lead to more deforestation. Roads could also make it easier for migrants to move into the area. More generally, areas with better access to markets should have higher forest loss.
Lack of secure property rights can affect deforestation in two ways. First, lack of tenure may make investments in currently cultivated land less attractive relative to clearing new land. However, proprietors of large tracts of forested land, who might otherwise lease this land out to be cleared for logging or cultivation, may avoid doing so under insecure tenure rights out of fear of losing their claim on the land. Thus, under this scenario forest loss would be lower than under secure tenure rights.
The profit maximization framework has several limitations. First, it does not provide insight into the role of population or population growth. Under this model, higher profits to clearing could attract migrants and increase the population, but there is no role for initial population levels or fertility. However, in areas where most people rely on farming for their livelihoods, more people (all else equal) means more land is needed and higher growth of the population means more land will be needed in the future. Another limitation of the profit maximization framework is that it does not allow for differing practices across areas or ethnic groups, since profit is the only driver of land clearing decisions. Yet, different groups may have different traditional practices (pastoralism, shifting cultivation, land tenure regimes, etc.) that can profoundly affect deforestation.
2.3 Empirical analyses of deforestation
Income, population growth and density, agricultural prices and yields, shifting cultivation, agricultural exports, returns to logging, roads, tenure, size of forest and institutional factors are the most common explanatory variables used in analysis (Barbier Citation2001). Agriculture and forest cover should be closely linked, because clearing for agricultural use is the primary cause of deforestation in many developing countries. Extensive agricultural practices, such as slash and burn agriculture, are widely blamed for forest loss, although the empirical evidence demonstrating this is mixed. Certain perennial cash crops, once established, might reduce deforestation as farmers devote more of their time and resources to these crops and fewer to shifting cultivation. Intensification of agricultural production using modern inputs likewise might reduce pressure on forests by making shifting cultivation less attractive. However, the net effect of modern agricultural technologies is mixed (Angelsen & Kaimowitz Citation1999, Citation2001), because profitable cash cropping or intensification could encourage in-migration and the clearing of more land. In a review of over 140 studies, Angelsen and Kaimowitz (Citation1999) find that higher crop prices and lower wages lead to more deforestation.
Rainfall, slope and soil quality matter when plots are cleared for agriculture. Both Deininger and Minten (Citation2002) and Cropper et al. (Citation2001) find that population density and market access variables explain relatively little of the probability that a plot of land will be cleared and that plot-specific characteristics such as slope, elevation and soil type explain most of the variation. This is in contrast to Chomitz and Gray (Citation1996) who find a strong effect of road and market access in addition to plot characteristics. Traditional property rights theory holds that people have more incentive to be good stewards of the land when they have clearly defined ownership rights over that land. Deacon (Citation1999) found that land ownership security was statistically significantly associated with less forest lost. However, Deininger and Minten (Citation2002) found less deforestation in areas with communally (as opposed to individually) held property rights in Mexico and Angelsen and Kaimowitz (Citation1999) conclude that the effect of tenure is ambiguous.
Several studies find a greater distance to a market, road, or city is associated with less deforestation. Pfaff (Citation1999) uses road density in addition to distance measures and finds that greater road density and shorter distance to the capital are associated with higher forest loss. Cropper et al. (Citation2001) find that the probability of deforestation increases with proximity to paved roads and markets and Agelsen and Kaimowitz (Citation1999) find that more roads tend to lead to more deforestation. However, it is also possible that people in more isolated areas have fewer income earning opportunities and rely more heavily on shifting cultivation and consumption of forest products. Freudenberger and Freudenberger (Citation2002) argue that in areas accessible only by a train line in Madagascar, loss of train service would lead farmers to abandon semi-permanent coffee and banana plantations and revert to extensive food crop cultivation based on slash-and-burn methods.
Population captures both the demand for forest or agricultural products and the supply of labour for forest clearing and cultivation. A higher population is likely to lead to increased deforestation simply because there are more people to cut down trees and to generate demand for primary products. If people are clustered into towns and cities, we might observe less deforestation. Foster and Rosenzweig (Citation2003) find that local demand matters less when forest goods are traded outside the area. In a review and analysis of 152 case studies from around the world, Geist and Lambin (Citation2002) find that population and shifting cultivation are not the single factor drivers often suggested, but that broader economic forces and local and national institutions work in combination to produce a more complex picture.
The relationship between poverty and deforestation is frequently studied, but not well understood. Despite a lack of empirical evidence, forest clearing is perceived to be primarily an activity of the poor (Cavendish Citation2000), because they have few other income generating opportunities and are forced to clear marginal land for cultivation. Deininger and Minten (Citation1999) find evidence of greater deforestation in areas of higher poverty in Mexico. However, the opposite may be true if the poor are occupied with their daily struggles and the relatively wealthy residents can hire labour to clear land. In two villages bordering the rainforest 35 km west of Fianarantsoa in Madagascar, Freudenberger et al. (Citation1999) find that the relatively well-off families have the resources to clear land in the forest for permanent settlement of their offspring, while poor families cope with insufficient food production through seasonal out-migration and gathering non-timber forest products such as honey and fresh-water shrimp. It should be noted that heretofore all of the studies in Madagascar have focused on a single region or even a single forest and most of the studies in other countries have similar data or take nationally representative samples. The following section describes the unique, nation-wide data set used in the present study.
3 The data
The unit of analysis in this study is the commune – the smallest administrative unit in Madagascar and roughly equivalent to a township or county. This study combines four data sources with nation-wide coverage at the commune level. Conservation International initially assembled the land cover data using Landsat images at a 30-m resolution based around the years 1990 and 2000.Footnote1 The World Wildlife Fund analysed additional images in 2003, in order to reduce the area obscured by clouds. The land cover data consist of three categories: forest, non-forest, and cloud/shadow. shows the percent of the total area covered by clouds (i.e., the amount of land that cannot be classified because of clouds on either date). The cloud cover not only makes it difficult to accurately estimate forest cover and forest loss, but it can also potentially introduce bias into the analysis. This issue is discussed in detail in the next section.
Figure 1. Percent of total area in cloud cover from satellite data.
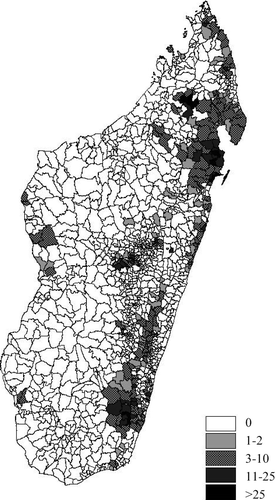
presents the estimates of forest cover and forest loss based on different assumptions of what lies under the clouds and shows the area forested in 1990.Footnote2 The data are split into three ecological zones based on the predominant forest type: moist, spiny and dry. These zones can be seen in . The total observed (i.e., visible) forest loss in the 1990s was nearly 1 million hectares, or about 9.7%. The possible range of forest loss is from 9.3 to 15.4% nationally. While clouds obscure only a small fraction of the total area – only 1.6% of a commune's area on average – they can make a large difference in the estimates of forest loss. This is particularly true in the moist forest area, where forest loss estimates range from 9 to 19%. The cloud problem is smaller in the dry forest area when the forest loss estimates range from 8.7 to 10.3%. Clouds obscure very little of the spiny forest region and thus have almost no impact on the estimates.
Figure 2. Forest cover in 1990 in hectares.
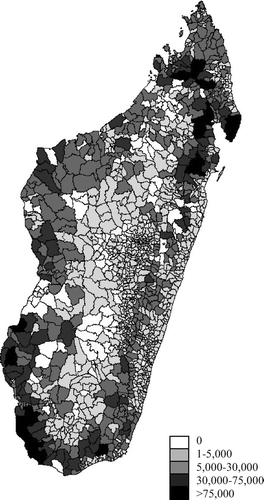
Figure 3. Predominant forest types.
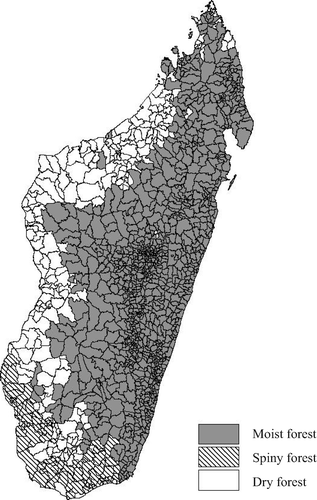
Table I. Forest and forest loss estimates.
The mangrove forests represent a small portion of the total forested area and are scattered over 143 communes, mostly on the western and northern coasts. The mangrove forests are included in the above forest numbers, which are geographical divisions, but the data also allow me to separate out the mangrove forest. In the areas visible in the satellite images, about 2.5% of mangrove forests were lost. If we assume that all mangrove forest observed in 1990 but obscured by cloud in 2000 was actually deforested, as much as 5.8% of mangrove forest could have been lost.Footnote3
The main source of socio-economic data is the 2001 Commune Census conducted over a 3-month period in collaboration between Cornell University and the Malagasy agricultural research institute (FOFIFA). The survey was conducted at each commune's administrative centre and included a total of 1385 communes – all but 9 functioning communes. The remoteness of some communes and the general lack of data at the national level meant that little was known about the spatial distribution of public goods and services, prices, or economic activity prior to this study. Most of the commune survey questions, such as those concerning local prices, transportation, access to various goods and services, major economic activities, and community perceptions of existing conditions, were answered by a focus group composed of residents of the commune. Parts of the survey included retrospective questions that provide us with information on conditions in the commune prior to 2001.
The 1993 population census is the most recent nationwide census currently available in Madagascar. Information from this census includes population figures by gender and various age groups, fertility rates, literacy and schooling rates, employment figures, and percent of the population with access to services such as electricity and running water.Footnote4 Estimates of poverty and inequality were constructed by the World Bank (Mistiaen et al. Citation2002). These spatially disaggregated poverty estimates combine information from a large nationally representative household survey conducted in 1993 and the population census using small area estimation techniques (Elbers et al. Citation2003).
summarizes the major variables of interest by type of forest (including no forest). Population density in Madagascar is relatively low, with a commune average of 123 inhabitants per square kilometre and 80 for communes with forest. The population growth rate, however, is among the highest in the world, estimated at 3.1 percent in 1998 (World Bank Citation2004). Markets are generally poorly integrated (Moser, Barrett & Minten Citation2006), and thus local demand and supply are likely more important factors for deforestation than national effects. Dry forest areas tend to have much lower populations and population density. The fertility rate is highest in the moist forest regions. Mean income is lowest and the poverty rate is highest in the spiny forest region. Land titles are much less common in the moist forest areas than others. Rice is grown in all parts of the country, but less prevalent in the spiny forest areas where maize dominates. Vanilla and coffee production takes place almost exclusively in the moist forest regions. The analysis of deforestation in section 5 uses the variables discussed above to explore the relationship between commune-level characteristics and forest loss. However, before proceeding to the analysis, there are a few methodological issues that will be addressed in the next section.
Table II. Descriptive statistics – commune means (standard deviations) by forest type.
4 A methodological note – addressing the cloud cover in satellite images
An important – yet heretofore overlooked – complication in econometric analyses of deforestation in the tropics arises due to cloud cover in the satellite data. If cloud cover randomly occurs over the landscape, then the estimates of forest loss will be unbiased. However, if clouds are related to forest, certain geographical features, or to certain parts of the country, then this might bias the estimates and the any analysis using these estimates. In addition to natural correlations between clouds and land, these correlations can also be created by the researcher analysing the satellite images. Because it is expensive and time-consuming to analyse the images, researchers might focus on reducing the cloud cover over areas of greater ecological concern or where he or she thinks deforestation is most likely to occur.
Few studies of deforestation acknowledge or discuss problems with cloud cover or discuss how the forest cover and forest loss estimates were derived, despite the fact that cloud-free satellite images are difficult to find for many of the world's rainforest areas (Tucker & Townshend Citation2000; Asner Citation2001; Tole Citation2002).Footnote5 Dropping the missing observations from the sample or imputing missing values seem to be the most common approaches this problem. However, ignoring missing data or imputing values could potentially generate biased estimates or spurious correlations. Using tests of the property of independence of irrelevant alternatives, Butler and Moser (Citation2007) easily reject the hypothesis that cloud cover is independent of the observed amount of a particular land type in the Madagascar data. This implies that the missing observations cannot simply be dropped (or imputed) and that some sort of correction is needed.
One possible way to handle the cloud cover problem is to treat it as one of selection bias. Sample selection models are generally used when certain sub-groups are systematically more likely to be missing from the sample. In the present case, the state of interest is forest loss, which is analysed conditional on the state of the cloud cover. In the first stage, a dummy variable equalling one if the commune is cloud-free is the dependent variable in a probit estimation. The Inverse Mills Ratio (IMR) is computed for each observation (Greene Citation1997). The IMR is then used as a regressor in the second stage to control for the unobserved process generating non-random cloud cover in the data. This variable provides us with a convenient way to test the independence of the second stage from the first. If the coefficient on the IMR is statistically significantly different from zero, this indicates that estimating the second stage separately leads to inconsistent estimates.Footnote6 Finally, because there are also a significant number of communes with zero estimated forest loss, I use a Tobit estimator and bootstrap the standard errors.Footnote7
5 Results
On the basis of previous findings and models in the literature, in the analysis that follows I test the relationship between deforestation at the commune level and variables capturing land tenure, population, population growth, access to national and provincial roads and distance to cities, participation in agriculture and principal crops. I also include a dummy variable for communes in the eastern part of the country because this is the area where tavy is thought to be widespread. Other variables include area forested in 1990, total area of the commune, dummies for five of the six provinces, ethnic composition of the commune, mean rainfall and mean elevation.
The different forest types in Madagascar represent vastly different climates and land use potential, and the causes of deforestation may differ significantly by type. Therefore I treat moist forest separately from the dry and spiny forest.Footnote8 Mangrove forests, a small subset of the total forests, are also treated separately. For each estimation, the number of hectares of forest lost is the dependent variable.
reports the results for the moist forest area.Footnote9 The first estimation includes provincial dummies, while the second equation uses ethnic composition of the commune. The ethnic composition of an area may be an important factor in deforestation if groups have different agricultural and land use traditions. Minten and Méral (Citation2006), for example, find that areas dominated by the Mahafaly ethnic group experienced more deforestation in the spiny forest region.Footnote10
Table III. Causes of deforestation in the moist forest region∗
The initial commune population and population growth (as measured by fertility rates) are both associated more forest loss, while the population density (the number of people per square kilometre) has no significant effect on deforestation. Areas lacking land titles experienced less deforestation. While this finding seems to contradict property rights theory, availability of land titles likely reflects a higher demand for land. The only significant market access variable is provincial road access in the commune, which is associated with more deforestation.
Areas where vanilla was a major crop at the beginning of the 1990s saw less forest loss, while coffee growing areas saw more. This runs counter to the theory that higher prices for crops will increase deforestation since vanilla prices and market liberalization benefited vanilla producers, while coffee producers saw lower prices for much of the 1990s. It is possible that since both of these crops take years to grow, lower prices encourage farmers to abandon plantations and clear new land for other crops. Communes reporting a higher percentage of their rice exported from the commune experienced less deforestation. This result is also some what counterintuitive. It may be that these areas have long since converted all lowland areas to rice fields and there is no pressure to encroach on the forest hillsides. In terms of geographic and climatic variables, areas with higher rainfall, higher elevation and proximity to the coast experience more deforestation. Consistent with Minten and Méral's findings in the spiny forest, Mahafaly areas are associated with significantly more deforestation. They explain the finding by noting that the Mahafaly rely heavily on agriculture and commonly practice slash-and-burn (Minten & Méral Citation2006). Tanala areas saw less deforestation, but this effect is small in magnitude in comparison to the Mahafaly.
The results for the dry and spiny forests are found in . For the dry-spiny forest area estimation, the provincial dummies are omitted from this estimation because these forest types are only found in the two western provinces. There are fewer statistically significant results in this estimation. Population and fertility no longer have significant effects (although population is significant at the 15% level in the first estimation). The findings in the Minten and Méral study are confirmed in the second estimation, as there is more forest loss in areas with higher maize exports and higher percentages of Mahafaly.
Table IV. Causes of deforestation in the dry and spiny forest regions.
As mentioned previously, the IMR can be used to test whether the clouds in the satellite images can bias the results. In the case of the moist forest, the IMR is large, positive and statistically significant at the 5% level, indicating positive selection bias introduced by cloud cover in models not properly controlling for the non-random nature of the data generating process. The positive selection indicates that clear satellite images are associated with more forest loss. One possible explanation is that researchers worked harder to obtain clear images in deforestation prone areas. However, the IMR has the opposite sign (and is also statistically significant) in the dry and spiny forest estimation.
presents the results for the mangrove forests. Because mangrove forests are found along the coasts and are in only 96 communes, I omit elevation, rainfall, the provincial dummies, and others from this estimation. Other variables, not in , such as ethnic composition and the IMR, were likewise not significant in other estimations. This is likely due to both the small sample size and the fact that the commune-level variables may not be significant determinants of the small mangrove forests within them. Nevertheless, there are two results in particular worth mentioning. Higher fertility rates and higher population density are associated with more forest loss.
Table V. Causes of deforestation in the mangrove forests.
It should be noted that there are several potential endogeneity problems with the preceding analysis that could complicate interpretation of the results.Footnote11 Where possible, I used variables from the early 1990s that predated the deforestation studied here. While this does not eliminate the problem, it does at least avoid the possibility for reverse causality for those variables. Unfortunately, valid instruments for such factors as roads and population are difficult to identify. In the future, if the government undertakes another population census, updated satellite images could be combined with the 2007 commune census of Madagascar to construct a panel of communes that can eliminate some of these problems. One important endogeneity concern is that population may be higher where there is higher agricultural potential and it therefore may be the underlying agricultural potential driving forest loss, not the population numbers per se. While this is a valid concern and one must be careful to ascribe causality here, the population and income data come from the 1993 population census, so one can at least conclude that areas with higher initial population and fertility had higher rates of forest loss. From a policy perspective, this result may be most useful as a tool for predicting where deforestation is likely to be higher in the future and serve as a guide for where intervention is most needed.
6 Concluding remarks
Using multiple data sources at the commune level and looking at the period 1990 – 2000, this study presents a unique, nation-wide socio-economic analysis of deforestation in Madagascar. I find that population and fertility rates were strongly related to deforestation in the 1990s in the moist forest areas. It seems that as long as the majority of people depend on agriculture for income in a rapidly growing population, forest loss will likely be hard to combat. Even the most sustainable intensive crop production methods require more land as more people enter the agriculture sector.
The effect of cash crops is ambiguous. Coffee growing areas experienced more deforestation, while vanilla growing areas experienced less. This result may indicate that if a crop is sufficiently profitable, farmers will focus on existing plantations and will not need to cut forest to grow other crops. Traditional land-use practices may also play a role in deforestation. Deforestation is higher where the Mahafaly ethnic group is present in both the moist and dry/spiny forest areas. While this may be explained by a more heavy reliance of this group on agriculture in general and slash-and-burn practices in particular, further research is needed to better explain this relationship. Contrary to traditional property rights theory, areas lacking formal titles experienced less deforestation. This likely reflects the fact that formal titles will be demanded in areas with more migrants and a higher demand for land.
Roads and market access are frequently blamed for deforestation, but I find the relationships to be more complex. Provincial road access led to more forest loss, but national road access and distance to cities had no effect. Furthermore, areas that market significant amounts of their rice production actually experienced less forest loss. In the dry/spiny areas, maize exports increased forest loss – a finding consistent with other studies.
Finally, it should be noted that poverty (or wealth) does not appear to play a significant role in deforestation in Madagascar. This contradicts the conventional wisdom in some circles that poverty is the major cause of deforestation and is an important finding for policy makers who rely solely on local development projects to reduce pressure on the forests. While promoting rural economic development and improving access to markets must remain top priorities for the government of Madagascar, it should be clear that these strategies will not necessarily help conservation efforts and should be monitored to make sure that they do not actually harm these efforts.
Acknowledgements
The author thanks the Conservation International for the original land cover data, the World Wildlife Fund for their support of this research, Tom Allnutt of WWF for his work on the data, Chris Barrett and J.S. Butler for their input, and the participants of the March 2004 workshop, “Développement de la vision de la biodiversité du Programme Ecorégional Ala Atsinanana,” for their feedback and comments.
Notes
1. Because of the difficulty in obtaining cloud-free images in certain areas, some images come from years before after the base years.
2. We observe one of the three categories for each pixel for each year. In some cases, the true land type can be inferred. For example, because fallowed areas and regrowth was categorized as non-forest, areas where forest was observed in 2000 must have been forest in 1990. Areas where non-forest was observed in 1990, must have been non-forest in 2000. For the high forest loss estimates, I assume that all areas where forest was observed in 1990 and cloud was observed in 2000 were deforested, that all areas covered by clouds on both dates were forest in 1990 and non-forest in 2000, and that all areas covered by clouds in 1990 and observed as non-forest in 2000 were originally forested.
3. This number could actually be higher, but I omit from the calculation areas where no forest was visible on either date because in this case it is impossible to distinguish between mangrove and other forest types. This is not a problem in the other estimates, where I do not distinguish between forest types within ecological zones.
4. Because of redistricting in the mid-1990s, the communes at the time of the commune survey in 2001 are not always the exact communes – then called firaisanas– from the 1993 census. For the approximately 20% of communes affected by the redistricting, the data sets were matched using official lists of boundary changes. The borders of the remaining 80 percent of communes were unchanged.
5. In some parts of the tropics, researchers can take advantage of the dry season to obtain clear images, while a set of cloud-free images is nearly impossible to find in other areas. Without details about the land cover data collection and cleaning process, it is not possible to identify specific studies for which this was actually a problem. Informal conversations with other researchers suggest that dropping clouded observations is a common practice.
6. Another possible solution is to use the fact that Butler and Moser (Citation2006) find that, while the amount of forest lost is biased by cloud cover, the observed percent of forest lost is unbiased (although this need not hold for other data sets). Because the amount of forest observed in 1990 is still biased, it cannot be used directly as an explanatory variable and an instrument must be found. If one assumes that cloud cover affects the amount of forest observed, but is uncorrelated with the error term, then it can serve as an instrument for initial forest cover in a 2SLS regression. Cloud cover would not be exogenous if researchers actively seek to reduce cloud cover by analysing more images in areas affected by deforestation.
7. The selection equation includes all of the second stage variables plus latitude and longitude coordinates (of the centroid of the commune) and squares of the latitude and longitude coordinates to allow for a non-linear relationship between clouds and location.
8. To test whether all forest types could be combined, I used switching regression models to test the equality of coefficients across forest types. For the moist forest area, joint F-tests easily reject the hypothesis that the coefficients are equal to the coefficients for the dry and spiny regions. Joint F-tests fail to reject the equality of coefficients for the dry and spiny regions and thus these areas are combined into one estimation.
9. Because of the potential endogeneity problems discussed earlier, I have estimated these models with and without the suspect variables and these results are quite robust to specification. When distance is replaced with travel time, or rice exports (or maize exports in the case of the dry/spiny forest) are omitted, the results do not change significantly.
10. I include the top ethnic groups (by percentage of population) in the forest area (moist and dry/spiny) for each estimation.
11. While there are several potential sources of endogeneity in applied econometrics, there are two of particular concern here. First, a variable will be endogenous if there is an omitted variable (such as soil fertility) that affects both the dependent variable (forest loss) and an explanatory variable (such as population). Thus, one cannot be sure that population causes forest loss if this relationship is found in the data. The second concern is reverse causality, i.e., that forest lost is the cause not the effect. For example, suppose that after an area is deforested, a particular ethnic group is attracted by the new grazing opportunities for their cattle. They may have had nothing to do with cutting the trees down, but they will be associated with deforestation in the data.
References
- Agarwal , D K , Silander , J A Jr , Gelfand , A E , Dewar , R E and Mickelson , J G Jr . 2005 . Tropical deforestation in Madagascar: analyses using hierarchical, spatially explicit, Bayesian regression models . Ecol Modeling ,
- Angelsen , A and Kaimowitz , D . 1999 . Rethinking the causes of deforestation: lessons from economic models . World Bank Res Observer , 14 : 73 – 98 .
- Angelsen A Kaimowitz D 2001 Agricultural technologies and tropical deforestation Cambridge, MA CAB International Publishing
- Asner , G P . 2001 . Cloud cover in Landsat observations of the Brazilian amazon . Int J Remote Sensing , 22 : 3855 – 3862 .
- Barbier , E . 2001 . The economics of tropical deforestation and land use: an introduction to the special issue . Land Econ , 77 : 155 – 171 .
- Butler , J S and Moser , C . 2007 . The effect of cloud cover from satellite images on the measurement of deforestation . Land Econ , 83 : 166 – 173 .
- Cavendish , W . 2000 . Empirical regularities in the poverty-environment relationship of rural households: evidence from Zimbabwe . World Dev , 28 : 1979 – 2003 .
- Chomitz , K and Gray , D . 1996 . Roads, land use and deforestation: a spatial model applied to Belize . World Bank Econ Rev , 10 : 487 – 512 .
- Cropper , M , Puri , J and Griffiths , C . 2001 . Predicting the location of deforestation: the role of roads and protected areas in North Thailand . Land Econ , 77 : 172 – 186 .
- Deacon , R . 1999 . Deforestation and ownership-evidence from historical accounts and contemporary data . Land Econ , 75 : 341 – 359 .
- Deininger , K and Minten , B . 1999 . Poverty, policies and deforestation: the case of Mexico . Econ Dev Cultural Change , 47 : 313 – 344 .
- Deininger , K and Minten , B . 2002 . Determinants of deforestation and the economics of protection: an application to Mexico . Am J Agri Econ , 84 : 943 – 960 .
- Elbers , C , Lanjouw , J and Lanjouw , P . 2003 . Micro-level estimation of poverty and inequality . Econometric , 71 : 355 – 364 .
- Foster , A and Rosenzweig , M . 2003 . Economic growth and the rise of forests . Q J Econ , 118 : 601 – 637 .
- Freudenberger , K , Ravelonahina , J and Whyner , D . 1999 . Le corridor coincé , Landscape Development Initiatives (LDI), Madagascar . Case study report
- Freudenberger , M and Freudenberger , K . 2002 . “ Contradictions in agricultural intensification and improved natural resource management: issues in the Fianarantsoa forest values Corridor of Madagascar ” . In Natural resources management in African agriculture , Edited by: Barrett , C , Place , F and Aboud , A . Wallingford, UK: CAB International .
- Geist , H and Lambin , E . 2002 . Proximate causes and underlying driving forces of tropical deforestation . Bioscience , 52 : 143 – 151 .
- Green , G and Sussman , R . 1990 . Deforestation history of the eastern rain forests of Madagascar from satellite images . Science , 248 : 212 – 215 .
- Greene , W . 1997 . Econometric analysis , Upper Saddle River, NJ : Prentice Hall .
- Jarosz , L . 1993 . Defining and explaining tropical deforestation: shifting cultivation and population growth in colonial Madagascar (1896 – 1940) . Econ Geogr , 69 : 366 – 379 .
- Kull , C . 2000 . Deforestation, erosion, and fire: degradation myths in the environmental history of Madagascar . Environ History , 6 : 423 – 450 .
- Mercer , D E and Kramer , R . 1994 . “ Valuing a protected tropical forest: a case study in Madagascar ” . In Protected area economics and policy: linking conservation and development , Edited by: Munasinghe , M and McNeely , J . 191 – 202 . Washington, D.C. : World Bank and IUCN .
- McConnell , W . 2002 . Madagascar: Emerald isle or paradise lost? . Environment , : 44(8):10 – 22 .
- Minten , B and Méral , P . 2006 . International trade and environmental degradation: a case study on the loss of spiny forest cover in Madagascar Working Paper
- Mistiaen , J , Ozler , B , Razafimanantena , T and Razafindravonona , J . 2002 . Putting welfare on the map in Madagascar. Technical report. African Region Working Paper No. 34 , Washington, DC : The World Bank .
- Moser , C , Barrett , C and Minten , B . . Missed opportunities and missing markets: spatio-temporal arbitrage in rice in Madagascar . Working Paper, Department of Economics, Western Michigan University .
- Pfaff , A . 1999 . What drives deforestation in the Brazilian Amazon? Evidence from satellite and socioeconomic data . J Environ Econ Manag , 37 : 26 – 43 .
- Tole , L . 2002 . An estimate of forest cover extent and change in Jamaica using Landsat MSS data . Int J Remote Sensing , 23 : 91 – 106 .
- Tucker , C J and Townshend , J R . 2000 . Strategies for monitoring tropical deforestation using satellite data . Int J Remote Sensing , 21 : 1461 – 1471 .
- U.N. Wire . . U.N. Wire: world parks congress closes with conservation accord . September .
- The World Bank . 2004 . Madagascar data profile. World development indicators database 2004 , Washington, DC. : The World Bank . Accessed online May 2004. (http://devdata.worldbank.org/external/CPProfile.asp?SelectedCountry=MDG&CCODE=MDG&CNAME=Madagascar&PTYPE=CP