Abstract
Teacher and student interaction in a design studio setting has always been the basis of design education. A fundamental difficulty of design education is that the content of these one-on-one meetings between teacher and students remains remarkably implicit. In this paper, we present an explorative study that uses the design grammar model (DGM) as an observational framework for teacher–student interactions. The DGM is rooted on the concept of design grammar that can be broadly defined as the visual language used to design. The study focuses on the industrial design junior students’ meetings with their teacher; our research proceeds from a protocol analysis of the transcripts that are coded according to the DGM. The resulting data are then used to develop a series of diagrams that are employed as a visual analysis tool. The diagrams synthesise and convey large amounts of data that permit immediate analysis and elicit new interpretations. The study resulted in encouraging results regarding the DGM’s potential as an analysis tool for teacher and student interactions, as well as a diagnostic tool for teachers.
1. Introduction
The study we present here is centred on the notion that the teacher–student interaction in a design studio setting is the cornerstone of design education. Although there is a consensus that design project experience is overall regarded as an essential part of a design student’s education, we do not yet have a complete understanding of how the teaching/learning process in the design studio unfolds.
For our study, we will instead explore the notion of a language of designing (a design grammar (DG)) as the focus point of our analysis. Based on this idea, we developed an observational framework that identifies and makes explicit the common language that underpins teacher and student interactions.
A crucial element of our framework is the application of a visual notation tool we term the design grammar model (DGM). The model enables the development of diagrams that support a visual analysis of teacher/student interactions. The visual analysis we propose allows for the discernment of aspects that would otherwise be difficult to detect; turning verbal and statistical data into visual diagrams enables the disclosure of patterns, immediate comparisons, and, when analysed in succession, it can help interpret the dynamics of the teacher and student dialogue in a studio setting. This study is an exploratory effort and constitutes an initial test of our proposed model and framework.
1.1. The design studio
The design studio setting is a relevant model for design education (see Goldschmidt, Hochman, and Dafni [Citation2010] for a review on published research concerning the centrality of the studio in design education). The studio is a space where several students work on their projects while being tutored by a teacher. Projects are practical design exercises of increasing complexity. This setting is intended to simulate a professional studio in a controlled educational environment. Often referred to as the ‘learning by doing’ paradigm, this educational setting stems from the tradition of the guilds in medieval Europe where the ‘master-(journeyman)-apprentice’ model was used to teach craftsman (Sennett Citation2008).
This educational environment is typical, but not exclusive, of design disciplines.Footnote1 In these disciplines, the design studio is the centre of the educational experience; all the relevant sub-disciplines (for instance ergonomics, computer-assisted design, drawing or design history) are typically taught in conventional lectures, whereas learning how to design is reserved for the studio.
Thus, the fundamental aspect of the design studio setting is the teacher and student interaction. There are two important difficulties that emerge from this educational setting: (1) it is not uncommon that design studio teachers are also – or have been – practitioners who do not have specific pedagogical training (Dinham Citation1989). Yet, it would be challenging to provide design teachers with pedagogical frameworks that could be applicable to design education; design occupies an ambiguous status, it is not art and it is not science. It is obviously a creative endeavour (Christiaans Citation1992) but artistic teaching models do not fully apply to design since design is also supposed to be purposeful, to have a function or to fulfil a human need; furthermore knowledge about how to design remains mostly tacit knowledge (Polanyi Citation2009) since designers find it difficult to make explicit what they know (Van Dooren et al. Citation2014). This situation renders the intricate ‘dialogue’ (expressed verbally or non-verbally) between tutor and pupil in the design studio rather obscure.
Schön (Citation1985) highlighted this situation and called this difficulty the paradox and predicament of learning to design: ‘Initially, the student does not and cannot understand what designing means. He finds the artistry of thinking (and doing) like an architect to be elusive, obscure, alien and mysterious’ (55).
Thus, teacher and student interaction remains unclear and difficult to describe. While the general framework of design education appears to be compatible with constructivist learning theory (Kocadere and Ozgen Citation2012), general learning theory models can only describe the educational setting in its most generic aspects, whereas the intricacies of learning how to design remain implicit.
The language of designing is a language of doing architecture, a language game which Quist models for Petra displaying for her competences he would like her to acquire, but Quist’s discourse is also punctuated by parenthesis in which he talks about designing. (Schön Citation1985, 33) (Note: Quist is the teacher and Petra the student.)
In the quote above, Schön addresses a few aspects that are paramount for design education. Firstly, that there is a particular ‘language’ of design that a student must learn, which is tacitly alluded by the teacher. And secondly, that the role of the teacher is twofold: on the one hand, he acts as an expert practitioner displaying his expertise as an example for the student to follow; on the other hand, the teacher most at times interrupt his performance, as it were, to highlight and directly address the process of designing. Hitherto, most studies that delved into the design studio setting have been focused on the design process (Goldschmidt, Hochman, and Dafni Citation2010). This comes as no surprise, since the design process has been a central research field within design research as a whole.
1.2. DG – a framework for observing teacher and student interactions
The framework we present here is founded on our proposed concept of DG. DG can be understood as the elements used to design, that is, the fundamental parts, and relationships between them, that are synthesised in the form (understood as a unified structure of parts) of an artefact.Footnote2
It is important to distinguish between the idea of shape, which is the outline, contour or external surface of an object, and form. Form is a broader and harder to define concept; Arnheim (Citation2004) adopted the formulation ‘form is the visual shape of content’ (96); therefore, proposing that form is in its essence a visual entity linked, but not exactly the same, as the actual materialised shape of an object. According to Arnheim, form is therefore a mental construct, employed when referring to the essential qualities of an object, whereas shape is better used to describe an object’s actual physical appearance.
The problem of how to teach form-giving was at the core of the development of design education. Early design schools (such as the Bauhaus in Weimar) combined the teaching of form-giving skills with theoretical knowledge with the purpose of creating a visual language that could be taught objectively; at the time, this was regarded as a crucial step to provide academic credibility to the discipline of design. As such, the notion of a design visual language (or DG) we present here is rooted, originally, in the general pedagogical principles developed in the Bauhaus (1919–1933).
Itten (Citation1975) was responsible for the first foundation course (or basic course) in the Bauhaus. The course’s aim was to establish a basis for the abstract study of form through a systematic exploration of the basic materials, principles and elements involved in the creation of forms. The foundation course was an attempt to solve the problem of students going into the design studio without a basis to support them. After completing the course, the students were expected to have developed a visual literacy that served as a foundation to build on.
The approach that Itten proposed became a template for visual education in general (Wallschlaeger and Busic-Snyder Citation1992) and was later adopted by design courses across Europe and the USA, being notorious the establishment of the American Bauhaus in Chicago by Moholy-Nagy in 1937 (Findeli Citation1990). Building on the Bauhaus legacy (Bonsiepe and Cullars Citation1995), the Ulm School of Design’s (1953–1968) staff maintained the idea of a systematic study of visual education and form-giving as the fundamental first step in a design student’s education. Contemporary to the Bauhaus, the Russian school Vkhutemas (1920–1930) was another influential European avant-garde institution (Bojko, Citation1980); both schools shared a disposal to experiment with new models for design education and held similar foundational courses. The influence of these schools can still be identified in design courses throughout the world (see [Boucharenc Citation2006] for an international survey on this issue).
1.2.1. Form-giving elements (a visual language of design, or a DG)
The educational institutions that were mentioned in the brief historical background adopted the term ‘visual language’ to refer to the underlying elements used in design and art. In our case, we find the metaphor of language to be too broad a concept. We adopted the preferred term ‘DG’ because while language is a highly complex system of human communication, grammar presupposes a narrower focus on structure, rules, syntax and the combination of different elements. Furthermore, the term ‘DG’ can include elements that are not visual as well (e.g. ergonomics and functionality). What are, then, the fundamental elements that come into play in the creation of form in design?
Wallschlaeger and Busic-Snyder (Citation1992) proposed a model – the problem-solving process/form-generation model, which orders and categorises the visual elements used in form generation. The model was derived from an extensive review of design course programs, historical influences and broad literature on perception and communication theory. The authors intended to ‘Eliminate the need for many supporting texts by presenting a wide range of information and study exercises to help faculty and students learn and utilize a common visual language’ (9).
The authors’ work offers a description of the visual elements used in form-giving, from the basic geometric elements, to human factors and dimensions, form configuration and materialisation, as well as aspects of communication and perception. Their main intent was to develop a textbook for university teachers and students of arts, architecture and design. Wallschlaeger and Busic-Snyder propose a model that presents a linear parallel between a problem-solving process that can be summarised as research – development – production – solution/evaluation and a form-generation process that develops from 2- to 3-dimensional elements (point, line, plane, volume) to the elements of space and depth, and also includes elements relating to perception and communication theory, as well as human factors and structural and materialisation elements. While we did not use the problem-solving/form-generation model as proposed by Wallschlaeger and Busic-Snyder, we found that the form-generation half of the model offered a comprehensive set of categories that could serve as a basis for our model.
2. DG model
We propose to use DG as a framework for observing teacher and student interactions in a design studio setting. We developed a DGM to operationalise the concept of DG; the model is not hierarchical, all the elements contribute equally to the whole (the unity of form.) The model is constituted by the categories we derived from the literature review we presented before.
In the table below, we present all the DG elements and a short description of each sub-category. Each category is assigned a code (E1, E2…) that was used in the analysis of the transcripts Table .
Table 1. DG model.
What follows is a general description of each category:
| • | Elements of Form: it includes the most basic and foundational elements of form (point, line and plane) which are the form generators; the combination of these three elements results in the creation of volume (positive and negative space), as well as the attributes of form: dimensions, texture, value (light-dark,) shape (polygons) and colour. | ||||
| • | Organisational Principles: they concern the aspects of composition, structure and spatial organisation, it is a step beyond the Elements of Form in the sense that these principles address the visual relationships between different parts, between parts and whole, and further explores the transition between 2 and 3 dimensions. | ||||
| • | Communication: it refers to the artefact as part of the artificial world and material culture; it concerns the implications of understanding an object as a sign, that is, the meaning(s) it conveys in a communication process. Design generates material reality, satisfying practical functions and technical performance, which are only a part of that reality, a design product also deals with connotations. | ||||
| • | Function: as a crucial aspect of design, function refers to the product’s purpose (what needs it is intended to fulfil) usability (the ability to be used, ease of use) and fruition (in the sense of enjoyment, or a pleasurable possession.) | ||||
| • | Human Factors: these refer to specific requirements that constrain the artefact. It includes ergonomics, user requirements and economic factors. These factors are closely entwined with the category of function. The main difference is that functionality deals with more subjective aspects of interaction between artefact and user, while human factors are more precise and objective features such as height or age for example. | ||||
| • | Materialisation: it refers to aspects concerning the actual physical materialisation of an object; these include materials and their characteristics (manufacturing technologies, available tools and machinery) structure (dynamic or static, forces and equilibrium, specific structural parts) and configuration (geometric solutions and real dimensions of the object.) | ||||
2.1. Using the DGM in a design studio setting
We propose to explore the visual language inherent to design as a common language between teacher and student. The constitutive elements of this visual language are the categories of a basic DG; these elements have been described as a ‘grammar’ before:
The grammar of design focused on the visual language employed by all designers, and it provided a common ground and understanding of the elements that are synthesized in form and turned to communicative and practical purpose by the designer. (Buchanan Citation2009, 417)
The analogy of ‘language’ helps to understand the role these elements play in the creation of form in design. Verbal language is made up of different elements and the rules for combining them: letters are joined in order to form words, and syntax rules specify how words can then be combined to create sentences and so on. Together, the elements and rules make up the grammar of a language and define its structure. The same can be said of a design visual language; its grammar is a set of essential elements and principles that are involved in the form-creation of artefacts. Another useful analogy is perhaps the notes, scales and chords which are the fundamental elements required to create music. Taken in isolation, a musical note or chord is meaningless, but when arranged in a sequence, these elements are structured into a coherent whole that is more than the sum of its parts.
2.1.1. Visual language, verbal expression and the role of sketches
There is an apparent inconsistency that emerges from the setting we described thus far. We placed the focus of the study in the analysis of DG (a visual language), and yet the teacher and student interactions are predominantly comprised of verbal exchanges.
Teacher and student interactions are indeed verbal to a large degree. However, these interactions occur in the context of an ongoing design project; this setting is usually structured around milestones when the student is expected to present the progress of his design work. The student often presents work in the form of sketches, especially in earlier stages of the design process.
As such, we propose that sketches, to a large extent, mediateFootnote3 the teacher and student interaction. That is, the student presents his work in the form of sketches (from early ‘thinking sketches’ to progressively more detailed drawings) and the teacher reacts and provides feedback. The importance of sketches in design expands beyond what we are describing here; there is extensive research concerning the singular role sketching plays for design (Goldschmidt Citation2007; Purcell and Gero Citation1998; Suwa and Tversky Citation1997; Tang, Lee, and Gero Citation2010).
Most importantly, sketches in design are an expression of thought (or thought made visible).
The creative process of designing, being an activity of the mind, cannot be directly observed. The sketches, done for the eyes and directed by them, make some of the design plans visible. They not only supply the designer with tangible images of what his or her mind is trying out in the dimness of its own freedom, but they also permit the observer or theorist to catch a few stop-motion glimpses of the flow of creation. (Arnheim Citation1993, 19)
Goldschmidt (Citation1991) presented a persuasive argument advocating the intricate connection between sketching and visual thinking; the author argued that sketching is a process of discovery and experimentation; that is, it is not merely a visual expression of abstract ideas, but the actual process of creating and making sense of those ideas.
Sketches are then the favoured manner of expression of the visual language underpinning design activity (the DG). However, while visual thinking can be expressed in the sketches, the preferred mode of communication between teacher and student is predominantly verbal. In fact, the substantial amount of sketching is not performed during the one-on-one meetings. What the student is presenting is the result of work done prior to the meeting; the meeting itself proceeds mostly as verbal exchanges while examining the sketches. This could be explained by the notion of sketches as ‘thinking sketches’ (Goldschmidt Citation2014) – thinking sketches are ambiguous and personal; a sketch represents ideas and images held in the mind, these ideas are not set in stone but rather open-ended; therefore, a sketch is seldom self-explanatory and functions as a starting point for reflection and back and forth dialogue between teacher and student.
Thus, if the teacher and student interactions are to a large degree verbal, then what we are observing is a sort of translation; that is, the student and teacher are translating the visual language (the DG) expressed in sketches to, in the case of the study we present here, the English language.
3. Research approach and questions
Our research approach was to develop an exploratory study focused on the issue of teacher–student interactions in a design studio setting. Specifically, our aim was to explore the DGM as a visual tool to render the content of the interactions more explicit. The research questions are framed as a guiding principle to allow an explorative approach.
Research question:
Can the content of teacher–student interactions be made more explicit?
Sub-questions:
Is the DGM effective as a tool to render the content of teacher–student interactions visible?
If so, what does it reveal that was not available with other methods of analysis?
Is the DGM a useful tool to reveal the development of a common visual language between teacher and student?
4. Methods
For our study, we used the industrial design junior data set, which includes the video recordings and transcripts of seven students. Two of the five sessions covered in this data set are presentations for the client; since our study concerns teacher–student interaction, we did not include these meetings in our analysis. Therefore, our study will look exclusively into the 1st and 2nd review and the look-like review.
There is a significant distinction to be made between these sessions: the 1st and 2nd reviews occurred early in the design process, when the students are developing, presenting and working through early ideas for their projects. The meetings unfold around the student sketches, therefore being consistent with the framework we presented earlier, whereas the look-like review ensues later in the process when the students are already working on their models. These are focused mostly on physical and computer-generated models. Thus, it is possible to use this data set to compare interactions mediated by sketches (1st or 2nd review) with interactions where sketches are not present, or do not take centre stage (look-like review).
The analysis was structured around three sequential stages, which we will now detail.
| • | Phase A: Identification of events and primary analysis; | ||||
| • | Phase B: Categorisation of events; | ||||
| • | Phase C: Visual analysis (diagrams). | ||||
4.1. Phase A – identification of events
An event is a verbal reference, made by student or teacher, to form-giving. The duration of an event can vary. Frequently, the end of an event corresponded with the participant making his point, or simply stop speaking (this is different from a short or long pause after which the participant continues to develop the same point [Fairclough Citation1995]); on other occasions, the participant continued talking but changed the emphasis to, for instance, a reflection on the design process; in these cases, the event was considered to be concluded.
As an example of the identification of an event, we can look at a transcript of a 2nd review session, where the student Adam makes explicit references to materials and colours that might be a part of the final form of his object: ‘I’m thinking I want to make the out of fabric so they can play around with it a lot. But right off the bat, I was thinking I’d make it in like dual colors.’
4.2. Phase B – categorisation of events
During this phase, the events are categorised according to the DGM categories. The analysis focuses on both the teacher and the student’s input. This information is structured and categorised using an analysis table (part of an analysis table below) Table :
Table 2. Example of an analysis table (Todd).
At this stage (B), the analysis focuses on two questions:
Is the participant (teacher or student) expressing information that can be described by a DGM category, and are the DG elements articulated with each other and/or with the whole?
The amount and variety of references to DG categories provide an overview of the participants DG fluency. For this exploratory study, we are only looking into the teacher and students’ total amount and variety of categorisations; when a significant amount of studies have been conducted, this data could help compare results and predict expected fluency outcomes.
Articulation occurs when a participant establishes a meaningful relationship between two or more DG elements. For example, in the above transcript, the student Todd is reflecting on a structural solution that has consequences to the product’s ergonomic performance.
The coding procedure to determine the events and subsequent categorisations was conducted simultaneously by two of the research team members. Discussion regarding the coding was conducted during the coding process. Coding disagreements were then selected and sent to a third member of the research team for evaluation and arbitration.
4.3. Phase C – visual analysis
We used the data obtained from the first two phases to create a series of diagrams that sustained our analysis. The diagrams allow for a large amount of data to be displayed immediately; therefore facilitating the identification of similarities or contrasts and the disclosure of patterns.Footnote4
4.3.1. Diagram design
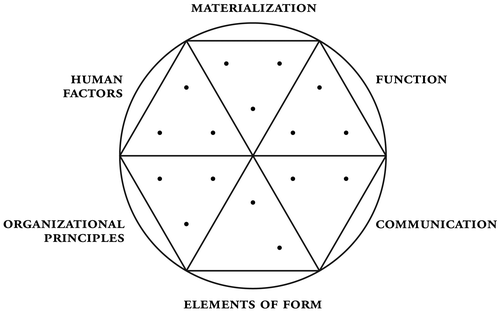
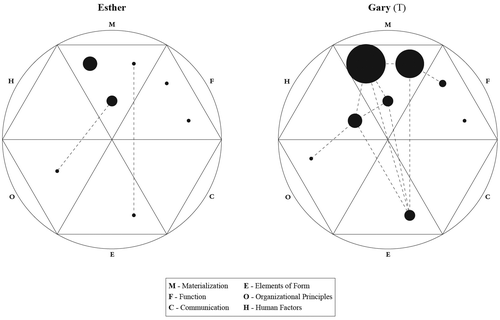
The diagram (Figure ) consists of 6 triangles (composing an hexagon) representing the 6 areas of the DGM. The black dots indicate the sub-categories of each area.
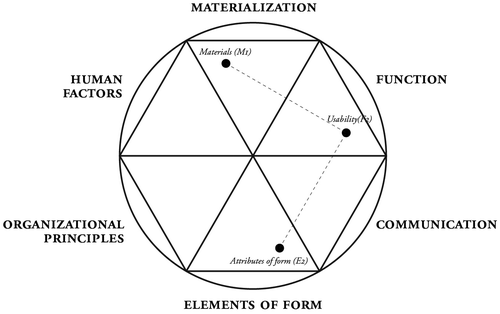
We created a diagram for each event of every interaction for both teacher and students. These diagrams could contain several DG categories or only one isolated element. The dotted lines represent an articulation between elements. See an example in the figure below.
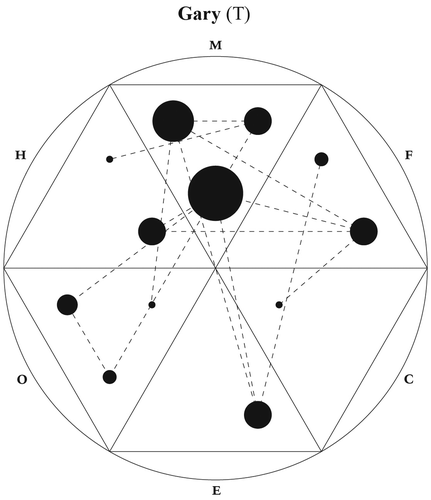
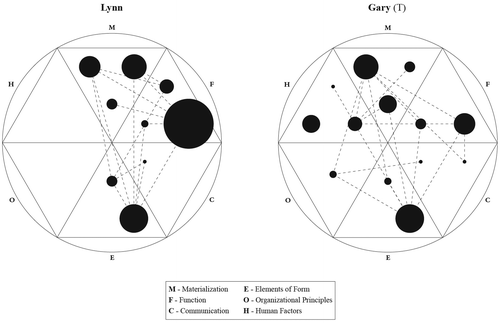
After completing the diagrams for every event, the data are used to create an overall diagram of the complete interaction, which overlays all the single event diagrams. Again, this is done for both teacher and student Figure . In the overall diagram, the black circles expand in proportion to the number of references made and all the articulation lines are displayed as well (see figure below.)
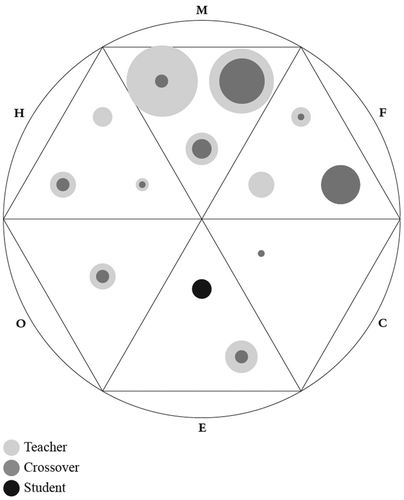
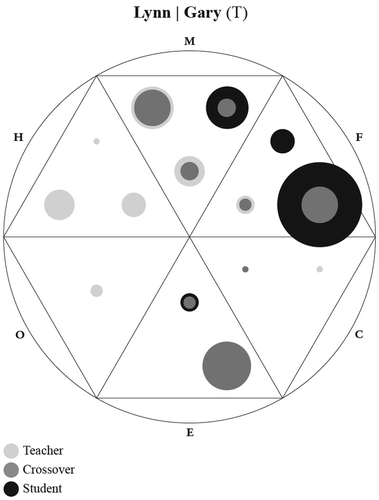
The overall diagrams allowed us to create crossover diagrams, which overlay the student and teacher’s overall diagrams. Then, using transparency, similarities and disparities between the different pattern’s spread emerge Figure .
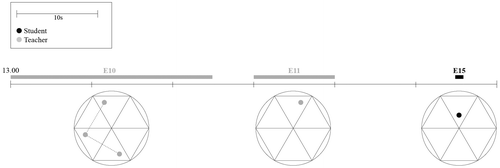
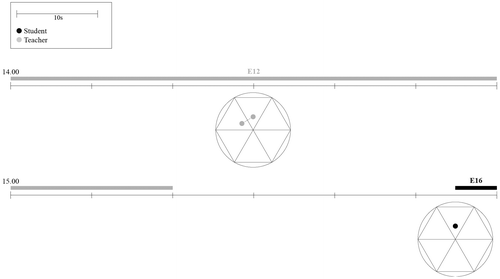
Finally, we created a timeline of each complete interaction that presents all the single event diagrams in the time interval in which they took place. Teacher and student diagrams are placed in the same timeline; this introduces the dynamic of time and turn taking into our visual analysis Figure .
The complete timeline diagrams were printed in large paper formats for the analysis. As such, the fragments we present in this study do not offer the same immediate readability that both the overall and crossover diagrams permit. Nevertheless, being an integral part of the analysis, we will present a couple of examples of insights gathered from the timeline diagrams in the results section Figure .
The table below summarises this section Table .
Table 3. Summary of methodology.
5. Results (visual analysis)
For the results, we will present some representative cases that exemplify the analytical potential of the tool. In this section, we will highlight issues to be further developed in the discussion part of this study.
The different diagrams capture diverse aspects of the interactions. For instance, the overall diagrams allow for an immediate comparison between teacher and student’s DG fluency and articulation, whereas the timeline can be used to elicit aspects concerning the dynamics of the interaction.
The analysis is focused on using DG to characterise the interactions. The analysis will be mainly twofold: (1) DG fluency – the diagrams show what areas both participants focused on, what areas were absent and the articulations that occurred. The visual data elicit clear comparisons of the two participants; we will use the visualisations to explicit similarities and differences between teacher and students; and (2) interaction dynamics – the visual analysis results in a large quantity of diagrams that can be organised in a timeline, and this permits an analysis of the dynamic of the observed interaction, specifically, the identification of moments when DG was more or less present (or absent), as well as the turn-taking dynamics of the interaction.
5.1. Lynn and Gary (1st Review Session)
This session had the duration of 26 m:16 s, during which we registered 20 events for Lynn and 19 for Gary.
Figure (below) presents the overall diagrams of Lynn and Gary. The diagrams overlay all the singular events of both participants. The diagrams are placed side by side, providing a visual summary of the DG content of the interaction. The result is a depiction of the individual perspective of both student and teacher that allows the comparison of the spread and focus of the DG categories.
In the case of Lynn, there is an evident focus on the function (F) categories. Her diagram also reveals that the different elements were articulated with each other. On the other hand, the teacher’s diagram does not follow Lynn’s pattern. Gary’s diagram reveals categorisations (namely human factors [H] and organisational principles [O]) that are totally absent from Lynn’s diagram (that visually leans distinctively towards the right.)
There are similarities concerning the elements of form (E) and materialisation (M) categories that can perhaps be better illustrated by a crossover diagram.
The crossover diagram above reveals how the pattern spreads differed; Lynn focused greatly on the materialisation and function categories (upper right), whereas Gary did not focus on a specific category as evidently as Lynn. Furthermore, the teacher made references to human factors and organisational principles, which were not captured at all in Lynn’s diagram Figure .
5.2. Todd and Gary (1st Review Session)
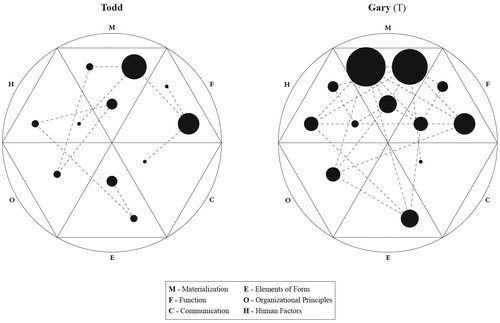
Todd and Gary’s 1st review session lasted 20 m:40 s. There was a wider disparity between the number of events registered, Gary had 26 and Todd 18. Todd and Gary’s overall diagrams revealed an interesting comparison – their patterns are somewhat similar, even though the teacher shows a higher percentage of categorisations. The focus of the interaction appears to be centred on materialisation Figure .
Unlike the case of Lynn, here the diagrams capture similar patterns, both teacher and student concentrated on the same areas of DG, with the only visible difference being the fact that the teacher exhibits a higher amount of categorisations. Both diagrams reveal that the different areas were articulated.
5.3. Esther and Gary (look-like review)
We expected to find differences in the look-like review diagrams. As was said before, these sessions were not mediated by sketches but rather by models (physical and/or computer generated). The look-like reviews were largely about practical issues of model making than form-giving. The study’s sample does not allow for generalising conclusions, but from the cases we analysed there was a marked difference between the first two sessions (where sketches were central) and the look-like review sessions. Below we present the overall diagrams of Esther and Gary that are an illustrative example of how the look-like reviews unfolded Figure .
The first thing that stood out was that Esther’s diagram revealed fewer articulations and aggregate of categorisations when compared with the cases we have seen before. On the contrary, the teacher’s diagram, while not displaying a pattern as varied as previously observed, maintains a fair amount of aggregate categorisations and articulations. This could be indicative, without being conclusive, that the teacher sustains a similar performance, in terms of DG, across the different stages of the design process.
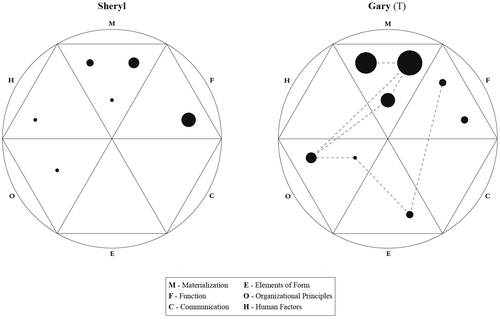
5.4. Sheryl and Gary (look-like review)
Sheryl and Gary’s look-like review was a unique case. Sheryl’s overall diagram was quite intriguing, since it revealed a complete absence of articulations Figure .
The figure above prompted us to have another look at the interaction’s transcripts while creating the timeline diagram. Observing Sheryl and Gary’s timeline diagram (fragment below) reveals several references to single non-articulated DG categories (from both teacher as well as student) happening in quick succession. The timeline represents one minute of interaction; above the timeline, the event’s code is indicated (E2, E3, E4…) as well as duration, and beneath the timeline, there is a diagram for each corresponding event Figure .
At first, each event appeared to address only one isolated grammar category. However, a closer analysis of the sequence revealed an interesting occurrence: Sheryl mentions an issue (E2) ‘And then in the middle, these telescope, so you can raise and lower the table height’ that we categorised as usability; immediately Gary replies (E2) saying ‘How is that gonna work – just push, pull?’ which was labelled as structure.
It is clear from the dialogue that Gary suggested a structural solution for the usability issue mentioned by Sheryl. Thus, Gary was in fact articulating both elements with his question. The reverse happened after Gary asked (E3) ‘So where would the lever be?’ to which Sheryl replied (E4) ‘Just in here. ‘Cause you – I mean to lift it, you have to pull the seats out’ in this case Sheryl took a question concerning the structure of her design and articulated it with a usability issue. It is interesting to note how the teacher was able to elicit articulation with two short and simple questions.
At first, the sequence of events seemed to refer to isolated grammar categories, since there are several diagrams with a single DG category in quick succession. But combining the timeline diagrams with the coded transcripts revealed a different situation. In this case, teacher and student were building on what each other said.
5.5. Lynn and Gary (look-like review)
Our closing example is another illustration of how the timeline elicits a different kind of analysis. We would like to highlight the teacher’s event 12; this event was quite long in duration (1m20s), and yet focused solely on two specific categories (configuration and ergonomics) Figure .
Going back to the transcript, we find the corresponding passage:
You have to keep in mind it’s gotta be a certain size, this dimension to be able to accommodate the human anatomy. (…) And then it also has to be a certain height. (…) And then all of a sudden, you, you’re with something that this dimension may have to be a little larger. So all of a sudden, what you like here in terms of your thumbnail sketch may not be able to translate (…) into, into real dimensional functional dimensions.
The concern that the thumbnail sketches might not translate well into real dimensions is an issue the teacher emphasised several times with different students. This was clearly something Gary felt was important to make clear, which could be the reason why this event is long and so specifically focussed. Other studies have also made the same observation (Adams, Chua, and Radcliffe Citation2014; Mcdonnell Citation2014).
6. Discussion
This study consisted of a first exploration of the DGM as a framework to analyse teacher and student interactions. Past studies suggest that teacher and student interaction within a design studio setting requires specific observational frameworks (Schön Citation1987); our model, while focussing on the DG categories, has the supplementary benefit of revealing insights regarding the overall dynamics between teacher and students.
The results suggest that the DG we proposed could be understood as a common visual language underpinning the teacher and students dialogue, since we observed both making use of the same overall DG categories to address form-giving issues. However, what the DGM reveals is that, during a session, teacher and students do not refer to the same categories in the same degree. In fact, the teacher generally displays a higher variety of categories than the student; and perhaps more importantly, the teacher consistently exhibits a wider range of connections between categories, elaborating on how different aspects of a design relate with each other and contribute to the structuring of a coherent whole. The students, on the other hand, show a more fragmented approach, focussing on specific areas and drawing fewer links between categories. This is consistent with descriptions of the behavioural differences between expert and novice designers (Cross Citation2004).
This insight is not unexpected considering the study sample consisted of second year students; a sample with a broader range of students might reveal if the diagrams become increasingly similar to the teacher’s as the students become more mature; similar not necessarily in terms of the categories mentioned, but regarding the overall approach and interconnectedness of the patterns.
These preliminary insights are highly encouraging regarding the application of the DGM tool in a practical educational setting. The model could serve as a diagnostic tool that monitors a student’s progress over time, as well as a tool for teachers for self-monitoring and reflection on their pedagogical practice. Moreover, future studies could observe the same students across the different stages of the design process. A longitudinal study of this kind would permit the comparison of sequential diagrams, leading to the disclosure of patterns and therefore more generalisable results. This sort of study would have to involve statistical normalisation to conduct comparisons between different students as well.
Another insight concerns the following: the results show a clear difference between the sessions mediated by sketches and the sessions mediated by other types of artefacts such as physical or computer-generated models; the sketch-mediated sessions were significantly richer in reference and variety of DG categories. This is consistent with previous studies that strongly suggest that sketching is an effective tool for visual thinking and creative problem-solving (Goldschmidt Citation1991). However, it could be argued that the sessions where sketches were central correspond to the early stages of the design process, when many of the critical decisions (Almendra Citation2010) are still being made, and therefore, it is expected to observe more references to form-giving aspects than in later stages of the process. Nevertheless, this insight points to the study of sketching as a useful medium to develop and communicate a common visual language between teacher and student.
To conclude, overall the DGM diagrams were effective in capturing the content of these interactions and render it in a visual display. The resulting patterns synthesised and communicated a large amount of interconnected data that would be otherwise more challenging to grasp. For future research, the DGM could be appropriated as a basic set of categories applicable to form-giving in design, that is other researchers might find it useful to build and expand on the category set we presented here.
Additional information
Funding
Notes
1. The underlying educational theory of this setting is largely reminiscent of Vygostky’s social constructivist theory (Citation1978), where the author develops the notion that knowledge is first experienced socially and only subsequently internalised by individuals.
2. By artefact we mean an object that is the product of human skill and ingenuity (Erlhoff and Marshall Citation2008).
3. We are drawing from the concept of mediating artefacts that was proposed by Vygotsky (Citation1978) and was later developed by scholars working in educational theory (Conole Citation2012).
4. The process of converting large amounts of data into visual communicative mediums can be traced to the beginning of the twentieth century. Otto Neurath (1888–1945) was a pioneer in the creation of pictograms as a way to communicate complex data to the wider public (Neurath Citation2010).
References
- Adams, R., M. Chua, and D. Radcliffe. 2014. “Making Design Pedagogical Content Knowledge Visible Within Design Reviews.” Paper presented at design thinking research symposium. West Lafayette, IN: Purdue University.
- Almendra, R. 2010. Decision Making in the Conceptual Phase of Design Processes. Lisbon: Faculdade de Arquitectura da Universidade Técnica de Lisboa.
- Arnheim, R. 1993. “Sketching and the Psychology of Design.” Design Issues 9 (2): 15–19.10.2307/1511669
- Arnheim, R. 2004. Art and Visual Perception. Berkely: University of California Press.
- Bojko, S. 1980. “Vkhutemas.” In The Avant-Garde in Russia, 1910–1930: New perspectives, edited by S. Barron and M. Tuchman, 78–83. Los Angeles, CA: Los Angeles County Museum of Art.
- Bonsiepe, G., and J. Cullars. 1995. “The Invisible Facets of the Hfg Ulm.” Design Issues 11 (2): 11–20.10.2307/1511756
- Boucharenc, C. G. 2006. “Research on Basic Design Education: An International Survey.” International Journal of Technology and Design Education 16 (1): 1–30.10.1007/s10798-005-2110-8
- Buchanan, R. 2009. “Thinking about Design: An Historical Perspective.” In Philosophy of Technology and Engineering Sciences, edited by A. Meijers, 409–453. Amsterdam: Elsevier.10.1016/B978-0-444-51667-1.50020-3
- Christiaans, H. 1992. Creativity in Design – The Role of Domain Knowledge in Designing. Delft: TU Delft, Delft University of Technology.
- Conole, G. 2012. “Mediating Artefacts.” In Designing for Learning in an Open World, edited by J. M. Spector and S. LaJoie, 65–84. New York: Springer Science & Business Media.
- Cross, N. 2004. “Expertise in Design: An Overview.” Design Studies 25 (5):427–441.10.1016/j.destud.2004.06.002
- Dinham, S. 1989. “Teaching as Design: Theory, Research and Implications for Design Teaching.” Design Studies 10 (2): 80–88.
- Erlhoff, M., and T. Marshall. 2008. Design Dictionary. Basel: Walter de Gruyter.10.1007/978-3-7643-8140-0
- Fairclough, N. 1995. Critical Discourse Analysis: The Critical Study of Language. London: Routledge.
- Findeli, A. 1990. “Moholy-Nagy’s Design Pedagogy in Chicago (1937–46).” Design Issues 7 (1): 4–19.10.2307/1511466
- Goldschmidt, G. 1991. “The Dialectics of Sketching.” Creativity Research Journal 4 (2): 123–143.10.1080/10400419109534381
- Goldschmidt, G. 2007. “To See Eye to Eye: The Role of Visual Representations in Building Shared Mental Models in Design Teams.” CoDesign 3 (1): 43–50.10.1080/15710880601170826
- Goldschmidt, G. 2014. “Modeling the Role of Sketching in Design Idea Generation.” In An Anthology of Theories and Models of Design, edited by A. Chakrabarti and L. T. M. Blessing, 433–450. London: Springer.
- Goldschmidt, G., H. Hochman, and I. Dafni. 2010. “The Design Studio ‘Crit’: Teacher–Student Communication.” Artificial Intelligence for Engineering Design, Analysis and Manufacturing 24 (3): 285–302.10.1017/S089006041000020X
- Itten, J. 1975. Design and Form – The basic course at the Bauhaus. London: Thames and Hudson.
- Kocadere, S. A., and D. Ozgen. 2012. “Assessment of Basic Design Course in Terms of Constructivist Learning Theory.” Procedia - Social and Behavioral Sciences 51: 115–119.10.1016/j.sbspro.2012.08.128
- Mcdonnell, J. 2014. “Becoming a Designer: Some Contributions of Design Reviews.” Paper presented at design thinking research symposium. West Lafayette, IN: Purdue University.
- Neurath, O. (2010). From Hieroglyphics to Isotype: A Visual Autobiography. Edited by M. Eve and C. Burke. London: Hyphen Press.
- Polanyi, M. 2009. The Tacit Dimension. Chicago, IL: The University of Chicago Press.
- Purcell, A. T., and J. S. Gero. 1998. “Drawings and the Design Process.” Design Studies 19 (4): 389–430.10.1016/S0142-694X(98)00015-5
- Schön, D. 1985. The Design Studio: An Exploration of its Traditions and Potentials. London: RIBA Publications for RIBA Building Industry Trust.
- Schön, D. 1987. Educating the Reflective Practitioner. San Francisco, CA: Jossey-Bass -A Wiley Imprint.
- Sennett, R. 2008. The Craftsman. New Haven: Yale University Press.
- Suwa, M., and B. Tversky. 1997. “What do Architects and Students Perceive in their Design Sketches? A Protocol Analysis” Design Studies 18 (4): 385–403.10.1016/S0142-694X(97)00008-2
- Tang, H. H., Y. Y. Lee, and J. S. Gero. 2010. “Comparing Collaborative Co-located and Distributed Design Processes in Digital and Traditional Sketching Environments: A Protocol Study using the Function-behaviour-structure Coding Scheme.” Design Studies 32 (1): 1–29.
- Van Dooren, E., E. Boshuizen, J. Van Merriënboer, T. Asselbergs, and M. Van Dorst. 2014. “Making Explicit in Design Education: Generic Elements in the Design Process.” International Journal of Technology and Design Education 24 (1): 53–71.10.1007/s10798-013-9246-8
- Vygotsky, L. 1978. Mind in Society. Oxford: Harvard University Press.
- Wallschlaeger, C., and C. Busic-Snyder. 1992. Basic Visual Concepts and Principles for Artists, Architects and Designers. Edited by M. Morgan. Boston, MA: McGraw Hill.

