Abstract
The Muda River has been dramatically affected by unsustainable human activities that sacrificed environmental values for national development. The removal of the forest canopy causes a decrease in the interception and transpiration in a basin. The decrease in transpiration leads to an increase in the amount of water stored in the soil. These changes can increase the soil's moisture content, allowing more water to be available to drain into channels. Tree clearing can also cause increased erosion at logged sites and a subsequent increase in sediment yield. In this study, an investigation of the spatial and temporal changes in the environment imposed by new land usages on a long timescale (over 22 years) was carried out in the Muda River area. Detecting the changes in land usage will help predict both the consequent changes in the Muda River's behaviour and flood risks. In addition, computer modelling (InfoWorks RS) was used to help determine the long-term behaviour of the Muda River and its flooding behaviour.
1 Introduction
Natural forces alone do not cause floods in Malaysia today; rather, floods are a by-product of the interaction between natural events and human activities. Continuous changes in land usage and climate affect the geomorphology of river systems (e.g. Toy et al. Citation2002, Houben et al. Citation2006). Many anthropogenic land usage patterns (e.g. agriculture, industrialization, commercial, residential) are concentrated along rivers and in the vicinity of floodplains and submergible areas throughout Malaysia. These activities are continually subjected to the catastrophe of flooding. In the light of Malaysia's vision of being an industrial nation by 2020, more and more floodplain areas are expected to be developed, thereby exposing even more people and property to the risk of flooding. Flooding occurs when the river cannot cope with extra water coming from the river catchment area, which causes the level of the water in the river to rise and a flood to occur (Hyndman and Hyndman 2006). Significant destruction and losses of property, life and money are the results of catastrophic floods. These hazards continue to be a threat in Malaysia, especially since people choose to occupy floodplains, ignore the dangers of such hazard zones, mismanage flood hazards, over-develop land and deplete natural resources at rates that the natural system can neither cope with nor adapt to (Abdullah Citation1999).
Stream channels are complex systems in space and time (Lane and Richards Citation1997), and a single change often triggers another, creating multiple effects from a single cause (Schumm Citation1974). Often, stream channels respond negatively and impact the riparian habitat and water quality. The literature on this topic indicates that a variety of responses in stream channels can be a result of natural and man-made activities. The Muda River has been dramatically affected by unsustainable human activities that sacrifice environmental values for the sake of national development. The land that drains into this river has been cleared for agriculture, industry and urban development. These activities work together to increase the amount of runoff entering the river, thereby exposing the ecosystem to the risk of flooding. Given that land-use projects in the Muda River are expected to change in the near future (JICA Citation1995), it is important to investigate how past activities affected the form of the river channel in order to predict flooding risks in the long term. By knowing the character and predicting the behaviour of meandering rivers, it is possible to better manage and plan land usage projects, especially when down-valley migration and lateral channel shifts occur that lead to the erosion of arable land and natural reserves. Thus, both spatial and temporal changes are possible within the river area (Richards et al. Citation2005). With recent advances in technology and computer interfaces such as geographical information systems (GIS), remotely sensed data collection and graphical computer interfaces, one is able to use computer modelling for studies in this area (Islam and Sado Citation2000, Sanyal and Lu Citation2005, Pender and Néelz Citation2007).
In this paper, the results from a study of the spatial and temporal changes in land usage in the Muda River basin on a long timescale are presented (1984–2003). By detecting the changes in land usage, it is possible to predict changes in the Muda River and thus predict and pre-emptively communicate flood risks. Computer modelling can greatly improve the understanding of the long-term behaviour of the Muda River and its flooding risks. In this study, a computer model was used where special attention was paid to incorporating information on land attributes. These simulations enable us to gain an understanding of the effects of past human activities in the river system and examine the relevant impacts of changes in land usage on the performance of the river through time. This spatial and temporal information is a necessary input for flood management and developmental planning in the Muda River area.
2 Site description and flood history
The Muda River is the longest river in the state of Kedah, and it is situated in northern Peninsular Malaysia, with its upstream flow coming from the northern mountainous area of the state. The river, which has a length of 180 km, flows towards the southern area of the state and has a catchment area of 4210 km2. Downstream, the river changes its course towards the west coast after passing the confluence of the mainstream and its largest tributary: the Ketil River. The three major tributaries of the Muda River system are: the Ketil River, the Sedim River and the Chepir River. shows the topography of the Muda River basin. The annual rainfall in the study area is about 2000–3000 mm.
Figure 1 Topographical map of the Muda River (2006)
The Muda River is a major source of water supply and sand mining for the northern states. Hundreds of mining locations have been created to extract sand from the river bed, far exceeding the total natural yield of sand for the river (JICA Citation1995). This unsustainable use of resources has degraded the quality of the riverine system and made it vulnerable to severe environmental deterioration. The Muda River experiences floods almost every year, as the catchment area often floods during the rainy seasons from April to May and from September to November. The annual flooding events only differ in magnitude. However, the flood history of the Muda River for the last 20 years indicates three major floods, in 1988, 1998 and 2003, that caused extensive damage in terms of human lives and property. For example, 45,000 people incurred heavy damages as a result of the October 2003 flood (Julien et al. Citation2006). Problems associated with the catastrophic floods of the Muda River include riverbank erosion, river pollution and a reduction of water resources. Riverbed subsidence seriously affects river structures such as bridges and water-intake facilities. Moreover, the declining water level also causes difficulty in drawing water from the river at the existing intake points.
3 Methodology
3.1 Data and software requirements
The types of data used in this study for building the model of the 2003 flood event are: land use, soil, ground model (digital elevation model (DEM)), geometric cross-sections, ground roughness (channel and floodplain), field observations, hydrographs from 1960 to 2007, and coastal tidal data.
3.2 Data processing
3.2.1 Ground data extraction
In this study, a host of software packages were employed to extract and process several types of ground data. InfoWorks RS, a Wallingford Software package, was used to build the computer model; InfoWorks RS is a combined one-dimensional hydrodynamic ISIS flow simulation engine with GIS functionality and database storage that can perform one-dimensional hydraulic modelling for a full network and provide input and output information in tabular and graphical formats. This system is capable of performing steady and unsteady flow water surface profile calculations. The main objective of using this software in this study is to provide information on the variation of river water levels, discharges and velocities during flood events (Wallingford Software Citation2003).
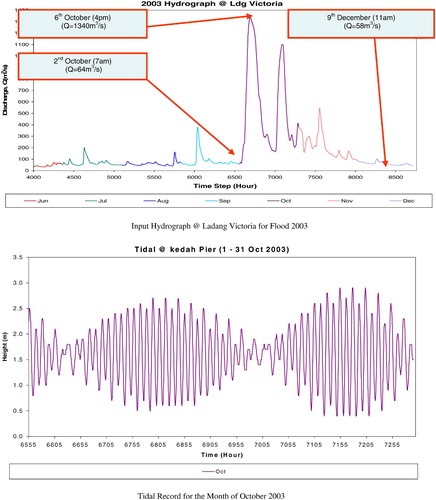
The inputs of the model included the geometry data of the 261 existing cross-sections between river mouth CH 0 and Ladang Victoria CH 41.2 at the upstream section of the Muda River. These data consist of lateral distances and elevations that were obtained from field surveys. The input hydrograph at Ladang Victoria from 1 January to 31 December 2003 was used to simulate the 2003 flood that occurred from 3 to 13 October 2003 (). The peak flood took place on 6 October 2003. The tidal record at the river mouth was used to define the time variation of the stage (water surface elevation) at a downstream cross-section. The geometry data, which were used to generate a DEM, were obtained from field surveys. These data consisted of the lateral distances and elevations of thousands of points along the river's path; the software ArcGIS 9.2 was used to extract the DEM.
Figure 2 Model input hydrograph and tidal information of the Muda River (Julien et al. 2006)
Field observations were carried out by visiting the site on several occasions to identify the geographical attributes of the area. For this purpose, a mobile GIS environment in the personal digital assistant device ASUS P535, which had fully operational ArcPad capabilities and GPS functionality, was used to collect the field data. The ground roughness data were assigned values for each zone to simplify digital processing in the constructed model. The following ground roughness data values were recorded: (i) the vegetation, (ii) substrate material (bed material, bank material or ground material) and (iii) an irregularity component. The floodplain vegetation components were divided into the following sub-categories: Equation(1) trees, Equation(2)
crops, Equation(3)
grass and Equation(4)
hedges.
The roughness zone gives a description of the characteristics of a particular terrain type from which a roughness value for that terrain type is calculated. In order to define areas on the ground with a certain terrain type, roughness polygons derived from digital SPOT-5 space imagery (2.5 m) were created and visualized using the GeoPlan View. Each polygon was then assigned to a roughness zone ID field that was classified under an appropriate reference zone. The soil vector data were incorporated into the ground zones in areas where the soil was a defining geographical attribute.
The difference between the water levels depends on the parcelling and the defined values of the ground roughness. Manning's roughness coefficient values were used in Manning's formula to calculate the flow in the open flow channels. Each ground material has a roughness coefficient (n) that may be assigned a particular value for conditions that exist at the time of a specific flow event, average conditions or anticipated conditions at the time of a future event. The roughness coefficient is generally considered to have the most uncertainty of any hydraulic or hydrologic variable in this type of model: the bed material and average grain size; surface irregularities of the channel; channel bed forms; erosion and depositional characteristics; meandering tendencies; channel obstructions; geometry changes between channel sections; and vegetation along the bankline and in the channel are all factors that affect the channel roughness (see ). According to the following velocity formula, an increase in the Manning coefficient of roughness (n) leads to a decrease in the velocity, and thus the water level will increase:
Figure 3 Distribution of roughness zone types visualized in the study area. A: wet padi; B: heavy stand of trees; and C: man-made features
3.2.2 River channel form analysis
The form of a river channel reflects the interaction between the discharge and sediment load with the materials in the river flows and the vegetation along its course. These interactions can also be expressed in other terms such as their characteristics along a cross-section or long profile. Channels that are formed in erodible sediments can be described as unconfined (alluvial or self-formed) channels and they may be subject to changes in location and form over time (Fookes et al. Citation2007). The properties of a channel interact in complex ways depending on the type of disturbance, the channel's morphological characteristics and the type and density of the surrounding vegetation. Expected channel responses to changes in the peak flow and water yield include bed coarsening, bank erosion, pool scour and, in extreme cases, channel incision (Knighton Citation1998). Under stable climatic conditions, the alluvial channel geometry is often assumed to be in equilibrium with the prevailing flows, slope gradient, sediment type, bank vegetation and valley constrictions. Empirical equations can be used to predict the changes in an alluvial channel (Hey Citation1997).
The channel form analysis used in the current study was based on the channel-type classification system of Rosgen Citation(1994) (see ). For this study, the channel pattern of the Muda River was described in terms of its sinuosity, S, which can be expressed by
Figure 4 Classification of channel types (after Rosgen Citation1994)
3.2.3 Flood model setup
To construct our model, AutoCAD data on 261 cross-sectional geometries of the river were imported into the InfoWorks RS environment. They were then collated with raster data, GPS point data and Vector GIS data under the unified projection of WGS84. A schematic of the flood model is provided in . The cross-sectional geometries were updated and manipulated in a way such that they were connected by lines in the GeoPlan view. The cross-sections were linked to form a continuous river bed feature. Two boundary nodes were added to fit the limits of the hydrograph and tidal stage within the studied time period.
Figure 5 Flowchart of the methodological approach to flood modelling in the GIS environment
A steady run type was chosen for the one-dimensional hydrodynamic simulation, and the result from this simulation was used as the input for the unsteady run type simulation. Under both steady and unsteady conditions, InfoWorks RS computes the flow depths and discharges using a method based on the equations for shallow water waves in open channels: the Saint-Venant equations that consist of a continuity equation (Eq. 3) and a momentum equation (Eq. 4). The solution of these equations defines the propagation of a flood wave versus the distance along the channel and time. For the continuity equation, we have
The cross-sectional average flow velocity used hereafter is defined as V = Q/A. The stage, y, and the discharge, Q, are the dependent variables that are determined by the simulation. The time, t, and distance, x, are independent variables, and all the other variables are functions of the dependent or independent variables. The InfoWorks RS model uses a four-point, implicit, finite-difference approximation to solve the Saint-Venant equations in full, with the proper boundary conditions. The scheme is structured so as to be independent of the specific wave description (kinematic, diffusive or dynamic).
4 Results and discussion
4.1 Channel form analysis
After applying Eq. 2 to the Muda River, the sinuosity, S, of the river channel was calculated as
and illustrate the temporal cross-sectional and longitudinal changes in the channel bed of the Muda River within the past 20 years, respectively. shows that active lateral erosion occurred on the river banks during the last 20 years and, as a result, the river's cross-sectional profile widened. shows the impact of selective erosion on a longitudinal profile of the river where erosion was active on the channel bed (vertical), causing river incision downstream relative to the upstream areas (far from the river mouth).
Figure 6 Comparisons of the present cross-section (new bridge) and the cross-section from the year 1993 (old bridge) (Julien et al. 2006)
Figure 7 Change to the longitudinal profile of the Muda River
Within the 20-year period examined here, the study area experienced increasing rates for the following anthropogenic activities: urbanization (4%), agriculture (1.35%), and land clearing (1.2%), as shown in . As more land cover is cleared out or altered by human activities, the combined influence of man-made structures and climatic changes, such as high rainfall over a short period of time (JICA Citation1995), accelerates the channel's broadening and thus facilitates more instability in the banks and erosion. Tree clearing influences the water yield in the stream while also changing the timing of the peak flow (MacDonald and Stednick Citation2003, Jones and Post Citation2004). The removal of the forest canopy causes a decrease in interception and transpiration in a basin, and a decrease in transpiration leads to an increase in the storage of water in the soil (MacDonald and Stednick Citation2003). These changes can also increase the soil moisture content by allowing more water to drain into the channels. Apart from these effects, tree clearing from logged sites can also cause an increase in erosion and subsequently increase the sediment yield (McGurk et al. Citation1996). Also, harvested areas can contribute up to five times more sediment than undisturbed sites (Motha et al. Citation2003). In terms of the potential channel responses to increased discharge, the riverine system can experience changes in the width-to-depth ratio of the channel due to greater undercutting at the banks and the movement of sediment and wood in the streams (Montgomery and Buffington Citation1997). As the channel boundary erodes, it causes changes to the grain size and bed form geometry, leading not only to an increase in the sediment transport capacity, but also to an increase in the pool scour or channel incision (Liébault et al. Citation2002, Marston et al. Citation2003). This bed incision can be accelerated further at points in the river where cohesive bank material, root reinforcement or bedrock exposure limit bank erosion (Fonstad Citation2003). In addition, when an increased sediment load is present and the channel becomes unable to transport that load, the river experiences aggradation, channel widening, bed fining and pool-filling (Rathburn and Wohl Citation2003).
Figure 8 Changes in the land use and land cover of the Muda area during the period 1984–2001
The overall impact of the disequilibrium in the erosion–sedimentation mechanism in the river bed causes the instability of the river system. As a consequence of this unbalanced system, many land areas in the Muda River area are prone to the hazard of flash flooding as a result of the deteriorated channel conditions.
4.2 Flood modelling and analysis
shows the flow analysis results and a ranking of the flooding events of the Muda River over a 44-year period. The results indicate that the 2003 flood event had the highest discharge measured during the specified period, when a discharge of 1340 m3/s was measured (based on measurable peak discharges at Ladang Victoria station). The flood frequency analysis by Gumbel Extremal Type I shows the 50-year flood peaks between 1254 and 1275 m3/s in . In this figure, the 2003 flood discharge of 1340 m3/s was slightly larger than the 50-year peak discharge. Consequently, this value was considered the design peak discharge for the lower Muda River (Julien et al. 2006).
Figure 9 Flood peaks of the Muda River from 1960 to 2005
Figure 10 Flood frequency analyses for the Muda River at Ladang Victoria based on Gumbel Extremal Type I for discharge data of 1960–2005
shows two cross-sections of the river bed used in the model at different locations with different roughness types. The roughness zone is a summation of vegetation, man-made features and surface materials. Each individual roughness zone value was incorporated into the computational matrices from the roughness database in InfoWorks RS. The simulation results shown in the two figures indicate that the model helped quantify the maximum and minimum water levels. It is shown that urban land use can be exposed to the maximum water level of about 2 m. This water depth is classified as the moderate hazard depth, according to a Japanese system (EXCIMAP Citation2007). This important information will be used as input data or reference for the mitigation plan in order to protect urban locations from future flooding events.
Figure 11 A schematic representation of the river's cross-section against the distribution of ground roughness zones at (a) CH 39.50 and (b) CH 15.00
The flooding behaviour of the Muda River is influenced by anthropogenic factors along with natural geomorphic and climatic factors. The expansion in Muda basin urbanization (i.e. road and pavement construction, buildings, drainage channels, bridges, hydraulic mining, fishing areas and sanitation work) during the past 20 years has caused an increase in the discharge of the river due to an increase in the impervious areas. For instance, paved streets, concrete structures and sewage systems in the urban areas of the Muda basin carry runoff quickly to the stream and result in a significantly higher hydrograph flow in a shorter length of time. The stream discharge rises and falls in urbanized areas much faster than in rural areas (Hyndman and Hyndman 2006). The roads approaching bridges that commonly cross the floodplain are above the planned flood level. This involves filling materials (which may change the surface roughness) and creating a partial barrier across the floodplain so that the river flow is restricted to the open channel under the bridge. In addition, deeper water under the bridge flows faster, causing erosion in the channel under the bridge and thereby increasing the sediment transport. The effect of streambed sand mining in the study area worsens the situation by deepening the channel and thereby increasing the erosion and sedimentation rate. Vegetation covering the Muda area has been long under stress because of unsustainable human activities such as deforestation, logging and overgrazing. This has been an important input for the riverine system's disequilibrium, as the removal of vegetation increases the vulnerability of the surface material. These man-made factors cause the sediment transport capacity of the Muda to increase and disturb the whole system's equilibrium and facilitate the recurrence of flooding.
4.2.1 InfoWorks RS calibration
shows the calibration results of the predicted water level for the two cross-sections at CH 41.2 and CH 14.2 projected against observed water levels for different Manning values based on the hydrograph of the 2003 flood (). For a Manning value of 0.03 for the main channel, the predicted values for the water level agree the best with the observed values. Therefore, this Manning value was used in the simulations.
Figure 12 A comparison between the predicted and observed water level values at (a) CH 14.0 and (b) CH 41.2
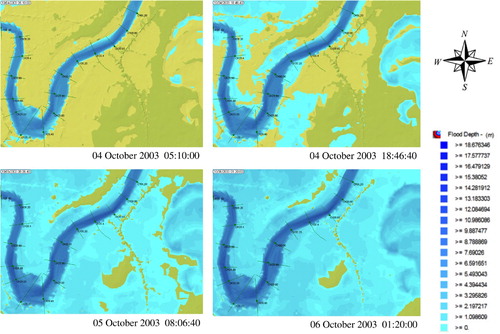
Using the discharge data in InfoWorks RS for processing the model, the behaviour of the 2003 flooding event was readily simulated and visualized graphically as shown in . The figure shows the rapid flashing, wide spatial extension and depth at the early hours of flooding, which caused widespread damage to the surrounding landscape. The model also indicated that the maximum depth of the flood within the channel was greater than 18 m.
Figure 13 Real-time geographical visualization of the 2003 flooding event as processed in InfoWorks RS (CH 28.00–CH 31.00)
4.2.2 InfoWorks RS simulation
The simulated water profile for the 1984 flood (), which can be compared with that of the 2003 flood (), is shown in . The flood hydrographs were used to represent the effect of land usage change over the last 20 years (1984–2003). As a result of land-use changes due to rapid development in the river basin, the water level has dramatically increased in the past 20 years. The removal of the vegetation cover and sand mining activity are expected to give rise to river bed degradation and bank instability.
Comparisons on the effects of recent floods in 2003 () and 2005 () are given in . shows that wet paddy is more susceptible to flooding compared with other land uses. Also, the total inundated areas for the 2003 flood is almost double that of the 2005 flood. The number of houses inundated in the 2003 flood is given in according to different water levels. As a result of the 2003 flood, a flood mitigation project was initiated and is being implemented involving river widening and the construction of levees on both banks of the Muda River. This project is expected to give protection to the economic activities along the Muda River.
Figure 14 Hydrograph of the 1984 flood
Figure 15 Comparision between the 1984 and 2003 flood conditions
Figure 16 2005 Flood hydrograph
Figure 17 Inundated areas for 2003 and 2005 floods. (a) December 2005 peak flow flood (CH 15.00–CH 20.00) and (b) October 2003 peak flow flood (CH 15.00–CH 20.00)
Table 1 Simulated inundation areas according to land-use categories
Table 2 Simulated inundation areas for urban areas during 6 October 2003 flood
5 Conclusions
Erosion and sedimentation are dynamic processes resulting from the interaction between the flowing water and sediment bed. The model developed in this study is a valuable tool for analysing the numerous proposed flood mitigation options and flood risk management.
The channel form analysis of the Muda River presented in this paper does imply that the stream is Type C, as indicated by its high sinuosity S > 1.4. The changes to the cross-sectional and longitudinal profiles of the stream channel that occurred within the last 20 years indicate both active lateral erosion on the banks (widening of the river) and vertical erosion on the river bed (channel incision). This erosion, which is a result of the geomorphological meandering nature of the Muda River system, has serious implications for engineering activities in this area. In addition, other factors such as new land usages also worsen the state of the river.
It can be seen that within a time frame of 20 years, human activities have changed many features of this river system. Moreover, activities such as land clearing, deforestation and urbanization have exposed the river system to erosion hazards and a reduction in the general surface roughness of the ground. Since the flood plain of the Muda River is expected to host more development in the future, more of the land will be vulnerable to erosion hazards and, consequently, subject to the risk of flooding. This result is supported by the flood modelling software InfoWorks RS. By using this computer simulation tool, one is able to indicate the potential high-risk areas of the Muda River. Also, this study can help developers and authorities in the Muda area make decisions and take action on flood prevention measures.
Related Research Data
References
- Abdullah , K. Integrated river basin management: river towards sustainable development . Proceeding of the national conference on rivers . October 14–17 . pp. 3 – 14 . Penang, , Malaysia
- Department of Irrigation and Drainage Malaysia (DID) . 2000 . Urban stormwater management manual for Malaysia or MSMA , Pencetakan National Malaysia Berhad (PNMB), Kuala Lumpur, Malaysia
- EXCIMAP . 2007 . Handbook on good practices for flood mapping in Europe, European exchange circle on flood mapping , Available from: http://ec.europa.eu/environment/water/flood risk/flood atlas/index.htm (Accessed 15 February 2008)
- Fonstad , M. A. 2003 . Spatial variation in the power of mountain streams in Sangre de Cristo Mountains, New Mexico . Geomorphology , 55 ( 1–4 ) : 75 – 96 .
- Fookes , P. G. , Lee , E. M. and Griffiths , J. S. 2007 . Engineering geomorphology: theory and practice , Boca Raton, FL : CRC Press .
- Hey , R. D. 1997 . “ Stable river morphology ” . In Applied fluvial geomorphology , Edited by: Thorne , C. R. , Hey , R. D. and Newson , M. D. 223 – 226 . Chichester, NY : Wiley .
- Houben , P. , Hoffmann , T. , Zimmermann , A. and Dikau , R. 2006 . Land use and climatic impact on the Rhine system (RhineLUCIFS): quantifying sediment fluxes and human impacts with available data . Catena , 66 ( 1–2 ) : 42 – 52 .
- Hyndmau, D. and Hyndman, D., 2006. Natural hazards and disasters. Belmont, CA: ThomasBooks/Cole.
- Islam , M. M. and Sado , K. 2000 . Flood hazard assessment in Bangladesh using NOAA AVHRR data with geographical information system . Hydrological Processes , 14 ( 3 ) : 605 – 620 .
- Jansen , J. D. 2006 . Channel sinuosity: another angle on steady-state and transient response in bedrock river draining active mountain belts . Geophysical Research Abstracts , 8 ( 02309 ) SRef-ID: 1607-7962/gra/EGU06-A-02309
- Japan International Cooperation Argency (JICA) . 1995 . Comprehensive management plan of Muda river basin , Final report SSS CR(1) 95–154, JICA, Tokyo, Japan
- Jones , J. A. and Post , D. A. 2004 . Seasonal and successional streamflow response to forest cutting and regrowth in the northwest and eastern United States . Water Resources Research , 40 ( 1–2 ) W05203
- Julien , P. Y. 2006 . Design option of the flood mitigation plan of Sg. Muda, Sungai Muda, Kedah , 149 Kuala Lumpur, , Malaysia : Department of Irrigation and Drainage . Research Report No. JPS(PP)/TB/2/06
- Knighton , D. 1998 . Fluvial forms and processes: a new perspective , 400 New York : Oxford University Press .
- Lane , S. N. and Richards , K. S. 1997 . Linking rive channel form and process: time, space and causality revised . Earth Surface Processes and Landforms , 22 ( 3 ) : 249 – 260 .
- Liébault , F. 2002 . Contemporary channel changes in the Eygues basin, southern French Prealps: the relationship of sub-basin variability to watershed characteristics . Geomorphology , 45 ( 1–2 ) : 53 – 66 .
- MacDonald , L. H. and Stednick , J. D. 2003 . Forests and water: a state-of-the-art review for Colorado , 65 Fort Collins : Colorado Water Resources Research Institute, Colorado State University . Sponsored by Colorado River Water Conservation District, CWRRI, Denver Water, Northern Colorado Water Conservancy District, eds.
- Marston , R. A. , Bravard , J. and Green , T. 2003 . Impacts of reforestation and gravel mining on the Malnant River, Haute-Savoie, French Alps . Geomorphology , 55 ( 1–4 ) : 65 – 74 .
- McGurk , B. J. , Berg , N. H. and Davis , M. L. 1996 . Camp and Clear Creeks, El Dorado County: predicted sediment production from forest management and residential development , Vol. II , 1407 – 1420 . Centers for Water and Wildland Resources, University of California, Davis . Assessments and Scientific Basis for Management Options, Sierra Nevada Ecosystem Project, Final Report to Congress
- Montgomery , D. R. and Buffington , J. M. 1997 . Channel-reach morphology in mountain drainage basins . Geological Society of America Bulletin , 109 ( 5 ) : 596 – 611 .
- Motha , J. A. 2003 . Determining the sources of suspended sediment in a forested catchment in southeastern Australia . Water Resources Research , 39 ( 3 ) : ESG 2-1 – 2-4 .
- Pender , G. and Néelz , S. 2007 . Use of computer models of flood inundation to facilitate communication in flood risk management . Environmental Hazards , 7 ( 2 ) : 106 – 114 .
- Rathburn , S. and Wohl , E. 2003 . Predicting fine sediment dynamics along a pool-riffle mountain channel . Geomorphology , 55 ( 1–4 ) : 111 – 124 .
- Richards , G. A. , Julien , P. Y. and Baird , D. C. 2005 . Statistical analysis of lateral migration of the Rio Grande, New Mexico . Geomorphology , 71 ( 1–2 ) : 139 – 155 . DOI: 10.1016/j. geomorph.2004.07.013
- Rosgen , D. L. 1994 . A classification of natural rivers . Catena , 22 ( 3 ) : 169 – 199 .
- Sanyal , J. and Lu , X. X. 2005 . Remote sensing and GIS-based flood vulnerability assessment of human settlements: a case study of Gangetic West Bengal, India . Hydrological Processes , 19 ( 18 ) : 3699 – 3716 .
- Schumm , S. A. 1974 . “ Geomorphic thresholds and complex response of drainage systems, in fluvial geomorphology ” . In Publications in geomorphology , Edited by: Morisawa , M. 299 – 310 . Binghamton, NY : SUNY .
- Toy , T. J. , Foster , G. R. and Renard , K. G. 2002 . Soil erosion: processes, prediction, measurement and control , 338 New York : John Wiley and Sons .
- Wallingford Software . 2003 . InfoWorks RS: an integrated software solution for simulating flows in rivers in channels and on floodplains , Available from: http://www.wallingfordsoftware.com/products/infoworks_rs/ [Accessed 14 November 2003]