Abstract
The effect of an exotic and invasive plant, Eragrostis curvula, on the threshold of gravel movement and wash-out conditions of the plant due to flood was investigated in the midstream Arakawa River, Japan. Under various hydraulic conditions (grain diameter, bed slope, and water depth) and plant growth characteristics (clump diameter and plant density), the Shields parameter of the gravel in the plant-vegetated area was estimated using the drag characteristics of the plant measured directly in field and wind tunnel experiments, and the plant's effect on friction velocity was evaluated. The removal threshold of E. curvula could be defined when the friction velocity around the plants was equal to the critical friction velocity of d 84 grain diameter at which 84% volume passed through the sieve. The threshold condition was found to be well expressed by the relationship between the bed slope direction component of the water weight and the drag characteristics due to the plant MD c 1.5, where M is the plant density and D c the clump diameter of E. curvula.
1 Introduction
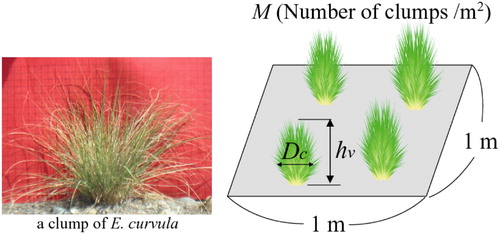
Eragrostis curvula, also known as weeping lovegrass, is an invasive plant that affects the biodiversity of gravel bed bars (Matsumoto et al. Citation2000) by increasing the deposition of sediment in the plant's wake (Nakatsubo Citation1997, Tanaka et al. Citation2004). Eragrostis curvula vegetation is found in 107 of the 123 rivers investigated in Japan (River Bureau of the Ministry of Land, Infrastructure, Transport and Tourism, Japan Citation2008). It is classified as a plant that needs to be controlled in Japan. It is controlled by harvesting in the Yoshinogawa and Kinugawa rivers. Harvesting is hard work, and the cost is sometimes high, so it is important to determine the removal condition of the plants by natural flood. Initiation of gravel movement by a natural flood requires a larger flood than required before the intrusion of the plant because the vegetation provides a large drag on the flow field and changes the threshold of gravel movement in the vegetated zone and, thus, the wash-out condition of the plant itself. Eragrostis curvula forms large-diameter clumps, and the volumetric porosity of a clump is very high, as shown in (hereafter called clump-type vegetation). Eragrostis curvula sometimes accelerates the forestation in a river because it accumulates a large amount of sediment.
Figure 1 Photograph of a clump of E.curvula and the definition of key parameters in this study. D c: clump diameter (m), h v: clump height (m), M: clump density (number of clumps / m2)
The methods currently used to evaluate the wash-out condition of plants are to:
Equation(1) estimate the threshold velocity (USDA Citation1947, Gregory and McCarty Citation1986), 2) analyse the plant correspondence to equivalent diameters of gravel (Parsons Citation1963), (3) estimate threshold shear stress (Temple Citation1980, Egger et al.
Citation2007), and (4) examine the relative water depth and permissible deflection (Kouwen and Li Citation1980, Kouwen Citation1992, Samani and Kouwen Citation2002). However, these studies do not consider the plant growth stage (plant height, diameter of the clump-type vegetation, and plant density) and cannot be applied to evaluation of the wash-out condition of E. curvula of different ages growing on gravel bars.
To evaluate the washout condition of plants, the effect of vegetation on flow resistance in a river or channel flow must be elucidated (Petryk and Bosmajian Citation1975, Kouwen et al. Citation1981, Nepf Citation1999). The roughness characteristics, momentum loss, and shear stress have been investigated for emergent vegetation or circular cylinders arranged in a grid or staggered in a flume (Smith et al. Citation1990). In addition to grid-type roughness, a sparse macro-roughness was sometimes observed in the initial growth stage of trees (Järvelä Citation2002) and sparsely distributed bushes, shrubs, and grasses (Musik et al. Citation1996, Righetti and Armanini Citation2002, Kamrath et al. Citation2006) in a river. However, except for experiments using a group of circular cylinders (Musik et al. Citation1996), perforated plates (Castro Citation1971), or clump-type vegetation (Tanaka et al. Citation2004, Takemura and Tanaka Citation2007), only a few studies have been conducted on sparsely vegetated clump-type roughness. Thus, many aspects of the flow structures around the clump-type roughness of plants such as E. curvula are still unclear (Yagisawa and Tanaka Citation2007). In addition, the density of the vegetation is an important parameter that determines the flow resistance and form drag (Ming and Shen Citation1973, Petryk and Bosmanjian 1975, Nepf Citation1999, Takemura and Tanaka Citation2007).
Therefore, we hypothesized that the plant characteristics in different growth stages, especially the clump diameter of the vegetation and plant density, greatly affect the gravel movement and plant removal condition.
Considering the above situation, the purpose of this study was to elucidate the removal condition of the plants in relation to the change of threshold of gravel movement. For that objective, the drag and growth characteristics of a clump-type vegetation were investigated because they affect the shear stress around vegetation. This study proposes a method to analyse the above characteristics based on field observation and drag-force measurement considering the gravel size at the habitat with changing density and relative water depth of the plant. To validate the proposed method, the calculated wash-out condition of E. curvula was compared with the actual wash-out situation of E. curvula vegetated on different gravel-bed bars.
2 Materials and methods
To elucidate the washout condition of E. curvula in relation to the clump diameter of the vegetation and plant density, a method to estimate the threshold values for gravel movement is given in Section 2.1. The important values for the analysis, the average velocity of approaching flow u, drag coefficient C d, and plant characteristics (plant density, clump diameter), are explained in Sections 2.2–2.4, respectively. To evaluate whether the gravel moves under the effect of the vegetation or not, the friction velocity, u *, in Section 2.1 needs to be compared with the critical friction velocity, u *c, of the bed material. Section 2.5 explains the evaluation method of u *c. Finally, the calculation used to analyse the wash-out condition of E. curvula is explained in Section 2.6.
2.1 Estimating effective shear stress for washing out E. curvula
Local scour occurs around a clump, but it is not large under the clear-water scour condition because armouring occurs in the process of scouring (Yagisawa and Tanaka Citation2007). Thus, for clump removal, the average friction velocity around plants must be larger than the critical friction velocity of the bed material in the vegetated zone.
As a control volume of the unit bed area extending from the bed to the water surface, the momentum balance in the stream-wise direction gives
2.2 Determination of the mean velocity
The mean velocity u was calculated using the Manning equation and Manning roughness coefficient with vegetation, n w, proposed by Petryk and Bosmajian Citation(1975) and that without vegetation, n b, as a function of median grain diameter, d m (Andersen et al. Citation1970) as below:
2.3 Drag coefficient of E. curvula
2.3.1 Experimental condition of drag force measurement in field and wind tunnel
Drag coefficient (C d) is very important to estimate the friction velocity in Eq. 2. One of the most important parameters that affect the variation of C d is the bending angle of plants (Sand-Jensen Citation2003) and the relative plant height to water depth, h v-def/H (Wu et al. Citation1999). The deflected plant height in a flood event can be estimated by using the bending stiffness EI M (E is Young's modulus (N/m2) and I M the second moment of area (m4)). Then, the bending stiffness of the clump, EI M, was examined in the field. The deflected plant height and C d were calculated in the flood condition.
The drag force acting on E. curvula was directly measured in the field and in a wind tunnel using real plants, and the drag coefficient was estimated for use in Eq. 3. The experimental condition is shown in . Because wash-out usually occurred in the submerged condition, the experiment was conducted with a value of h v-def/H smaller than 1.0. The measurement device and wind tunnel flume restricted the plants to 5–20 cm diameter clumps in the experiment. The Reynolds number R e (=uD c/ν, where u is the velocity of the water (m/s) approaching the plant and ν the kinematic viscosity (m2/s)) in the wind tunnel and field experiments, which ranged between 1.5 × 10⁴–1.6 × 10⁵ and 2.2 × 10⁴–1.2 × 10⁵, respectively.
Table 1 Experimental conditions for drag force measurement on E. Curvula
2.3.2 Wind tunnel experiment to measure drag force on E. curvula
Experiments were carried out in the Eiffel-type non-circulating wind tunnel apparatus shown in . The wind tunnel is 11.3 m long and has a 4 m working section that is 0.5 m wide and 0.5 m high in cross-section. The force gauge was set under the bottom of the wind tunnel. The drag force on E. curvula was directly measured, and the drag coefficient was estimated as:
Figure 2 Measurement of drag force acting on E. curvula and a clump model. (a) Wind tunnel experiment, (b) schematic of the measurement method in a river (L 1, L 2 is 65 cm, 45 cm, respectively, in this study)
2.3.3 Field measurement of drag on E. curvula
An instrument similar to that of Hygelund and Manga Citation(2003), as shown in , was used for the measurement of the drag in the river. Because the moment due to drag force (F 1) and the moment due to applied force (F 2) from the force gauge are the same, the drag coefficient can be estimated as:
2.3.4 Drag characteristics of E. curvula in submerged condition
shows the relationship between relative plant height and water depth (h v-def/H) and the drag coefficient. Each experimental condition is shown in . The C d value declined sharply with decreasing h v-def/H from 1 to 0.8, but it approached a constant value of about 0.2 when h v-def/H was below 0.8. Thus, the C d in Eq. 3 was applied as a function of h v-def/H using the modelled lines in .
Figure 3 Relationship between relative plant height to water depth and the drag coefficient C d of E. curvula. h v-def is the deflected plant height, H is the water depth
2.4 Field investigation of E. curvula
To obtain the necessary data in Eqs 1–4, which are especially related to the characteristics of E. curvula, field observation was conducted at gravel-bed bars in the Arakawa River (36°8′N and 139°21′E), Japan (). There were large E. curvula-vegetated regions at Arakawa-ohashi and Kumagaya-ohashi (AR and KU, respectively, in ). The vegetated regions at AR and KU are 200 m in the stream-wise and 40 m in cross-stream direction and 80 m in stream-wise and 20 m in cross-stream direction, respectively. In this study, the vegetated region of E. curvula is classified as a ‘fringe region’ and a ‘centre region’. The fringe region is defined as the area where the plant grows to within 5 m from the vegetation edge. The centre region is defined as the entire vegetation area except the fringe region ().
Figure 4 Field investigation site and differences in vegetation density and clump size of E. curvula. (a) Arakawa-ohashi (AR): SF is fringe region of the vegetation, SC is the centre region of the vegetation (in SF and SC region, clump size and the density is low, D c = 10–20 cm), DF is fringe region of the vegetation, DC is the centre region of the vegetation (in DF and DC region, clump size and the density is high, D c = 30–50 cm), (b) Kumagaya-ohashi, KU: clump size and the density is low, D c =10–20 cm
The characteristics of E. curvula were measured at AR. The volumetric porosity inside the clump, clump diameter (D c), clump height before and after the flood, bending stiffness EI M , and clump density (M, clumps/m2) of E. curvula were investigated. The circumference of E. curvula was measured by binding the clump at 5 cm from the ground, and the D c was calculated as the equivalent diameter of a circular cylinder. Because the upper 50% part of the clump is easily bent and the lower 50% can be considered more important, the deflection was measured by pulling the clump at the centre of the lower 50%, i.e. 25% of the plant height from the bed. EI M was calculated by the deflection and pulling force. The habitat of E. curvula was the rather higher part of the gravel bar, so emergent and submerged conditions were mixed during two flood events, Typhoons 22 and 23 in 2004. The plants become fully submerged in Typhoon 16 in 2006 and Typhoon 9 in 2007. The inclination of the clump after a flood event in 2004 when some plants were not fully submerged (hereafter ‘small flood’) differed with the clump diameter. The angles of clumps with 10 and 50 cm diameters were about 70° and 40°, respectively. However, the inclination of the clumps within the range of 10–50 cm in diameter was not very different (60–70°) after they were fully submerged in the floods in 2006 and 2007. This indicates the importance of evaluating the effect of inclination for deciding the C d for a small flood, but it may be assumed to be constant when we analyse the wash-out condition of the plant considering the 2006 and 2007 situation.
Characteristics of E. curvula are shown in –(c). shows the relationship between D c and shoot height (h v (m)) before and after a flood in 2006. Because the bending stiffness increased with increasing D c (), the power of D c to express h should differ. However, when we discuss the plant wash-out due to floods, most of the plant bending exceeds its elastic range. Thus, the power of D c to express h v is not much changed before and after a flood (h v is a function of D c 0.5). shows the relationship between D c and the plant density (clumps/m2). The number of clumps decreases with increasing clump diameter due to self-thinning. The number of clumps and plant height are very important when we estimate the drag force through the plant projected area. From this result, we can say that MD c 1.5 (=MD c h v) is an important parameter for analysing the effect of the plant on the threshold for gravel movement.
Figure 5 Characteristics of E. curvula, relationship between: (a) D c and shoot height (h v (m)), (b) D c and plant density (clumps/m2), and (c) D c and bending stiffness EI M (E: Young's modulus (N/m2), I M: second moment of area (m4))
2.5 Determination of critical friction velocity
The critical friction velocity of the median size gravel, τ*cm, and other size gravels, τ*ci, was assumed by using the Shields parameter and Egiazaroff formula:
By comparing the friction velocity, u *, in Eq. 2, and the critical friction velocity, u *c, of the median diameter or each classified diameter in Eq. 9, whether or not the diameter grain moves under the effect of the vegetation can be analysed. For evaluating the Shields parameter in Eqs 9 and 10, the grain size distributions around E. curvula clumps were measured by sieves. The grain diameters at which 50% and 84% volumes passed through the sieve, d 50 and d 84, respectively, were decided by size distribution.
2.6 Condition for calculating friction velocities around E. curvula
To analyse the change in the threshold for gravel movement around E. curvula under various hydraulic conditions, the bed slope I and the water depth H were changed to I = 1/375–1/1000 and H = 1.0–6.0 m, respectively. The gravel diameters d 50 and d 84 were set as 0.9–2.9 and 2.3–6.4 cm, respectively (). The ranges of each parameter were set as the lower and upper limits obtained in the field. Comparing the critical friction velocity for d 50 or d 84 with the friction velocity affected by the change of the drag force and friction velocity around E. curvula, the threshold number of clumps (M) for resisting the wash-out by floods in each clump diameter (D c) was analysed.
Table 2 Conditions for calculating friction velocities around E. curvula
3 Results
3.1 Vegetation condition of E. curvula after flood events
3.1.1 Local scour around E. curvula after flood events
Local scour around E. curvula occurred at flood events (), similar to the flow around an obstacle on a flat plate (Baker Citation1980, Tamai et al. Citation1987, Shamloo et al. Citation2002) or trees in a river (Nakayama et al. Citation2002). Strong detour flows or horseshoe eddies were assumed to cause the local scour around the vegetation. Non-dimensionalized local scour depths by the root penetration depth (h s/L R) around E. curvula as a function of H/D c are shown in . The local scour depth around E. curvula is quite small compared with the root penetration depth. In addition, the bed material inside the scour hole was larger than d 50 and close to d 84. The small local scour depth and bed material remaining in the scour hole indicate that the plant is hardly washed out by the local scour itself. The averaged shear stress itself needs to be larger than the critical shear stress of the bed material. Therefore, the wash-out condition may be expressed by d 84 gravel movement in the vegetated region, because the four equations (Eqs 1–4) do not consider the local shear stress around a plant but the average shear stress in a vegetated field.
Figure 6 Local scour around E. curvula. (a) Relationship between the flood water depth (H (m)) and the local scour depth (h s (m)), and (b) photograph of the scouring situation around E. curvula after a flood. D c is the clump diameter (m), L R is the root penetrating depth (m)
3.1.2 Wash-out situation of E. curvula at two investigated sites
The critical shear stress of d 84 during flooding in which the effective shear stress, τ e, exceeded τ c84 was analysed at AR and KU (). The durations of AR(DC) and KU(SC) were 14 and 17 h, respectively. The 3 h difference between AR and KU existed even though the maximum trace water depths at AR (=2.8 m) and KU (=2.9 m) were almost the same as in the 2007 flood. Moreover, due to the difference in the growth conditions (i.e. plant density, clump diameter), τ e at KU(SC) was higher than at AR(DC). In addition, E. curvula at AR (SF) was not washed out in the 2006 flood because the flood duration was only 6 h and τ e was not very high relative to τ c.
Figure 7 The comparison of the duration time in which τ e exceeded τ c84 at the AR and KU. τ e: the shear stress considering the clump diameter and plant density of E. curvula, τ c84: is the critical shear stress of d 84. The site characteristics are shown in . SC, DC and SF are defined in . The blank symbols mean E. curvula did not wash out due to flood. The filled symbol mean washed out due to flood
3.2 Analysis of threshold of gravel movement around E. curvula
The threshold of gravel movement changes according to the size and density of the clumps. When we solve Eqs 1–4 by changing D c, M, we get u *. Then, we can determine the d s-crit by Eq. 9. demonstrates the relationship between D c and the threshold gravel size for movement, d s-crit, as a function of the number of clumps, M (clumps/m2), when H is 2 m, I is 1/400, and d 50 is 1 cm. The data shown in this figure are the solution to Eqs 1–4 and 9 as a function of D c, M. The dashed line shows the mean gravel diameter at the investigated site. This figure indicates that the mean diameter of gravel was assumed to move when the plant densities and clump diameters are 2, 4, 8, and 16 (clumps/m2) and 0.19, 0.29, 0.39, and 0.5 m, respectively. This example shows that when the density of clumps is 16 clumps/m2 and the size D c is 0.1 m, d s-crit is about 2 cm, which is larger than the mean gravel diameter (1 cm) at the AR site. However, if the clump size increases to 0.5 m, the 1 cm gravel becomes hard to move even if the plant density is 1 clump/m2. This indicates the importance of the countermeasure timing because earlier is better if there are no floods.
Table 3 Field and river characteristics used in this study
Figure 8 Relationship between D c and threshold size of movement, d s-crit, as a function of the number of clumps, M (clumps/m2). The dashed line shows the mean diameter at the investigated site (H = 2 m, I = 1/400, d 50 = 1 cm)
4 Discussion
4.1 Proposed general method to judge whether E. curvula will be washed out by floods or not
In , the effect of E. curvula on the immobility of gravel around the plant is shown. Here, we extend the idea and propose a generalized method to judge whether the exotic and invasive plant E. curvula in Japanese rivers will be removed or not by a flood. Under the conditions in , the same analyses as shown were conducted. From the calculation, the data set of (M, D c), which represents the critical condition of the movement of the mean diameter, is derived. From the data set, we can calculate the important parameter MD c 1.5 as was explained in Section 2.4 and estimate the critical value of the water weight to bed slope direction from the parameter MD c 1.5. shows a schematic of how to derive the critical condition of water weight to bed slope direction. The horizontal axis shows the water weight to the bed slope direction, and the vertical axis (MD c 1.5) represents the drag characteristics of the plant, as already shown in . As the number of clumps of E. curvula is decreased with the increasing D c, the parameter MD c 1.5 has a maximum value. We call this the maximum growth line (MGL) in . The effect of the plants is relevant only below this line. The schematic shows that the MGL is 0.5, but this value changes with D c as shown in . Line A shows the threshold for gravel movement. With the same gravel size, the plant effects become smaller with increasing water weight to bed slope ρgHI. If the plant growth condition (MD c 1.5) is larger than the value of line A with the same ρgHI, the gravel does not move. Then, the intersection of MGL and Line A (TP) expresses the critical value of ρgHI for gravel movement (hereafter, (ρgHI)crit). When ρgHI exceeds this (ρgHI)crit, the plant cannot stop the gravel movement even if it grows to its maximum MD c 1.5. In summary, we can divide into three regions: (a) Region I, in which gravel cannot move if MD c 1.5 is larger than the value in line A; (b) Region II, in which gravel can move if MD c 1.5 is smaller than the value in line A; and (c) Region III, in which gravel can move even if MD c 1.5 is maximum. In , this concept is applied to d 84 at the AR site (I is 1/375, d 84 is 3.2 cm). The line A and MD c 1.5 changes with D c. The (ρgHI)crit for d 84 is increased with increasing D c. This means we need a larger flood to uproot larger clumps of E. curvula vegetation. A similar method also can be applied for d 50 and (ρgHI)crit for d 50 can be estimated.
Figure 9 Relationship between water weight on the bed (slope direction), ρgHI, and the representative parameter for growth and the drag, MD c 1.5. (a) Schematic of the relationship between (MD c 1.5)crit and (ρgHI)crit, (b) change of (ρgHI)crit,as a function of D c (I = 1/375, d 50 = 0.9 cm)
4.2 Validation of method to derive wash-out condition of E. curvula
(ρgHI)crit can be estimated as a function of D c by the method shown in . By using the river and flood characteristics in , the proposed model is validated as shown in . shows the threshold line for the movement of d 50 and d 84. The figure also includes the information on whether clumps of E. curvula were washed out or not at the flood event due to Typhoon 9 in 2007 and the flood event due to Typhoon 16 in 2006. It also distinguishes whether E. curvula was growing in the fringe area or the centre area of the AR site (). The upper region of the linked (ρgHI)crit line in shows that the substrate of the plant can move. The (ρgHI)crit for d 50 does not express the wash-out condition well, but it does express the threshold for the plant removal for d 84 well, except for the plants in the centre region. This study proposes a simple method to judge the probability of E. curvula removal; however, the velocity and shear stress are assumed to be changed inside the vegetation similar to the bed roughness change (Chen and Chiew Citation2003), so further study is needed to apply this method to large patches of vegetation. The method proposed in this study can be applied to the centre region of E. curvula vegetation at KU (Plot A in ). In the centre region of E. curvula vegetation at AR (Plot B in ), however, E. curvula vegetation was not washed out even if ρgHI exceeded (ρgHI)crit because, as shown in , the flood duration during which the d 84 around E. curvula vegetation can be moved was different and the effect was not considered in this method. Moreover, the scouring depths of AR(DC) and KU(SC) after the 2007 flood were 5 cm (around 20% of the root penetration depth of the plants at AR) and 10 cm (around 80% of the root penetration depth of the plants at KU). This indicates that not only the flood duration but also the scouring depth are important for evaluating the washing out of E. curvula due to flood. Further studies of the flood duration and scouring depth will be conducted, and the effects will be included in the model in future.
Figure 10 Validation of the wash-out condition of E. curvula. (a) Fringe region in Arakawa River, (b) centre region in Arakawa River. The site characteristics are shown in
5 Conclusion
Field observations were conducted to elucidate the effects of E. curvula on the threshold of gravel movement in the midstream of the Arakawa River. Using the drag characteristics of the plant, the Shields parameter of the gravel in the plant-vegetated area was estimated under various hydraulic conditions (particle diameter, bed slope, and water depth) and growth conditions (clump diameter and plant density), and the effect of the plant on the friction velocity was calculated. The thresholds of gravel movement of median grain sizes d 50 (50% of the grains) and d 84 (84% of the grains) around the plants were evaluated by comparing the friction velocity of the flow condition with the critical friction velocity of the diameter. The removal threshold of E. curvula was defined as that at which the friction velocity affected by the representative parameter for plant drag MD c 1.5 is equal to the critical friction velocity of d 84. The threshold condition related to ρgHI and the drag by plant MD c 1.5 was validated for two floods in the Arakawa River. The proposed method is applicable to the fringe area of E. curvula vegetation, although this method does not consider scouring depth around E. curvula and flood durations in which the shear stress exceeds the critical shear stress. More study is needed to analyse large vegetated areas because the flow velocity and the shear stress are changed inside the vegetation area, and the effects of flood duration and scouring depth may be changed with the vegetation size.
Acknowledgement
This research was partially supported by the Foundation of River and Watershed Environment Management (FOREM) of Japan.
References
- Andersen , A. G. , Paintal , A. S. and Davenport , J. T. 1970 . Tentative design procedure for riprap lined channels , 129 – 130 . McGraw-Hill Science . NCHRP Report 108. In: Strum, T.W. (2001). Open Channel Hydraulics
- Baker , C. J. 1980 . The turbulent horseshoe vortex . Journal of Wind Engineering and Industrial Aerodynamics , 6 : 9 – 23 .
- Baptist , M. J. 2007 . On inducing equation for vegetation resistance . Journal of Hydraulic Research , 45 ( 4 ) : 435 – 450 .
- Castro , I. P. 1971 . Wake characteristics of two-dimensional perforated plates normal to an air-stream . Journal of Fluid Mechanics , 46 ( 3 ) : 599 – 609 .
- Chen , X. and Chiew , Y. M. 2003 . Response of velocity and turbulence to sudden change of bed roughness in open channel flow . Journal of Hydraulic Engineering , 129 ( 1 ) : 35 – 43 .
- Egger , G. 2007 . Simulated effects of dam operation and water diversion on riparian vegetation of the lower Boise River, Idaho, USA . 32nd IAHR congress , CD-ROM
- Einstein , H. A. 1950 . The bed-load function for sediment transportation in open channel flows . USDA Technical Bulletin , 1026 : 71
- Gregory , J. M. and McCarty , T. R. 1986 . Maximum allowable velocity prediction for vegetated waterways . Transanctions of the ASAE , 29 ( 3 ) : 748 – 755 .
- Hygelund , B. and Manga , M. 2003 . Field measurements of drag coefficients for model large woody debris . Geomorphology , 51 : 175 – 185 .
- Järvelä , J. 2002 . Flow resistance of flexible and stiff vegetation: a flume study with natural plants . Journal of Hydrology , 269 : 44 – 54 .
- Kamrath , P. , Rubbert , S. and Köngeter , L. 2006 . The effects of bottom settlement, vegetation and macro-roughness on the erosion stability of the relocated River Inde . International Journal of River Basin Management , 4 ( 1 ) : 31 – 38 .
- Kouwen , N. 1992 . Modern approach to design of grassed channels . Journal of Irrigation and Drainage Engineering , 118 ( 5 ) : 733 – 743 .
- Kouwen , N. and Li , R. M. 1980 . Biomechanics of vegetative channel linings . Journal of Hydraulics Division, ASCE , 106 ( 6 ) : 1085 – 1103 .
- Kouwen , N. , Li , R. M. and Simons , D. B. 1981 . Flow resistance in vegetated waterways . Transactions of the ASAE , 24 ( 3 ) : 684 – 698 .
- Matsumoto , J. , Muraoka , H. and Washitani , I. 2000 . Whole plant carbon gain of an endangered herbaceous species Aster kantoensis and the influence of shading by an alien grass Eragrostis curvula in its gravelly floodplain habitat . Annals of Botany , 86 : 787 – 797 .
- Ming , R. H. and Shen , H. W. 1973 . Effect of tall vegetations on flow and sediment . Journal of Hydraulic Research ASCE , 127 ( 2 ) : 123 – 133 .
- Musik , H. B. , Trujillo , S. M. and Truman , C. R. 1996 . Wind-tunnel modelling of the influence of vegetation structure on saltation threshold . Earth Surface Processes and Landforms , 21 : 589 – 605 .
- Nakatsubo , T. 1997 . Colonization of invasive grasses in a river floodplain: its impact on the riparian plant community (in Japanese) . Japanese Journal of Conservation Ecology , 2 : 179 – 187 .
- Nakayama , K. , Fielding , C. R. and Alexander , J. 2002 . Variations in character and preservation potential of vegetation-induced obstacle marks in the variable discharge Burdekin River of north Queensland, Australia . Sedimentary Geology , 149 : 199 – 218 .
- Nepf , H. M. 1999 . Drag, turbulence, and diffusion in flow through emergent vegetation . Water Resource Research , 35 ( 2 ) : 479 – 489 .
- Parsons , D. A. 1963 . “ Vegetative control of streambank erosion ” . In Proceedings Federal Interagency Sedimentation Conference Miscellaneous Publication 970, Washington, DC: U.S. Department of Agriculture, 130–136
- Petryk , S. and Bosmajian , G. B. 1975 . Analysis of flow through vegetation . Journal of Hydraulics Division, ASCE , 101 ( 7 ) : 871 – 884 .
- Righetti , M. and Armanini , A. 2002 . Flow resistance in open channel flows with sparsely distributed bushes . Journal of Hydrology , 269 : 55 – 64 .
- River Bureau of the Ministry of Land, Infrastructure, Transport and Tourism, Japan . 2008 . National Censuses of River Environments , (in Japanese), 67. Available from: http://www3.river.go.jp/gaiyou.htm
- Samani , J. M.V. and Kouwen , N. 2002 . Stability and erosion in grassed channels . Journal of Hydraulic Engineering , 28 ( 1 ) : 40 – 45 .
- Sand-Jensen , K. 2003 . Drag and reconfiguration of freshwater macrophytes . Freshwater Biology , 48 : 271 – 283 .
- Shamloo , H. , Rajaratnam , N. and Katopodis , C. 2002 . Hydraulics of simple habitat structures . Journal of Hydraulic Research , 39 : 351 – 366 .
- Smith , R. J. , Hancock , N. H. and Ruffini , J. L. 1990 . Flood flow through tall vegetation . Agricultural Water Management , 19 : 317 – 332 .
- Sturm , T. W. 2001 . Open channel hydraulics , 132 – 133 . New York : McGraw-Hill Companies Inc .
- Takemura , T. and Tanaka , N. 2007 . Flow structures and drag characteristics of a colony-type emergent roughness model mounted on a flat plate in uniform flow . Fluid Dynamics Research , 39 : 694 – 710 .
- Tamai , N. , Asaeda , T. and Tanaka , N. 1987 . Vortex structures around a hemispheric hump . Boundary-Layer Meteorology , 39 : 301 – 314 .
- Tanaka , N. , Watanabe , H. and Shirono , Y. 2004 . Wind tunnel experiments on blown-sand phenomena around inclined porous cylinders . Proceedings of the 10th Asian Congress of Fluid Mechanics , (CD-ROM)
- Tanaka , N. , Yagisawa , J. and Ogawa , T. 2007 . Change of threshold velocity for gravel movement by runner expansion and growth of Phragmites japonica on a gravel bar: modeling approach . Journal of Hydroscience and Hydraulic Engineering , 25 ( 1 ) : 1 – 10 .
- Temple , D. M. 1980 . Tractive force design for vegetated channels . Transactions of ASAE , 23 ( 4 ) : 884 – 890 .
- USDA . 1947 . Soil conservation service handbook of channel design for soil and water conservation , Washington, DC : US Department of Agriculture . SCS-TP-61
- Wu , F. C. , Shen , H. W. and Chou , Y. J. 1999 . Variation of roughness coefficients for unsubmerged and submerged vegetation . Journal Hydraulic Engineering , 125 ( 9 ) : 934 – 942 .
- Yagisawa , J. and Tanaka , N. 2007 . Threshold of gravel movement in Eragrostis curvula vegetated zone and its removal condition by flood in relation to the plant's density and growth stage . Annals of the Journal of Hydraulic Engineering, JSCE , 51 : 1249 – 1254 . (in Japanese with English abstract)