
 ?Mathematical formulae have been encoded as MathML and are displayed in this HTML version using MathJax in order to improve their display. Uncheck the box to turn MathJax off. This feature requires Javascript. Click on a formula to zoom.
ABSTRACT
Flood risk quantification is a complex process involving a chain of models. The approach contains many uncertainties which accumulate in the calculated flood risk. Risk-based flood safety standards are therefore prone to large uncertainty. This study aims to quantify the uncertainty of risk-based flood safety standards for a Dutch riverine case study. Through a systematic approach using expert elicitation, the key uncertainty sources in the Dutch safety standard derivation are identified. Uncertainty magnitudes are quantified for five main sources of uncertainty, after which these uncertainties are propagated through the model chain in a scenario analysis to derive flood safety standards. The results show that the Dutch risk-based flood safety standards are highly uncertain given the relative uncertainty bandwidth of 70%. The flood safety standards are found to be most sensitive to damage function and evacuation uncertainty. Also, we show that the impact of uncertainty strongly depends on local characteristics.
1. Introduction
Flood protection is a key priority for many countries around the world where high concentrations of economic activity and residential areas exist in flood-prone areas. As a result, many countries define flood safety standards for the design and assessment of their flood defences. These flood safety standards are increasingly being derived in a risk-based manner. For example, in Europe, the European flood directive prescribes that all EU member states should conform to a risk-based approach in flood protection (European Parliament, Citation2007). Nowadays, many countries use a risk-based flood protection policy. France introduced a risk-based cost–benefit approach in 2011 (Saint-Geours et al., Citation2015), Germany already initiated a risk-based approach in the 1990s (Otto et al., Citation2018) and the Netherlands more recently switched to a risk-based approach in 2017 (ENW, Citation2017; Jorissen et al., Citation2016). Australia is an example of a non-European country following a risk-based approach in its flood protection and mitigation policy, with strategic flood protection and mitigation guidelines set-up by local governments (Dufty et al., Citation2020). This is for instance shown by the floodplain development manual, published by the New South Wales government and can be used as guideline for setting up risk-based flood management plans (NSW Department of Infrastructure, Planning and Natural Resources, Citation2005). These examples show that risk-based flood protection policies are becoming the norm in an increasing number of countries.
In flood risk policies, flood safety standards are derived to prescribe the maximum allowed probability of flooding of flood defences. These safety standards are derived using a set of models, including flood extent models, dike breach models and damage quantification models. The uncertainties in these coupled model systems affect the final safety levels derived and thereby the desired strength of the flood defences. This is for instance the case in the Netherlands, where the primary flood defence system is designed and tested based on risk-based safety standards (Jorissen et al., Citation2016). As a result, the embedded uncertainty in flood risk estimations affects investments in flood defence improvement projects and spending of public funds on these systems. Enhanced insight into how different uncertainty sources influence the standards can therefore provide possibilities to enhance the calculation process for risk-based flood safety standards. This could enable an optimization of the spending of public funds on flood defence systems.
In most flood risk uncertainty studies there has been a clear focus on uncertainty in economic flood risk (expressed in monetary terms). However, flood protection and mitigation policies in multiple countries are not solely based on economic risk assessments. Preventing loss of human life is also an important component of such policies. Examples of risk assessment methodologies based on human loss are found in the United Kingdom (Defra - Environment Agency, Citation2006) and in the Netherlands (ENW, Citation2017). In the Dutch approach, flood safety standards for the primary flood defence system are derived based on both an economic flood risk analysis and an analysis of the risk for loss of human life (ENW, Citation2017).
Various studies have investigated flood risk calculations and tried to identify and quantify the sensitivity and uncertainty of flood risk estimates. Flood risk is typically determined as the product of the occurrence probabilities of flood events and the consequences of flooding (Apel et al., Citation2004). Flood frequency uncertainty has been described in many case studies, for instance by considering uncertainty in design floods in the United Kingdom (Kjeldsen, Citation2015), the Netherlands (Diermanse, Citation2004) and Germany (Thieken et al., Citation2015). Uncertainties in factors influencing flood consequences have been studied as well, such as dike stability and flood propagation after a dike has breached. These factors have for instance been included by Domeneghetti et al. (Citation2013) for a case study of the Po River in Italy and Saint-Geours et al. (Citation2015) for case studies in France. Uncertainty in the valuation of intangible flood damage was studied by Bockarjova et al. (Citation2012) and damage function uncertainty for flood damage quantification is described by Jongman et al. (Citation2012). A recent study by Brussee et al. (Citation2021) investigated the influence of uncertainty in model resolution and the loss of life model on estimates of the risk for loss of human life. They showed that both uncertainty sources significantly impact the risk of loss of human life. Together, these studies show that many different uncertainty sources are relevant in the calculation of flood risks.
Several studies have tried to consider both flood probability and flood consequence uncertainty simultaneously to capture the uncertainty in the full range of the flood risk quantification process. In a case study for the Rhine river in Germany, Apel et al. (Citation2004) investigated amongst others the uncertainty in extreme river discharge statistics, flood routing, dike failure and damage estimation. Merz and Thieken (Citation2009) found a German case study that uncertainties associated with flood frequency determination explain most of the economic flood risk uncertainty. De Moel et al. (Citation2012, Citation2014) considered a Dutch case study and concluded that the uncertainty of damage functions, the return period of extreme hydraulic conditions and breach development are all important factors in the overall uncertainty of flood risk estimates. Gauderis et al. (Citation2011) performed a nationwide uncertainty analysis for the Dutch economic risk-based flood safety standards. They used a Monte-Carlo-based approach in which 14 uncertainty sources were parameterized and propagated via an analytical equation to approximate flood risks. They showed that the relative importance of uncertainty sources varies by study area. The uncertainty in flood extent, mortality quantification and quantification of investment costs for flood defence improvements were found to contribute significantly to the uncertainty of economic risk-based safety standards.
Flood risk quantification is typically a process based on a series of complex coupled models. Various studies have shown that flood risk quantification through these coupled model systems involves many different uncertainty sources and is highly sensitive to uncertainty (e.g. Apel et al., Citation2004; De Moel et al., Citation2012, Citation2014; Gauderis et al., Citation2011; Merz & Thieken, Citation2009). Furthermore, these studies show that the influence of uncertainty sources on flood risk estimates varies for different case studies.
Flood damage and flood risk uncertainty analysis studies mostly focus on a limited number of potential uncertainty sources due to the complexity of flood risk calculations. The associated uncertainty is often quantified and propagated through the flood risk calculation model chain (e.g. De Moel et al., Citation2012, Citation2014; Merz & Thieken, Citation2009; Saint-Geours et al., Citation2015). A shortcoming of selecting a limited number of uncertainties is neglecting many other (potentially relevant) uncertainty sources (Warmink et al., Citation2010). Also, studies using a Monte-Carlo-based approach (e.g. Gauderis et al., Citation2011; Saint-Geours et al., Citation2015) face the limitation of long run and processing times when a series of complex models is involved. Gauderis et al. (Citation2011) used analytical approximation equations to avoid long run times associated with Monte-Carlo-based approaches, to enable considering uncertainty in the full chain of coupled models in the flood risk calculation process. Saint-Geours et al. (Citation2015) were able to use a Monte-Carlo-based approach, as they excluded the time-consuming hydraulic model simulations due to their choice for the considered uncertainty sources.
In summary, flood risk quantification and the derivation of risk-based safety standards require a series of complex coupled models. Due to this complexity, uncertainty and sensitivity analysis studies either consider a limited number of uncertainties, or the model chain is parameterized. Furthermore, it becomes clear that there has been a strong focus on economic risk in these studies, while the risk for loss of human life is to various extents also included in the derivation of flood safety standards in for instance The Netherlands, Belgium, the Czech Republic and the United Kingdom (EUCOLD, Citation2018).
The objective of this study is to systematically quantify the uncertainty of risk-based flood safety standards for a case study in the Netherlands. The full range of uncertainty sources and types (as described by Warmink et al., Citation2010) was considered in our study. Furthermore, this study focuses both on economic risk and risk for loss of human life, as both are relevant in the derivation of flood safety standards. The quantified uncertainty sources were propagated directly through the models that have been used to derive the Dutch flood safety standards, thereby using the actual model chain instead of using analytical approximation equations. We performed a scenario-based uncertainty analysis to quantify the impact of individual uncertainty sources and associated area characteristics on flood safety standards and prioritize the influence of uncertainty sources.
This paper is organized as follows. Firstly, the case study is introduced (Section 2). In Section 3, the chain of models used in the Netherlands for the derivation of flood safety standards is briefly described. Section 4 elaborates on the methodology followed in this study to identify, quantify and propagate the sources of uncertainty. In Section 5, the results are presented with finally the uncertainty of the flood safety standards for the case study. Section 6 presents the discussion and in Section 7 the conclusions of the study are drawn.
2. Case study
The case study area is located in the middle of the Dutch Rhine-Meuse delta and consists of a dike ring encircling an area between several branches of the River Rhine (), referred to as dike ring 43. The area spans approximately 70 km from east to west and between 3 and 15 km north to south, which makes it one of the larger Dutch dike rings. Flood hazards for this area are dominated by high river discharges of the River Rhine. The area is enclosed by dikes along three branches of the River Rhine, except for the western border, where a segmentation levee separates it from the areas west of dike ring 43. Elevations in the area range from 1 m above mean sea level in the west to 11 m above mean sea level at the eastern end. The land use of dike ring 43 is characterized by a mix of urban and agricultural areas. The area is home to approximately 360,000 inhabitants, spread over several cities and villages, with agricultural lands in between. Additionally, the local river Linge flows east to west through the interior of dike ring 43 and is split in two by the Amsterdam-Rhine canal. Both of these waterways are enclosed by regional dikes, which are not part of dike ring 43 and are not included in the safety standard calculation. These waterways do however affect inundation patterns in dike ring 43 and are therefore important to consider.
Figure 1. Land use map of the case study area, in which the 6 separate dike segments (43-1 to 43-6) are highlighted. The breach locations considered in the flood simulations are shown as stars.
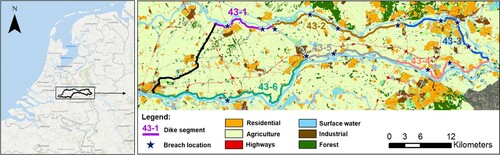
The approximately 200 km of primary flood defences in the study area are dominated by river dikes, interspersed by several major hydraulic structures such as two shipping lock-systems at the Amsterdam-Rhine canal. Dike ring 43 is under the Dutch Water Act divided into six separate dike segments (shown in ), each with a separate flood safety standard (Slootjes & Wagenaar, Citation2016). The Dutch flood safety standards are defined as maximum annual flood probability, rounded to a 1-3-10 system (e.g. 1/1,000, 1/3,000, 1/10,000). A 1/1,000 safety standard expresses that the annual probability of failure anywhere along the considered dike segment may not exceed 1/1,000. The standards for dike ring 43 are among the strictest found in the Netherlands with an annual failure probability of 1/3,000 for segment 43-2 and 1/10,000 for the other five segments (Slootjes & Wagenaar, Citation2016). Within the Dutch flood protection policy, a flood defence segment is considered as failed when the load caused by the water exceeds the strength of the defences. As flood defences can fail due to multiple different so-called ‘failure mechanisms’ (e.g. wave overtopping, dike instability etc.), the total flood probability is calculated based on a combination of separate failure probabilities in a series of probabillistic tests. For an explanation of this procedure, please refer to (VNK2 Project office, Citation2012).
3. The Dutch flood safety standard derivation process
The Dutch flood safety standards are based on the quantification of flood risks. The normative standard is defined by the strictest standard following two risk-based criteria (Slootjes & Van der Most, Citation2016):
The individual risk (IR): this criterion considers the risk for loss of human life, expressed as the annual probability for individual residents of flood-prone areas to become a casualty in a flood event;
The economic risk (ER): this criterion expresses the annually expected monetary losses due to flooding, in which both tangible and intangible value is incorporated.
These two risk criteria have been calculated for each of the 208 Dutch primary dike segments, after which an accompanying flood safety standard was set which suits the locally encountered flood risks.
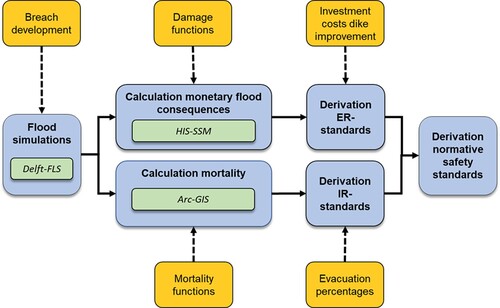
The procedure to derive flood safety standards in the Netherlands based on these two criteria consists of a number of consecutive steps, in which various models are involved. The procedure as used in this study is schematized in , which was also used for the safety standards of dike ring 43 as currently tied in the Dutch Water Act. This section provides an overview of the basic framework and highlights the most relevant steps in detail, as followed in this study. Additional background information about the full process can be found in ENW (Citation2017) and Slootjes and Van der Most (Citation2016). The procedure was followed in this study to verify the standards in the Dutch Water Act, to assure a proper reference situation for the uncertainty analyses of safety standards.
Figure 2. Schematization of the main steps in the flood safety standard derivation process, along with the involved model environments used. The uncertainty sources incorporated in the uncertainty analysis are shown with the dashed impact lines, directed towards the component in the safety standard derivation methodology which is impacted by these uncertainty sources.
3.1. Flood simulations
The first step in the process consists of a set of flood simulations to determine which inundation conditions (flow velocities, inundation depths and rise rates) would occur in case of a dike breach along dike ring 43. These conditions are quantified using flood simulations made with a Delft-FLS model, which uses 100 m × 100 m grid cells. Delft-FLS is a 2D numerical model based on a finite difference scheme in a staggered rectangular grid (Hesselink et al., Citation2003). We used the Delft-FLS model for the Dutch river delta, originally developed by the province of Gelderland and made available for this study by the Dutch water authority Rivierenland. Delft-FLS models require surface elevation data and roughness data as input, discharge-time relationships as upstream boundary condition and discharge-water level relationships as downstream boundary condition (Hesselink et al., Citation2003).
The used elevation data is based on laser altimetry data from the Dutch AHN1-dataset, for which the data was sampled between 1997 and 2004 (PDOK, Kadaster, Citation2004). The roughness data used in this study originates from the Dutch LGN5 dataset (Hazeu, Citation2005). River inflow boundary conditions originate from the Dutch hydraulic boundary conditions in 2006 (Berger, Citation2008; Ministerie van Verkeer en Waterstaat, Citation2007). We used the two prescribed Rhine discharge scenarios corresponding to exceedance probabilities of 1/1,250 per year and 1/12,500 per year, to account for the range of conditions for which a breach could occur.
The model uses predefined breach characteristics (location, moment of breach initiation, development of breach width and depth) as input. Breach locations along each of the dike segments were implemented as defined earlier by the Dutch VNK2 flood risk project (VNK2 Project office, Citation2012). For each dike segment, between two and four different breach locations were considered (). These account for the range of possible breach locations along each segment, resulting in different inundation patterns. Breach development was simulated based on a simplified version of the Verheij-Van der Knaap breach growth equation (Verheij, Citation2003):
(1)
(1) where B(t) is the breach width at time t after the breach starts to grow (m), g is the gravitational acceleration constant (9.81 m/s2), uc is the critical flow velocity for the erosion of the dike material (m/s) and H is the time-averaged head difference over the breach during the breach development phase (m).
The equation is valid for dikes with sandy and clayey compositions (for a further explanation see Verheij, Citation2003). For the verification run, we used a default breach growth curve by following the original safety standard derivation, which results in an approximately 200 m wide breach after 72 h. This curve is based on a time-averaged head difference H = 2.8 m and erosion parameter Uc = 0.2 m/s, corresponding to a homogeneous sandy dike composition.
With this model, in total 30 flood scenarios were simulated, each being combination of one of the 15 unique breach locations (shown in ) and one of the two different hydraulic boundary conditions. The model calculates flood characteristics (inundation depths, flow velocities and rise rates) for each grid cell for each flood scenario. These flood characteristics are used as input for the flood consequence quantification.
3.2. Flood consequence quantification
The IR safety standards are derived based on casualty risk, which is quantified based on mortality functions. We used mortality functions as defined by Jonkman (Citation2007) and complemented by Maaskant et al. (Citation2009). These functions have been derived based on empirical analysis of data from historical flood events in the Netherlands, the UK and Japan in the 1950s (Jonkman, Citation2007). The functions relate the inundation depths and rise rates to mortality (the probability to pass away under these conditions). Increased rise rates or inundation depths result in higher mortality values. Eventually, for each flood scenario, the grid-based mortality was calculated based on the mortality functions and aggregated over the area to yield the mortality for each flood scenario. The calculations were made within an Arc-GIS environment through raster operations for the flood characteristic maps gathered from the flood simulations.
The ER-safety standards are based on monetary flood consequences. These consist of both direct and indirect flood damage to assets and the economy, as well as monetized personal damage. Monetization values for personal flood damage, such as casualties and injuries, were defined in earlier studies by Bockarjova et al. (Citation2009; Citation2012). The direct and indirect damage to assets and the economy were quantified through the ‘HIS-Damage and Victims Module’ (HIS-SSM) simulation programme, which is a software package developed to determine flood consequences from GIS-based inundation characteristics (see Huizinga et al., Citation2004). The programme uses damage functions for 11 different land use and asset categories, as defined by Kok et al. (Citation2005). These functions define a relation between inundation depths and the relative value lost due to floods (Wagenaar et al., Citation2016). The functions were derived earlier based on a combination of expert estimates and flood damage data from two historical floods in the Netherlands in 1945 and 1953 (Wagenaar et al., Citation2016).
3.3. Flood safety standard derivation
The IR standards are derived for each dike segment. The derived grid-based mortality for each breach scenario considered along the breach segment is weighted proportionally to its individual probability of occurrence. This probability is defined by the length of the dike section for which the breach scenario is representative. The weighing procedure is described in detail by Slootjes and Van der Most (Citation2016). The resulting aggregated mortality map therefore represents the probability to become a flood casualty from any possible flood along a dike segment. Afterwards, the grid-based mortality values were aggregated to neighbourhoods defined by the Dutch statistics bureau (CBS & Kadaster, Citation2019). The sizes of these neighbourhoods vary between 0.2 and 20 km2. The median grid-based mortality within a neighbourhood was set as representative mortality for the entire neighbourhood.
Evacuation is considered as a reduction factor for the probability of residents being present within each neighbourhood. Therefore, the calculated individual risk values are corrected for evacuation in the derivation of IR standards. The IR standards are set for each dike segment based on the neighbourhood with the highest median mortality value (Beckers & De Bruijn, Citation2011):
(2)
(2) where PIR is the IR flood safety standard expressed as annual flood probability (y−1), IRmax (yr−1) is the legally-tied maximum allowed individual risk value expressed as annual probability to become a casualty in a flood event, which is 1*10−5 for the Netherlands (Slootjes & Van der Most, Citation2016). M [1/flood event] is the weighted median mortality value in the normative neighbourhood and E = Evacuation fraction [-] = 0.56 for dike ring 43, based on expert-judgement described in Slootjes and Van der Most (Citation2016). Lastly, c is a correction factor to account for the fact that areas may be prone to inundation from multiple dike segments and consequentially a higher individual risk. The correction factor assures that the total individual risk does not surpass the maximum value. The factor is therefore calculated based on the mortality in the normative neighbourhood originating from multiple dike segments.
The ER standards are derived based on a cost optimum between reduced flood consequences and the required investment costs to achieve this reduction, based on the existing situation. For each dike segment, the calculated monetary flood consequences for each flood scenario are combined, as described by Slootjes and Van der Most (Citation2016). The derived monetary flood damage is balanced with the investment cost estimates calculated earlier for the Dutch flood protection programme following De Grave & Baarse (Citation2011). Costs and benefits of flood probability reduction were balanced according to an approximation equation used by Slootjes and Van der Most (Citation2016), to determine the economically optimal flood protection level:
(3)
(3) where PER stands for the ER-flood safety standard expressed as annual flood probability (y−1), I stands for the investment costs for dike improvement (€) and Dw,2050 is the weighted total damage, projected towards 2050. The weighted total damage is the result of a balance between the damage from the individual breach scenarios, based on the length of the dike sections for which a breach scenario is a representative. The factor 1/19 originates from the assumed annual 5% discount rate (see De Grave & Baarse, 2011).
4. Uncertainty analysis framework
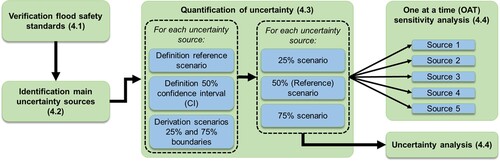
The uncertainty analysis framework followed in this study is graphically shown in . Firstly, a verification run was carried out, based on the methodological framework described in chapter 3. Secondly, we identified the main uncertainty sources in the safety standard calculation process via an expert elicitation approach. Thirdly, the uncertainty for these sources was quantified systematically, by defining a 50% uncertainty bandwidth for each of these sources which was translated to three distinct scenarios to represent the uncertainty (the 25%, 50% and 75% scenario). Finally, the uncertainty was propagated through the model chain to yield the safety standard uncertainty. This was done through a one-at-a-time (OAT) sensitivity analysis first, to identify in which way the individual uncertainty sources affect the resulting safety standards. Afterwards, the uncertainty scenarios of the considered sources were combined and propagated through the calculation process, to derive the total safety standard uncertainty and identify which uncertainty sources contribute most to the total uncertainty. In this approach, we considered a limited number of scenario and model runs. The complexity and manually demanding nature of the Dutch flood safety standard derivation process make the execution of many simulation runs unfeasible, as was encountered earlier by Gauderis et al. (Citation2011). The approach using a limited number of simulations is often used for such large and extensive models as a screening technique (Campolongo et al., Citation2011).
Figure 3. Schematic overview of the main research steps in this study and the sequence in which they are carried out, along with the accompanying paragraphs in which the step is further described.
4.1. Verification of the Dutch flood safety standards
The framework used to derive flood safety standards described in chapter 3 was applied to dike ring 43 to verify if the calculated safety standards match the current standards defined for dike ring 43, aimed to verify the model chain. The ER standards derived for the six dike segments of dike ring 43 were found to correspond closely to the standards derived by Slootjes and Wagenaar (Citation2016), whose calculations were the base for the legal standards. Deviations of less than 1% were found for all dike segments. The IR standards could however not be accurately reproduced in this study, as between 6% and 40% stricter standards were found. An explanation for these differences is most likely found in the aggregation of the grid-based mortality to neighbourhoods and the choice for a normative neighbourhood. This can be explained by the complexity and the sometimes insufficient detailed documentation of the process. An exact reason for the deviations could not be found in this study. However, these deviations do not affect the aim of this study, as long as the same flood safety standard derivation process is used for all simulations carried out in the uncertainty analysis ().
Table 1. Verification IR and ER standards found in this study compared to the legal standards defined by Slootjes and Wagenaar (Citation2016). Note that these values have not been aggregated yet into classes, hence do not correspond with the legal standards (those are the rounded values derived from the values by Slootjes and Wagenaar (Citation2016)).
4.2. Identification of main uncertainty sources
To identify the main sources of uncertainty which affect the flood safety standards of dike ring 43, a systematic expert elicitation approach was followed. Six experts were selected for the expert elicitation procedure, based on their combined acquaintance with the safety standard derivation process, its application and the interpretation of the derived standards. These six experts were all involved in either the development of the flood safety standard derivation process (4 experts) or the application of the Dutch flood safety standards (2 experts). The experts are employed at governmental organizations (1 expert), knowledge institutes (2 experts) and private engineering companies (3 experts). A total of six experts are considered sufficient to give a reliable estimate of expert opinions, in accordance with (Van der Sluijs et al., Citation2004).
The face-to-face interview sessions with these experts were set-up in a structured way, by providing each expert with a list of 34 predefined uncertainty sources in the flood risk quantification and safety standard derivation process. Warmink et al. (Citation2010) state that it is useful to provide a structured overview in which all types of uncertainty are incorporated, as uncertainty analysis studies often only consider easily quantifiable uncertainties. The list of predefined uncertainty sources was derived based on reviewing available documentation of the safety standard calculation process (amongst others Slootjes and Van der Most (Citation2016); Gauderis and Kind (Citation2011); Vergouwe et al. (Citation2014) and De Bruijn and Van der Doef (Citation2011)) and the verification run carried out in this study. For each of the uncertainty sources, the experts were asked to express their influence on flood safety standards by means of a quantitative score on a five-point scale. In their score, experts were asked to incorporate both the uncertainty range as well as the expected influence on the flood safety standards for dike ring 43. After the six experts defined a score for each of the predefined uncertainty sources, the expert scores were averaged, to generate a ranking of the uncertainty sources, giving each expert an equal weight. Some experts did not use the minimum and maximum scores in the expert elicitation. As the purpose of the expert elicitation was limited to gathering an uncertainty ranking and not to receive a quantified uncertainty estimate, the results were rescaled to a five-point scale. The rescaling did not affect the expert’s relative judgements. After rescaling, an average score was calculated for each uncertainty source and the five highest ranked uncertainties were selected for uncertainty quantification in this study.
4.3. Uncertainty quantification and propagation framework
The five uncertainty sources selected from the expert elicitation are shown in . Two of these five uncertainty sources influence (predominantly) the IR standards, two influence the ER standards and one impacts both IR and ER standards (). shows schematically which of the steps in the safety standard calculation process are directly affected by these uncertainty sources. The mortality functions and evacuation percentages influence the ER-standard calculation as well, but to a far lesser extent. The casualty-related monetary damage only accounts for approximately 10% of the total monetary damage for the scenarios of dike ring 43 (as observed during the verification run). Within this study, the uncertainty in these two components was therefore only considered for the IR standards.
Table 2. Uncertainty sources included in this study, along with an indication for which of the risk-based criteria the uncertainties are considered.
For each uncertainty source, first, the 50% scenario was defined based on literature and available data. Both data analysis and expert opinions showed that some of the assumptions in the verification run were not realistic. The verification scenario was therefore adapted to derive the 50% scenario, in case literature insights or available data provided a solid base for the definition of a more realistic scenario compared to the verification scenario. The results of the flood safety standard calculations based on this 50% scenario, therefore, differed from the verification run, but it enabled a more accurate quantification of the uncertainties which was the purpose of this study.
Uncertainty sources were quantified through literature study such that a 50% confidence interval (CI) around the 50% scenario was defined. As upper and lower limits of the 50% CI, two scenarios were defined: a 25% and a 75% scenario. These 25%, 50% and 75% scenarios were used to propagate uncertainty through the safety standard derivation process to show the influence of uncertainty sources on the overall uncertainty of the flood safety standards. Through this systematic approach, the influence of the five uncertainty sources can be compared in a structured way, as the input uncertainty ranges correspond to the same confidence interval.
4.3.1. Breach development
As introduced in paragraph 3, breach development is included in the flood simulations through the Verheij-Van der Knaap equation (Verheij, Citation2003). Breach growth is highly influenced by the composition of the dike through the varying cohesive characteristics of dike core material, as was described in earlier studies (e.g. Zhu, Citation2006). Dike composition is included in the Verheij-Van der Knaap equation via soil parameter Uc, which expresses the erodibility of dike material. The verification scenario in this study assumed a fully sandy dike (Uc = 0.2m/s), regardless of dike segment or breach location.
Breach growth uncertainty was considered for dike segment 43-6 and was quantified through soil parameter Uc, by considering dike composition data for dike segment 43-6 (see ). Two separate data sources were used for the uncertainty quantification of dike material: dike designs originating from the most recent dike reconstruction work in the area in the 1990s (Waterschap Rivierenland, Citation2014) and data from core drill samples of the dike interior at nine locations spread over dike segment 43-6, available at the Dutch soil and underground information platform (Dinoloket; TNO, Citation2019). For both data sources, estimations were made of the sand/clay ratio of the dike interior. This ratio was used to quantify the uncertainty of Uc through typical Uc-values for clayey and sandy material and by translation of the found sand/clay ratios into average values for Uc. In accordance with Verheij (Citation2003), a typical critical flow velocity of 0.2 m/s for sandy dike material and 0.5 m/s for clayey dike material was assumed. shows the minimum, maximum and most commonly found sand/ clay ratios in the area.
Table 3. Triangular distibution for erodibility parameter Uc based on the minimum, maximum and most commonly found sand /clay ratios for flood dike segment 43-6 according to Verheij (Citation2003).
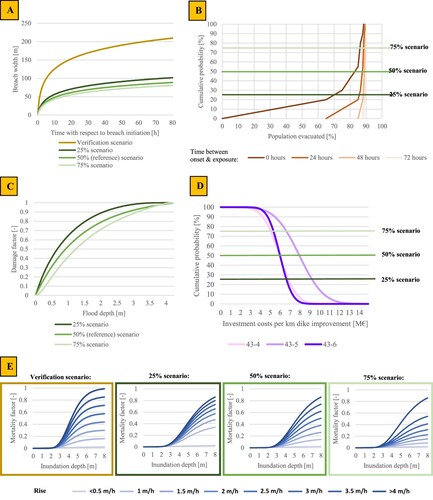
The variability of the found characteristic sand/ clay ratios was statistically described through a triangular distribution, based on the absolute minimum, maximum and most commonly found ratio for the area. The fitted triangular distribution for Uc was used to define the three uncertainty scenarios for breach growth by the use of the Verheij-Van der Knaap equation ((A)).
Figure 4. Overview of all uncertainty quantification scenarios derived in this study, along with the verification scenario for each uncertainty source. (A) breach growth, (B) Evacuation, (C) Example of one of the damage functions for landuse type 'low residential buildings', (D) Investment costs for flood defence improvement, (E) Mortality functions. In case the verification scenario equals the 50% (reference) scenario, no seperate verification scenario is shown (this is the case for the damage function and investment cost).
4.3.2. Mortality functions
Flood mortality was quantified in the verification run through the set of mortality functions defined by Jonkman (Citation2007) and complemented by Maaskant et al. (Citation2009). The functions are applicable for different circumstances (inundation depths, rise rates and flow velocities). We analysed mortality maps from the verification runs, showing that flood circumstances observed in the normative areas of dike ring 43 for most flood scenarios correspond to a specific range in which mortality is calculated based on a linear interpolation function between functions for high (4 m/h) and low (0.5 m/h) rise rates. Uncertainty scenarios for this interpolation function were therefore derived.
Based on an earlier study by Asselman (Citation2005), Jonkman (Citation2007) showed that the mortality function for high rise rates, which was defined based on data from the 1950s, can be corrected for improved building quality since the 1950s. As many casualties are related to flood-induced building collapse (Jonkman, Citation2007), improved building quality impacts flood mortality. The verification scenario for the high rise rate mortality function was therefore adapted, to derive the 50% scenario, by correcting for improved building quality based on the correction factor described by Jonkman (Citation2007).
The interpolation mortality function is highly uncertain (Maaskant et al., Citation2009). Data for quantification of the mortality function uncertainty is scarce. The concept by Maaskant et al. (Citation2009) to interpolate linearly between the high and low rise rate functions defined by Jonkman (Citation2007) is intuitively realistic, as it is unlikely that slight changes in flood circumstances would cause abrupt changes in mortality rates. The default linear interpolation scenario was therefore used as a 50% scenario. The 25% and 75% scenarios were defined at an equal distance from the 50% scenario. As any interpolation between 0.5 and 4 m/h is theoretically possible, a symmetrical confidence interval around the 50% scenario was chosen. The alternative functions both start and end at the same location, as it is unrealistic that mortality would change abruptly for slight changes in flood rise rate. The 25%, 50% and 75% scenarios used in this study for the mortality function uncertainty are shown in (E).
4.3.3. Evacuation percentages
In the verification run, a uniform 56% preventive evacuation percentage was included in the individual flood risk calculations. Preventive evacuation is described as the organization and horizontal movement of people from a potentially exposed area to a safe location outside this area, that begins before the onset of the disaster (Kolen, Citation2013). Many different aspects can be identified which affect the uncertainty of evacuation percentages, amongst others the lead time before a flood defence is expected to fail. This key aspect influences the available evacuation time, impacting authorities’ decision making and evacuation orders (Kolen, Citation2013).
To quantify the uncertainty of evacuation percentages due to available evacuation time uncertainty, a probability distribution of the number of available days for preventive evacuation from Maaskant et al. (Citation2009) was used. This probability distribution was based on expert estimates specifically for the upper reaches of the Dutch river network (Slootjes & Van der Most, Citation2016), which also includes our study area. For the three scenarios, the day-based estimates were translated into a continuous hour-based distribution over the interval between zero and five days, to enable defining a 50% CI of the time availability. The assumption was therefore made that the day-based probability estimates can be distributed linearly over the interval between 12 h before and after the considered day. The time-availability distribution was translated into a preventive evacuation percentage probability distribution through evacuation model-estimates described by Kolen (Citation2013).
Additionally, earlier research by Mevissen (Citation2010) showed that the time between onset (dike breach) and individual exposure to a flood can provide significant additional evacuation time on top of the preventive evacuation time. This additional component is often referred to as acute evacuation time (Kolen, Citation2013). This aspect was mentioned by various experts consulted in the expert elicitation in this study as well. Particularly in dike ring 43, the effect of acute evacuation could be significant, as the time between dike failure and individual flood exposure highly varies throughout the flood zone due to the elongated shape of the exposed area (). Flow velocities are generally low and the area is characterized by a number of elevated elements spread across the landscape, such as small dikes and elevated highways which halt progression of the inundation front temporarily. These characteristics cause some areas to become inundated days after the flood onset. As incorporation of acute evacuation leads to a more realistic representation of the evacuation process, this aspect was incorporated in the derivation of uncertainty scenarios for evacuation in this study. We calculated the location-specific acute evacuation time available based on flood arrival times derived from the flood simulations. A similar approach was followed recently by Brussee et al. (Citation2021) to model evacuation fractions for a dike ring with similar characteristics and highly variable flood arrival times. The acute evacuation time was added to the uncertain preventive evacuation time as a deterministic factor for the 25%, 50% and 75% scenarios. The total evacuation time (preventive + acute) was then translated into an evacuation percentage through the time-evacuation relationship defined by Kolen (Citation2013). With this approach, location-specific evacuation percentages were derived, depending on flood arrival time. (B) shows the derived probability distribution for population evacuated for four different evacuation times, as well as the verification scenario.
4.3.4. Damage functions
The verification scenario includes 11 damage functions for different landuse types described by Kok et al. (Citation2005). The uncertainty associated with these damage functions was quantified based on an approach introduced by Egorova et al. (Citation2008). Through this approach, the uncertainty of damage functions was described through beta distributions. The shape of the beta distribution depends on the inundation depth and a factor denoting the magnitude of uncertainty for the damage caused at the specific depth (this factor is referred to as ‘k’ in Egorova et al. (Citation2008)). In accordance with De Moel et al. (Citation2012, Citation2014) a k-factor of 0.1 was used in this study to describe the uncertainty around each damage function. As the study area of De Moel et al. (Citation2012) has similar geographic and construction characteristics as dike ring 43, the same k-value was assumed representative for the uncertainty of damage estimates.
For 9 of the 11 damage functions, beta distributions were derived directly for the damage functions by Kok et al. (Citation2005), as used in the verification run in this study. For 9 damage functions, the verification scenario and 50% scenario are therefore the same. For the remaining exposure categories ‘industry’ and ‘vehicles’, the verification scenario was corrected for proven errors in the 50% scenario, based on an earlier study by De Bruijn et al. (2015). The derived beta distributions were used to define the 25% and 75% scenario damage functions. (C) presents an example for one of the 11 functions.
4.3.5. Flood defence improvement costs
The uncertainty of investment costs for flood defence improvement was quantified based on uncertainty estimates in recently made cost estimates for ongoing dike improvement projects within dike ring 43. Data were available for three dike segments (43-4, 43-5 and 43-6). The investment costs included in the verification run were used as a 50% scenario. The uncertainty estimates made for the three flood defence improvement projects provide coefficients of variation. These coefficients were used to express a 50% CI, based on a normal distribution. The 25% and 75% scenarios for the investment costs per km were set respectively at 6.9 and 5.1 M€/km for segment 43-4, at 9.3 and 6.7 M€/km for segment 43-5 and 6.7 and 5.4 M€/km for segment 43-6 (see (D)).
4.4. Uncertainty propagation
The scenarios for the five uncertainty sources () were all fully propagated through the flood safety standard derivation process as explained in chapter 3. The uncertainty analysis was divided into two parts: In the first part, we performed an OAT analysis by propagating the defined scenarios individually, to study the influence of individual uncertainty sources on flood safety standards and identify area characteristics affecting the influence. In the second part, we considered the uncertainty sources combined to find an uncertainty range of the IR and ER standards for dike segment 43-6 (for this dike segment each of the five uncertainty sources could be quantified). In a similar approach as Merz and Thieken (Citation2009), the scenarios for the uncertainty sources were combined into 54 unique scenario combinations for both the IR standards (27 scenarios) and the ER standards (27 scenarios), which were all propagated through the safety standard calculation process.
5. Results
5.1. Identification of primary uncertainty sources
The expert elicitation results show that experts mainly consider uncertainty sources impacting flood consequence quantification as most prominent (). Out of the top five uncertainty sources, three influence flood consequences (ID 1,3 and 4), one influences flood simulations (ID 2) and one influences the cost-quantification of the economic cost–benefit analysis (ID 5). Experts argued that these aspects both contain a high degree of uncertainty while also significantly influencing flood safety standards. Uncertainty sources which received a relatively low average score are often related to the quantification of flood probability through the flood simulations (IDs 2, 9, 12, 13, 15-18, 20, 23, 24, 29, 31, 32), as well as technical uncertainties within the models such as the used timestep (ID 33) and grid size of the flood simulation model (ID 27).
Table 4. Overview of the ranked uncertainty sources from the expert elicitation process, along with the average scores, standard deviation and number of times a score was given by the experts.
The number of respondents for individual uncertainty sources indicates that hardly any of the consulted experts is acquainted with all aspects of both the flood risk quantification and safety standard derivation process. One expert explained that the complexity of the calculation process has resulted in a highly fragmented knowledge over different experts. Most experts have in-depth knowledge of some specific components within the process and very few people oversee all principles and approaches in each step of the process. The uncertainty sources ranked highest in the overall results were considered important by most individual experts. However, there was no consensus on which source is most important.
5.2. OAT sensitivity analysis results
5.2.1. Breach development
(A) shows the influence of breach development uncertainty on the resulting IR and ER flood safety standards for segment 43-6. Firstly, it becomes clear that both IR and ER standards for all three scenarios are less strict compared to the verification scenario. This is explained by the significantly slower breach development in these scenarios. Consequently, inundation depths, as well as mortality, were strongly reduced, resulting in less strict ER and IR standards.
Figure 5. Influence of scenarios per uncertainty source on the flood safety standards for the individual dike segments. (A) Breach development; (B) Mortality functions; (C) Evacuation; (D) Damage functions; (E) Flood defence investment costs. Note: A shows the influence for both IR and ER standards, B and C show the influence on IR standards and D and E show the influence on ER standards.
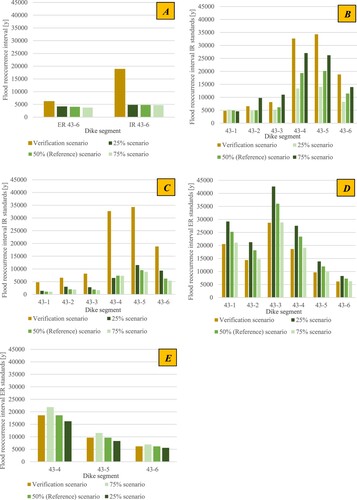
Focussing on the 50% CI, we found that both ER and IR standards are only slightly influenced by breach development uncertainty ((A)). The relative width of the 50% CI is 12% of the 50% scenario for the ER and only 2.6% for the IR standard. This is mainly explained by the fact that the 50% CI of the breach growth curve, given by the Verheij-Van der Knaap equation ((A)), is relatively small for the clayey dike compositions predominantly found along dike segment 43-6. Erosion resistance of clayey material is high, and as indicated by the Verheij-Van der Knaap equation, the relative influence of erodibility for clay-dominated dikes on the breach growth curve is small, while it is much larger for sand-dominated dikes. The high erodibility in the verification scenario is supposed to represent all dikes along dike ring 43. This assumption results in a significantly stronger breach growth and consequently a much stricter flood safety standard. This observation shows that considering location-specific information on dike composition is important and can signficantly influence the required flood safety standards.
A second explanation for the small influence on ER standards was found from the flood simulation results. It became clear that maximum flood depths are relatively constant due to an emergency spill flow structure, which can release flood water from the inundated area once outside river water levels have dropped below the level in the flood zone. As a result, the rise in flood depths is halted once the threshold for spill flow has been met. Therefore, regardless of breach development rates and resulting inflow volumes, maximum flood depths are relatively constant and consequently the ER standards are only slightly impacted by breach development uncertainty. Also, it became clear that inland elevation patterns such as the presence of regional dikes or elevated highways (see ) strongly impact flood characteristics, especially the rise rates which mainly determine the mortality. This explains why IR standards are not affected by the scenarios. While mortality was strongly impacted in the neighbourhood that was normative in the verification scenario (located close to the breach zone and enclosed by dikes), this was not the case for the three scenarios considered in the uncertainty analysis. For these scenarios, the normative neighbourhood is situated far from the breach zone and experiencing slow rise rates due to the absence of elevation differences. The IR standards were therefore not influenced by breach development uncertainty ((A)). This observation shows the importance of considering elevation patterns in detail and carefully select a representative breach location.
5.2.2. Mortality functions
The impact of mortality function uncertainty on the IR standards is shown in (B). Notable is the large variety of the 50% CI of the IR standards for the different dike segments. This variety is mainly explained by the inundation characteristics observed for the flood scenarios along the different dike segments. For the breach scenarios along the northern side of dike ring 43 (43-1, 43-2, 43-3), rise rates are relatively low in the flood zone. Therefore, mortality values are derived from the function for low rise rates. As we defined mortality function uncertainty through the interpolation strategy between high and low rise rate functions, the defined scenarios have a small impact on the flood safety standards along the northern dike segments. Rise rates for breach scenarios along the southern dike segments (43-4, 43-5, 43-6) are higher. As a result, the uncertainty in the mortality interpolation strategy has a strong impact on these segments ((B)). Mortality uncertainty is therefore especially important in situations where floods are characterized by higher rise rates.
5.2.3. Evacuation
(C) shows the influence of evacuation uncertainty on the IR safety standards. Notable is the strong difference between the verification scenario and the 50% scenario. The evacuation percentages derived in the three uncertainty scenarios are significantly higher than the verification scenario (). Especially for dike segments where flooding of the normative neighbourhood occurs a long time after breach initiation the difference is large (this is the case for segments 43-1, 43-3 and 43-4). For breach locations along these dike segments, the available evacuation time in areas situated far from the breach location is very high due to the availability of acute evacuation time. shows an example for dike segment 43-1, in which the time between onset and exposure exceeds two days for large areas. As the normative neighbourhood in the verification scenario is situated in this area (flood exposure after 69 h), the inclusion of acute evacuation time in the definition of the uncertainty scenarios results in much higher evacuation percentages in this area. Hence, the normative neighbourhood moves closer to the breach location in the established scenarios. This shows the importance of evacuation uncertainty on flood safety standards.
Figure 6. Flood arrival times after breach initiation, for safety standard segment 43–1 (highlighted in purple, breach locations are indicated as black stars). The neighbourhoods are shown by the light gray lines. The flood arrival times in the IR-normative neighbourhoods for the verification scenario (brown box) and the 50% confidence interval evacuation scenarios (green boxes) are shown as well. (dark green = 25% scenario, middle green = 50% scenario, light green = 75% scenario).
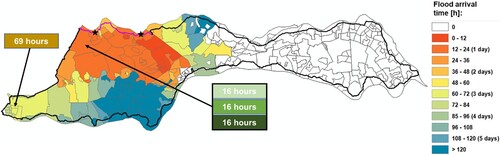
The size of the 50% CI of IR standards differs over the six dike segments. The relative size varies between 11% and 64% of the safety standard resulting from the 50% scenario. This difference is explained by the interaction between preventive and acute evacuation time over the flood zone. The impact of preventive evacuation time uncertainty is very small if the time between onset and exposure is high, due to the availability of acute evacuation time. This explains why the influence of preventive evacuation time uncertainty is relatively large for segments 43-2 and 43-6, where flood water arrives almost instantly after breach initiation. Segments 43-1 and 43-4 are recognized by relatively long flood arrival times explaining the reduced influence of evacuation uncertainty. These observations show that local characteristics affecting flood arrival time strongly influence the importance of evacuation uncertainty.
5.2.4. Damage functions
The influence of damage function uncertainty on ER standards is shown in (D). As a result of the difference between the verification scenario and the 50% scenario, damage is approximately 20% higher for all dike segments in the 50% scenario. The 50% CI is approximately 30–40% of the 50% scenario safety standard. Compared to the other uncertainty sources, the CI from damage function uncertainty is relatively large. The CI is relatively constant over the six dike segments. Small variations between dike segments are caused by local differences in land use in the flood zone. Also, the small share of monetized personal damage in the total damage slightly varies over the dike segments, providing a second explanation for the observed small variations in CI over the six dike segments.
5.2.5. Investment costs for dike improvement
The investment costs directly and linearly influence the ER flood safety standards, as indicated by the ER standard calculation equation (Equation (3)). The relative width of the 50% CI of the safety standards is therefore similar to the width of the 50% CI of the investment costs: between 22% and 33%. Opposite to the other four uncertainty sources, the 75% scenario results in stricter safety standards, as reduced investment costs yield stricter optimal flood safety standards from a cost–benefit perspective.
Out of the three segments for which the CI was quantified, the uncertainty in flood defence investment costs results in the largest relative safety standard CI for dike segment 43-5. The explanation for the varying relative uncertainty over the three dike segments is found in varying investment cost uncertainty over these segments. This is amongst others caused by different improvement strategies demanded by local characteristics, with associated varying investment cost uncertainty. At one location more straightforward solutions are viable, with lower associated uncertainty, while for another dike segment, the uncertainty is higher as more complicated solutions are required. In comparison to the CI for damage function uncertainty, the influence of investment cost uncertainty on the ER standards is smaller.
5.3. Uncertainty analysis results
The IR and ER standards derived after propagation of the 54 unique scenario combinations for dike segment 43–6 are given in . For the IR standards, we find a relative spread of approximately 70% between the strictest and least strict standard relative to the combination scenario in which the 50% scenarios for the uncertainty sources are incorporated. Compared to the spread found in the OAT analysis for dike segment 43–6 (breach development 2.6%, mortality 50% and evacuation 64%), this combined scenario-spread is relatively small. This is explained by the interaction between the three uncertainty sources. As shown in , mortality uncertainty does not affect the IR standards for most combined scenarios. Given the breach development and evacuation scenario, the three mortality function scenarios for most combinations result in the same flood safety standard. The three breach development scenarios each result in relatively low rise rates in the normative neighbourhoods, as a result of which the uncertainty of the mortality functions for rise rates > 0.5 m/h does not influence the standards. The results, therefore, indicate that influence of mortality uncertainty depends on breach growth (induced rise rates). The evacuation uncertainty most strongly affects the IR standards.
Figure 7. Uncertainty analysis results for IR standards (left) and ER standards (right) for dike segment 43-6: Each unique scenario combination is represented. Unit of the results is the annual flood probability in (y−1). The colouring eases the interpretation of the figure. The colour shifts from green to red for stricter safety standards.
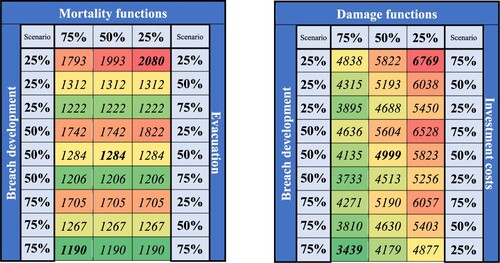
For the ER standards, the relative spread of the uncertainty is approximately 66% of the combined scenario in which the 50% scenarios for the uncertainty sources are incorporated. Opposed to the IR standards, all studied uncertainty sources impact the standards and act largely independently. The spread is larger than the spreads found in the OAT analysis (breach development 12%, damage functions 28% and investment costs 22%). As the uncertainty sources act independently, their influence adds up resulting in a larger spread. The damage functions most strongly influence the ER standards, while the flood defence investment cost uncertainty is of slightly smaller influence.
Based on the uncertainty analysis in this study, we find that the risk-based flood safety standards contain an error margin of approximately 70% around the 50% scenario for individual risk-based standards and 67% for the economic risk-based standards.
6. Discussion
When we compare the results from this study to previous studies on ER standards, we find partially matching results. Gauderis et al. (Citation2011) showed for ER standards that inundation pattern uncertainty (affected by breach development) and investment cost uncertainty are the prime uncertainties for ER standards in dike ring 43, while damage function uncertainty was considered to be of small influence. We came to the same observation as Gauderis et al. (Citation2011) regarding the investment cost uncertainty. However, the results of this study suggest that damage function uncertainty influences the ER standards significantly as well, which was also found by De Moel et al. (Citation2012, Citation2014). Breach development uncertainty was found to be of limited influence, opposed to the findings of Gauderis et al. (Citation2011) and De Moel et al. (Citation2014). It must however be noted that Gauderis et al. (Citation2011) considered dike ring 43 in total, instead of only dike segment 43-6. For other dike segments of dike ring 43, the uncertainty could have a stronger influence, due to the presence of the emergency spill flow works mentioned in paragraph 5.2. This aspect shows that the importance of individual uncertainty sources is susceptible to local characteristics. Studies by Apel et al. (Citation2004), Merz and Thieken (Citation2009), Gauderis et al. (Citation2011), and De Moel et al. (Citation2012, Citation2014) focused on different areas and also showed that the relative importance of uncertainty sources on economic flood risk and related flood safety standards varies over different areas, which is an important finding from this study as well.
Flood risk calculations such as used in the Dutch flood safety standard derivations contain a large number of uncertainties. The fact that the expert-based uncertainty source ranking derived in this study is rather gradual, suggests that more uncertainty sources could be of less but still significant influence. In this study, we only quantified the five largest sources of uncertainty, while many more sources of uncertainty were investigated (). These five sources are expected to provide a decent estimate of the total uncertainty bandwidth, despite the fact that many additional uncertainty sources have not been incorporated in the quantification. Gauderis et al. (Citation2011) showed that depending on the study area, after the four to six most influential uncertainty sources, the contribution of remaining uncertainty sources is limited. Whether this is the case for IR standards as well is difficult to say due to the strong variety of uncertainty influence depending on spatial characteristics. Therefore, for the IR standards the results of this study could be further supported by investigating whether some of the less important uncertainty sources could still be of significant influence and in which specific situations. Furthermore, there might be additional yet unknown uncertainty sources relevant for flood risk quantification. During the expert elicitation, experts were asked whether they missed any uncertainty sources in the predefined list of uncertainty sources. To their knowledge, the experts believed that the provided list gave a full representation of known relevant uncertainty sources.
This study has shown that flood safety standards are subject to considerable uncertainty which is dominated by local characteristics of the area under consideration. Locally varying dike material (e.g. a sand or clay dike core) strongly affects the breach development, which in turn has a large effect on the flood safety standards. Also, the size of the flooded area and surface elevation differences affect the evacuation fraction and mortality. Dike ring 43 is a relatively large dike ring, under a river-dominated flood threat. The influence of evacuation uncertainty, which showed up as dominant for the IR standard uncertainty, will be significantly lower for smaller or more inclined areas under flood threat, as the flood arrival time will diminish, which decreases the importance of acute evacuation in the overall evacuation percentage of an area. The influence of breach development uncertainty and mortality uncertainty on individual flood risk was shown to be strongly related to the presence of elevated lines in the landscape, due to their influence on rise rates and resulting mortality. Large and flat lands where flood propagation is slow and rise rates are low will be less vulnerable to uncertainty in the derivation of flood safety standards. In floodplains where elevated features dominate flood propagation patterns, the uncertainty in the flood risk calculation methodology will be more prominent. Including these location characteristics in the flood safety standard derivation process instead of using more general values can significantly impact flood safety standards and allows for a better match between flood threats and consequences, thereby making costly dike improvements potentially unnecessary and enabling an improved distribution of funds on flood defence systems.
The results of this case study can be partially translated to flood risk uncertainty in different areas. First of all, the characteristics of the Dutch safety standard calculation process imply that IR standards will always be more susceptible to uncertainty than ER standards. The IR standards are derived based on the flood characteristics in a small part of the inundation zone (a specific normative neighbourhood) where the most extreme conditions occur. Uncertainties strongest affect these areas, hence the IR standards are impacted as well. Therefore, IR standards are highly sensitive to uncertainties in the model chain. ER standards, on the other hand, are derived based on properties of the entire inundation zone, which is why compensating effects moderate the uncertainty influence on ER standards, especially if flood zones are large such as for dike ring 43. ER standards are therefore less sensitive to uncertainties. Although IR standards are generally more prone to uncertainty of the individual uncertainty sources, interdependence between the uncertainty sources relevant for the IR standards was shown to limit the influence of mortality uncertainty.
The findings of this study can be less directly translated to seaside case studies because hinterland characteristics, flood hazards and some components of the safety standard derivation process itself differ. Therefore, we recommend further study on the uncertainty of the flood safety standards in other areas, with different origins of flood threats, flood defences and hinterland characteristics. This can provide more insight into which characteristics determine the influence of uncertainty sources.
The considered case study focussed on risk-based flood safety standards in the Netherlands, as set-up for the primary flood defence system. The Dutch primary flood defene system protects flood plains from fluvial and storm surge-induced flooding. Pluvial flood protection policies for these flood plains in the Netherlands are not as standardized and risk-based as for fluvial- and storm surge-induced flood protection, due to the often local character and less extreme flood characteristics. We, therefore, did not consider pluvial flooding in this study. For other situations, pluvial flood protection can be relevant as well. For pluvial risk-based flood protection standards, different variables and uncertainties are likely relevant, due to the different hydraulic characteristics of pluvial flooding.
This study has also given insight into how dike design choices or adaptations to the hinterland could potentially influence the flood consequences and optimal safety standards. The implications of dike design choices for flood consequences (and safety standards) are currently not taken into account in dike design. The insights from this study therefore support decision making for certain dike design alternatives (apply a sand or clay core for example). The discussed impact of detailed elevation patterns on flood risk indicates that it is also important to consider the influence of future spatial developments in flood zones on elevation patterns; e.g. the construction of an elevated railway line or removal of historical levees. Especially, IR standards can be affected significantly by these developments.
7. Conclusions
The objective of this study was to systematically quantify the uncertainty of risk-based flood safety standards for a case study in the Netherlands. In this paper, we have shown a method to identify and quantify the uncertainty in the flood safety standard derivation process for both economic and individual flood risks. This was done by propagating scenarios through a chain of complex models, consisting of a hydrodynamic inundation model, flood consequence quantification models, including people affected and associated evacuation estimation, as well as an economic optimization model. We conclude the following:
The results showed that there is a considerable uncertainty bandwidth for both individual risk (IR) flood safety standards and economic risk (ER) flood safety standards. We found an uncertainty bandwidth of 70% and 67% of the 50% scenario, respectively.
For the IR standards, uncertainty in evacuation percentages was found to be most important.
For the ER standards, uncertainty in damage functions, investment cost estimates and breach development scenario were all shown to affect the safety standards, of which the damage function uncertainty came out as most important.
The influence of uncertainty sources on IR standards strongly depends on local characteristics. Amongst others, elevation differences of the hinterland, the location of areas with high mortality and erosion resistance of the dike were shown to affect the importance of the breach development, evacuation and mortality uncertainty.
ER standards are less sensitive to specific characteristics of the hinterland than IR standards.
Data and software
The data that support the findings of this study are available from the corresponding author (S.G. Westerhof) upon reasonable request. Within this study, three main software packages have been used to perform flood risk calculations and derive flood safety standards, following the Dutch flood safety standard derivation method:
Delft-FLS Version 2.55: Delft-FLS is a 2D hydrodynamic simulation package used for flood simulations in this study. It was developed by WL Delft-Hydraulics and was released in 2001. The program requires Windows XP or earlier versions of Windows as operating system.
HIS-SSM Version 2.5: HIS-SSM is a Dutch software package used for quantification of flood consequences, based upon flood characteristics in ASCII files (such as from Delft-FLS) and damage functions. The program was developed by Geodan IT and HKV. Version 2.5 becames available in 2007. It requires Windows 95 or a more recent windows version as operating system.
Esri Arc-GIS Desktop, Arc-Map version 10.5: Esri Arc-GIS is a software program used for viewing and editing spatial data, used in this study for the calculation of flood risks to people based on flood characteristics from Delft-FLS. Arc-GIS Desktop was developed by Esri and version 10.5 became available in 2018. It requires Windows 7 or more recent Windows operating systems.
Acknowledgements
We would like to express our gratitude to the 6 experts in the field of flood risk & the Dutch flood safety standards for their willingness to cooperate in the expert elicitation carried out in this study.
Disclosure statement
No potential conflict of interest was reported by the author(s).
References
- Apel, H., Thieken, A., Merz, B., & Blöschl, G. (2004). Flood risk assessment and associated uncertainty. Natural Hazards and Earth System Sciences, 4(2), 295–308. https://doi.org/10.5194/nhess-4-295-2004
- Asselman, N. (2005). Consequences of floods - damage to buildings and casualties (Report Q3668). WL Delft Hydraulics.
- Beckers, J., & De Bruijn, K. (2011). Slachtofferrisico's waterveiligheid. [Victim risks flood safety] (Report number 1204144-005). Deltares.
- Berger, H. (2008). Achtergrondrapport HR2006 voor de zoete wateren. [Background report hydraulic boundary conditions 2006 for Dutch fresh water bodies] (Report number 2007.026). Rijkswaterstaat.
- Bockarjova, M., Rietveld, P., & Verhoef, E. (2009). First results immaterial damage valuation: Value of statistical life (VOSL), value of evacuation (VOE) and value of injury (VOI) in flood risk context, a stated preference study (III). Department of Spatial Economics.
- Bockarjova, M., Rietveld, P., & Verhoef, E. (2012). Composite valuation of immaterial damage in flooding: Value of statistical life, value of statistical evacuation and value of statistical injury. Tinbergen Institute Discussion Paper, 47(3).
- Brussee, A. R., Bricker, J. D., De Bruijn, K. M., Verhoeven, G. F., Winsemius, H. C., & Jonkman, S. N. (2021). Impact of hydraulic model resolution and loss of life model modification on flood fatality risk estimation: Case study of the Bommelerwaard, The Netherlands. Journal of Flood Risk Management.
- Campolongo, F., Saltelli, A., & Cariboni, J. (2011). From screening to quantitative sensitivity analysis. A unified approach. Computer Physics Communications, 182(4), 978–988. https://doi.org/10.1016/j.cpc.2010.12.039
- CBS & Kadaster. (2019). Wijk-en buurtkaart 2008 [Neighbourhood map 2008]. Retrieved June 4, 2019, from https://www.cbs.nl/nl-nl/dossier/nederland-regionaal/geografische%20data/wijk-en-buurtkaart-2008
- De Bruijn, K., & Van der Doef, M. (2011). Gevolgen van overstromingen - informatie ten behoeve van het project waterveiligheid in de 21e eeuw. [Flood consequences: Information for the flood safety 21st century study]. (Report number 1204144-004). Deltares.
- De Moel, H., Asselman, N., & Aerts, J. (2012). Uncertainty and sensitivity analysis of coastal flood damage estimates in the west of the Netherlands. Natural Hazards and Earth System Sciences, 12(4), 1045–1058. https://doi.org/10.5194/nhess-12-1045-2012
- De Moel, H., Bouwer, L., & Aerts, J. (2014). Uncertainty and sensitivity of flood risk calculations for a dike ring in the south of the Netherlands. Science of the Total Environment, 473-474(1), 224–234. https://doi.org/10.1016/j.scitotenv.2013.12.015
- Defra - Environment Agency. (2006). Flood risks to people - phase 2, the flood risks to people methodology. UK Department for Environment, Food and Rural Affairs (Defra).
- De Grave, P., & Baarse, G. (2011). Kosten van maatregelen: Informatie ten behoeve van het project waterveiligheid 21e eeuw (Deltares, Report number 1204144-003). Deltares.
- Diermanse, F. (2004). HR2006 - herberekening werklijn Rijn. [Hydraulic boundary conditions 2006 - recalculation for the river Rhine] (Report Q3623-1). WL Delft Hydraulics.
- Domeneghetti, A., Vorogushyn, S., Castellarin, A., Merz, B., & Brath, A. (2013). Probabillistic flood hazard mapping: Effects of uncertain boundary conditions. Hydrology and Earth System Sciences, 17(8), 3127–3140. https://doi.org/10.5194/hess-17-3127-2013
- Dufty, N., Dyer, A., & Golnaraghi, M. (2020). Flood risk management in Australia - building flood resilience in a changing climate. The Geneva Association.
- Egorova, R., Van Noortwijk, J., & Holterman, S. (2008). Uncertainty in flood damage estimation. International Journal of River Basin Management, 6(2), 139–148. https://doi.org/10.1080/15715124.2008.9635343
- ENW. (2017). Fundamentals of flood protection. Ministry of Infrastructure and the Environment - Expertise Network for Flood Protection.
- EUCOLD. (2018). European and US Levees and flood defences: Characteristics, risks and governance. Comité Francois des barages et réservoirs.
- European Parliament. (2007). Directive 2007/60/EC of the European Parliament and of the Council of 23 October 2007 on the assessment and management of flood risks. https://eur-lex.europa.eu/en/index.html.
- Gauderis, J., & Kind, J. (2011). Maatschappelijke kosten-batenanalyse waterveiligheid 21e eeuw, Bijlage D: Bewerking van schadegegevens. [Societal cost-beneft analysis flood safety 21st century, annex D: Processing of damage data] (Report number 1204144-006). Deltares.
- Gauderis, J., Kind, J., & Van Duinen, R. (2011). Maatschappelijke kosten-batenanalyse waterveiligheid 21e eeuw, Bijlage G: Monte Carlo-analyse. [Societal cost-benefit analysis flood safety 21st century, annex G: Monte carlo analysis] (Report number 1204144-006). Deltares. (in Dutch).
- Hazeu, G. (2005). Landelijk grondgebruiksbestand Nederland (LGN5); Vervaardiging, nauwkeurigheid en gebruik. [Nationwide land-use data of the Netherlands: data collection, accuracy and usage] (Alterra-rapport 1213), Wageningen.
- Hesselink, A., Stelling, G., Kwadijk, J., & Middelkoop, H. (2003). Inundation of a Dutch river polder, sensitivity analysis of a physically based inundation model using historic data. Water Resources Research, 39(9), Article 1234. https://doi.org/10.1029/2002WR001334
- Huizinga, H., Dijkman, M., Barendregt, A., & Waterman, R. (2004). HIS-Schade en Slachtoffer Module Versie 2.1 User Manual. Geodan IT & HKV.
- Jongman, B., Kreibich, H., Apel, H., Barredo, J. I., Bates, P. D., Feyen, L., Gericke, A., Neal, J., Aerts, J. C. J. H., & Ward, P. J. (2012). Comparative flood damage model assessment: Towards a European approach. Natural Hazards and Earth System Sciences, 12(12), 3733–3752. https://doi.org/10.5194/nhess-12-3733-2012
- Jonkman, S. (2007). Loss of life estimation in flood risk assessment. PhD thesis, TU Delft.
- Jorissen, R., Kraaij, E., & Tromp, E. (2016, October 17–21). Dutch flood protection policy and measures based on risk assessment. FLOODrisk 2016 - 3rd European Conference on Flood Risk Management, Lyon, France.
- Kjeldsen, T. (2015). How reliable are design flood estimates in the UK? Journal of Flood Risk Management, 8(3), 237–246. https://doi.org/10.1111/jfr3.12090
- Kok, M., Huizinga, H., Vrouwenvelder, A., & Barendregt, A. (2005). Standaardmethode 2004 Schade en Slachtoffers als gevolg van overstromingen. [Standard method 2004 for damage and victims calculation caused by floods] (Report number DWW-2005-005). Rijkswaterstaat.
- Kolen, B. (2013). Certainty of uncertainty in evacuation for threat driven response. PhD thesis, Radboud University Nijmegen.
- Maaskant, B., Kolen, B., Jongejan, R., & Kok, M. (2009). Fractions of preventive evacuation in case of flooding in the Netherlands. HKV.
- Merz, B., & Thieken, A. (2009). Flood risk curves and uncertainty bounds. Natural Hazards, 51(3), 437–458. https://doi.org/10.1007/s11069-009-9452-6
- Mevissen, S. (2010). Acute evacuation; a conceptual strategy to increase mass-evacuation during floods. The Netherlands Research School for Transport, Infrastructure and Logistics.
- Ministerie van Verkeer en Waterstaat,. (2007). Hydraulische randvoorwaarden primaire waterkeringen voor de derde toetsronde 2006-2011 (HR 2006) [Hydraulic boundary conditions primary flood defences for the third test round 2006-2011].
- NSW Department of Infrastructure, Planning and Natural Resources. (2005). Floodplain development manual - the management of flood liable land. New South Wales Government.
- Otto, A., Hornberg, A., & Thieken, A. (2018). Local controversies of flood risk reduction measures in Germany. An explorative overview and recent insights. Journal of Flood Risk Management, 11, S382–S394. https://doi.org/10.1111/jfr3.12227
- PDOK, Kadaster. (2004). Dataset: Actueel Hoogtebestand Nederland 1 [Altitude dataset the Netherlands]. Retrieved May, 2019, from https://www.pdok.nl/introductie/-/article/actueel-hoogtebestand-nederland-ahn1-
- Saint-Geours, N., Grelot, F., Bailly, J., & Lavergne, C. (2015). Ranking sources of uncertainty in flood damage modelling: A case study on the cost-benefit analysis of a flood mitigation project in the Orb delta, France. Journal of Flood Risk Management, 8(2), 161–176. https://doi.org/10.1111/jfr3.12068
- Slootjes, N., & Van der Most, H. (2016). Achtergronden bij de normering van de primaire waterkeringen in Nederland. [Background for the safety standards of the Dutch primary flood defences] Ministerie van Infrastructuur en Milieu, report.
- Slootjes, N., & Wagenaar, D. (2016). Factsheets normering primaire waterkeringen. [Factsheets safety standards for the rimary flood defences]. Ministerie van Infrastructuur en Milieu, report.
- Thieken, A., Apel, H., & Merz, B. (2015). Assessing the probability of large-scale flood loss events: A case study for the River Rhine, Germany. Journal of Flood Risk Management, 8(3), 247–262. https://doi.org/10.1111/jfr3.12091
- TNO. (2019). Ondergrondgegevens Dinoloket [Dubsoil data Dinloket]. Retrieved July 14, 2019, from https://www.dinoloket.nl/ondergrondgegevens.
- Van der Sluijs, J., Janssen, P., Petersen, A., Kloprogge, P., Risbev, J., Tuinstra, W., & Ravetz, J. (2004). RIVM/MNP Guidance for uncertainty assessment and communication: Tool catalogue for uncertainty assessment (Utrecht, Report no. NWS-E-2004-37). Copernicus Institute for Sustainable Development and Innovation.
- Vergouwe, R., Huting, R., & Van der Scheer, P. (2014). Veiligheid Nederland in kaart 2: Overstromingsrisico dijkring 43 Betuwe, Tieler- en Culemborgerwaarden (Report number HB 2311021). Rijkswaterstaat WVL Projectbureau VNK2.
- Verheij, H. (2003). Aanpassen van het bresgroeimodel in HIS-OM [Adaptation of the breach growth model in HIS-OM] (Report number Q3299). WL Delft Hydraulics.
- VNK2 Project Office. (2012). Flood risks in the Netherlands VNK2: The method in brief; technical background. VNK2 Project Office.
- Wagenaar, D., De Bruijn, K., Bouwer, L., & De Moel, H. (2016). Uncertainty in flood damage estimates and its potential effect on investment decisions. Natural Hazards and Earth System Sciences, 16(1), 1–14. https://doi.org/10.5194/nhess-16-1-2016
- Warmink, J., Janssen, A., Booij, M., & Krol, M. (2010). Identification and classification of uncertainties in the application of environmental models. Environmental Modelling & Software, 25(12), 1518–1527. https://doi.org/10.1016/j.envsoft.2010.04.011
- Waterschap Rivierenland. (2014). Dijkverbetering Gorinchem-Waardenburg, GoWa tekeningenbundel oude bestekken. [Dike reinforcement Gorinchem-Waardenburg, GoWa old design drawings].
- Zhu, Y. (2006). Breach growth in clay dikes. PhD thesis, Delft University of Technology, Delft.