
Abstract
Surface-water flooding in urban areas has become a pressing issue due to changing precipitation patterns, expanding urban areas and ageing drainage infrastructure. Selection of flood-management options for widespread implementation using quantitative performance measures is both technically and computationally demanding, which limits the evidence available for decision support. This study presents a new framework for surface-water flood-intervention assessment at high resolution. The framework improves computational efficiency through utilisation of accessible data, simplified representations of interventions and a resource efficient cellular automata flood model. The advantages of this framework are demonstrated through an example case study where the performance of 12 high-level intervention strategies has been evaluated. Results from the case study demonstrate that the framework is able to provide quantitative performance values for a range of interventions. The speed of analysis supports the application of the framework as a decision-making tool for urban water planning.
Introduction
Surface-water flooding consists of overland flows originating from surface, sewer and drainage features unable to fully convey water during intense precipitation (Golding Citation2009; Butler and Davies Citation2010). Surface-water can contribute significantly to the overall consequences of flooding, but has historically received less attention than its fluvial and coastal flooding counterparts (Douglas et al. Citation2010) even though four million properties are classified as ‘at risk’ from surface-water flooding in England (Environment Agency Citation2009). In the 2007 floods in England and Wales, for example, some two-thirds of the 55 000 homes affected were impacted by surface-water (Environment Agency Citation2007; Pitt Citation2008; Parker, Priest, and McCarthy Citation2011).
Changes to climate, land use and urban areas are likely to exacerbate future surface-water flooding (Chocat et al. Citation2007; Howard et al. Citation2010; Barbosa, Fernandes, and David Citation2012, IPCC Citation2014). Flood risk is further compounded with the expense of replacing ageing drainage infrastructure (Ana and Bauwens Citation2010). UK legislation recognises the costs of this mode of flooding and has called for new frameworks and approaches to mitigate and manage consequences (Pitt Citation2008; Ellis and Revitt Citation2010; HM Government Citation2016).
A large range of surface-water flood management interventions is available, including conventional piped solutions, catchment management, green infrastructure, sustainable drainage systems (SuDS), property level protection and designing for exceedance. Many options are relatively new to application, and with many possible alternatives, requiring a range of expertise to implement, it can be difficult to ascertain the intervention best suited for the particular case. Complexity of decision-making is increased given the large number of alternatives for scale and placement within an urban catchment (Birgani, Yazdandoost, and Moghadam Citation2013). In addition, the computational expense of 2D above-ground flood modelling limits the number of options that can be analysed prior to detailed design (Emanuelsson et al. Citation2014). This leads to a limited evidence base for decision-makers.
Current selection approaches typically utilise a qualitative appraisal of many options or a quantitative examination of a small number of interventions. Intervention selection strategies include: multi-criteria decision-making techniques, frequently led by stakeholder opinions and ranking (Makropoulos et al. Citation2008; Ellis et al. Citation2004; Martin, Ruperd, and Legret Citation2007; Young et al. Citation2010; Ellis, Lundy, and Revitt Citation2011; Birgani, Yazdandoost, and Moghadam Citation2013); GIS analysis (Weng Citation2001; Makropoulos et al. Citation2006; Ellis and Viavattene Citation2013); detailed analysis of a small number of options, such as focusing solely on SuDS or urban planning (Pyke et al. Citation2011; CIRIA Citation2015); and approaches that focus on costs and benefits (Susdrain Citation2015). Many of these approaches also rely on industry standard flood assessment to generate hazard information using computationally intensive hydrodynamic modelling (Elliott and Trowsdale Citation2007). Relying on expert judgement and ranking systems is subjective, with the potential to ‘lock in’ existing practice and inhibit innovation.
This paper presents a framework that enables a rapid, high-level and quantitative assessment of multiple surface-water management options. The framework and underlying assumptions are explained, and the approach is tested by assessing and ranking options in an example catchment at 1 m resolution. The purpose of this test is to demonstrate the utility of the framework and provide an example for future applications. Results include a comparison of intervention performance and recommendations regarding general applications and future developments of the framework.
Framework
The framework prioritises easily accessible data and utilises a computationally efficient above-ground surface-water routing model, capable of generating results to steer further investigations at a low resource cost. Fast data entry and processing speeds are achieved through simplification of land use and intervention characteristics, alongside clear performance metrics.
The framework () is split into four steps: study area representation, intervention strategy design, scenario simulation and intervention performance assessment. This section explains the data requirements and actions within each of these steps.
Figure 1. Framework for surface-water intervention assessment.
Data requirements
Data requirements to apply the framework include common formats, typical of data availability for a high level study. These include elevation, land use, building locations and rainfall descriptors. Land surface elevation and building thresholds are specified using a processed LiDAR digital terrain model (DTM). Accurate DTMs from LiDAR surveys are available for 70% of England through the Environment Agency’s data archive, and building footprints are available for the entirety of the UK through Ordinance Survey mapping (Data.gov.uk Citation2016). Other products can also be used to specify elevation, provided they can be converted into an ASCII format, but it should be noted that this approach is only feasible in areas with high-resolution elevation data.
Rainfall is applied to the model surface using hyetographs to describe events. This has been derived from intensity, duration and frequency data, available for the UK through the Centre for Ecology and Hydrology Flood Estimation Handbook (CEH (Centre for Ecology and Hydrology) Citation2013). Data requirements for parameterisation of land-use types and intervention effects are specified as part of the framework and therefore do not require external data sources. User designation of parameter values is discussed as part of the example case study, later the paper.
Study-area representation
The first stage of the framework is to set up a representation of the study area. This consists of a ‘do nothing’ scenario, onto which interventions are overlaid in subsequent steps of the approach. Specifying the characteristics of the urban catchment requires landscape topography, land-use characteristics and building locations.
Computational implementation of the process is achieved via storage of all information into a land-elevation matrix, a land-use classification matrix and a land-use property table. The land-elevation matrix is generated from processing the DTM. Surface properties of each cell are classified based on land use and indexed to parameter values.
Intervention strategy design using simplified representation
A simple representation of intervention effects is used in the model (described in the next section) adopted through application of parameters that control flow input, output and transmission speed in each cell. Spatial adjustment of these parameters is used to simply represent the physical performance of the various interventions. This provides a fast and effective method to investigate many options or combination of options.
The parameters specified are ‘roughness’, ‘rainfall’ and ‘infiltration’. The roughness parameter controls the velocity of flow across a cell, and is specified using a Manning ‘n’ value. Infiltration removes water in a cell at a set rate, whilst rainfall adds water to a cell surface at a set rate. Rainfall can be varied temporally to represent a range of storm hyetographs.
Variation in parameters represents intervention design through several mechanisms. Adjustments to roughness are indicative of changes to surface cover, such as the influence of buildings or planting vegetation to slow runoff. Infiltration represents both sub-surface runoff conveyance measures, such as sewer network upgrades, and infiltration approaches such as soakaways. Adjustments made to the rainfall hyetograph input within a cell are used to represent interventions where rainfall is captured and stored before it reaches the land surface. Rain capture can include options such as green roofs, rainwater harvesting and attenuation tanks. Elevation in a cell can also be adjusted to account for interventions such as raising building thresholds or construction of flood walls and attenuation basins. Many interventions are represented using multiple parameters; for example, swales and infiltration trenches will slow runoff in addition to infiltrating water. Simple representation using these parameters is unsuitable for detailed design, but has the advantage of enabling multiple, fast simulations to determine performance of intervention types and locations in a particular catchment.
Computational implementation of this framework is achieved through scenario input. This is the process of specifying intervention parameters and is achieved using a matrix that designates intervention locations and a property table that defines the parameter values of each intervention. Automation of scenario generation greatly speeds up data entry, as only one intervention matrix is required for each new scenario, alleviating users from having to manually adjust cell parameters. This method requires users to create a new matrix for each scenario and one property table that contains parameter values for all interventions.
By inputting intervention locations as an independent step from the study area, multiple intervention scenarios can be generated and then applied one at a time as masks overlain on the existing land use. Generally, interventions from the mask will overwrite existing parameters, but separation facilitates the option for land-use parameter values to be maintained in a cell where an intervention does not overwrite them. This results in the possibility of the same intervention having different characteristics when applied on different land-use types. For example, a rain-storage tank would not affect infiltration values around it, and so tanks applied on different surfaces would have different representations in a cell.
Scenario simulation
The framework utilises the Cellular Automata Dual-DrainagE Simulation (CADDIES) model for flood simulation (University of Exeter Citation2016). CADDIES is a cellular-automata-based surface-water modelling tool developed at the Centre for Water Systems, University of Exeter (Guidolin et al. Citation2012, Citation2016). The model avoids the computational cost of solving complex hydrodynamic equations via application of simplified transition rules, based on parameters in each cell across a regular grid. Previous research has demonstrated that the modelling approach has comparable accuracy at process speeds five to 20 times faster than industry-standard software (Gibson et al. Citation2016; Guidolin et al. Citation2016).
Assessment criteria
Performance of intervention strategies is assessed through an analysis of peak flood depth and extent, and damage costs to buildings. Comparison of multiple scenarios is made relative to a ‘do nothing’ approach.
Damage costs are calculated by applying a depth-damage function to building polygons within flood extents using GIS tools (Chen et al. Citation2016). Peak depths are used to ensure that a worst-case scenario is recorded. The depth-damage function was based on costs for an average three-bedroom semi-detached property (Penning-Rowsell et al. Citation2010). Costs specified as GBP per depth per household were converted to GBP per depth per m2 using average household sizes in England (Department for Communities and Local Government Citation2010).
Case-study application
Overview
The framework was tested by analysing the flood reduction performance of 12 surface-water intervention scenarios within an urban catchment case study. The study domain covers an area of 5 km × 4 km (20 000 000 cells). Interventions are indicative of generalised surface-water management strategies, and do not represent specific measures. Intervention performance was assessed in relation to flood depth and damage costs.
Study-area representation
The catchment surface was specified using 1 m resolution DTM LiDAR with building thresholds and road locations added using shapefiles. Inclusion of building thresholds allows flow to be directed by building location, but flooding to occur within a building only once the water level has risen to above a threshold height of 0.15 m, representative of a door height above street level.
Land uses were specified using Ordnance Survey Mastermap and satellite imagery and were simplified into four categories: urban, green space, buildings and roads (). For the purposes of simplification, urban and green space area were classified based on 250 m × 250 m grid cells, in which the predominant land use was attributed to the entire block.
Table 1. Parameter values for land-use types in CADDIES.
Roughness values were attributed based on commonly accepted specifications found in the literature (USGS (United States Geological Society) Citation1989; Butler and Davies Citation2010; CIRIA Citation2015). Buildings were attributed an artificially high Manning ‘n’ value to account for water being held up within a structure during flooding (Syme Citation2008). Infiltration for green spaces was based on standard values for the sandy loam soil found in the area (Bettess Citation1996; Landis Citation2016; UNFAO (United Nations Food & Agriculture Organization) Citation2016). Areas served by the existing combined sewer system, including roads and urban land use, were represented by an infiltration value of 12 mm h−1, in line with the Environment Agency’s approach for surface-water flood mapping (Environment Agency Citation2013). It was assumed that buildings would have no capacity for infiltration.
Intervention strategy design
The generalised interventions examined in this example are shown in . These represent general relationships of parameters and are not mapped to specific interventions. Interventions were placed across urban areas in the catchment, with their effects assumed to apply to every cell within this extent. Interventions modelled in this way represent changes to land use or to collection systems across a large area (i.e. drainage catchment). Roughness ranges from a smooth channel (0.010) to grasses (0.110). An infiltration rate of 20 mm h−1 and a rainfall capture rate of 20 mm h−1 were examined. ‘No change’ is specified in cases where an intervention did not affect an underlying land-use parameter.
Table 2. Parameter values for intervention types in CADDIES.
Scenario simulation
Simulation was undertaken using a minimum model time step of 0.01 s. Small time steps such as this have been demonstrated to deliver model accuracy of flood extents at 98–99% correlation with industry standard hydrodynamic flood models (Gibson et al. Citation2016).
It was assumed that as an intervention screening exercise, limited data for the catchment would be available, and analysis was therefore based on typical catchment profiles in England and Wales from the Environment Agency surface-water flood-mapping methodology (Environment Agency Citation2013). To generate extensive flooding, rainfall generation was based on a high-magnitude 200-year return period storm using rainfall for the area of LiDAR coverage (CEH (Centre for Ecology and Hydrology) Citation2013). A constant intensity of 47 mm h−1 was used to represent an assumed time of concentration of 1 h (Environment Agency Citation2013). The simulation was set to run for 5 h (model time) so that water ponding after precipitation could be examined.
Intervention performance assessment
Peak flooding across the study area in the ‘do nothing’ scenario
presents peak flood depth across the study area in the ‘do nothing’ scenario. Flood extents are concentrated along the two watercourses and, to a lesser extent, in the road network. An area of localised flooding within the urban area is highlighted. Depths of approximately 0.5 m are observed along and adjacent to roads within this area, indicating that the network acts as the main conveyance route for surface-water in this region. Floods have ponded at low points in topography, some of which are alongside houses.
Figure 2. Peak flood depth for ‘do nothing’ simulation with the area of most extensive flooding highlighted.
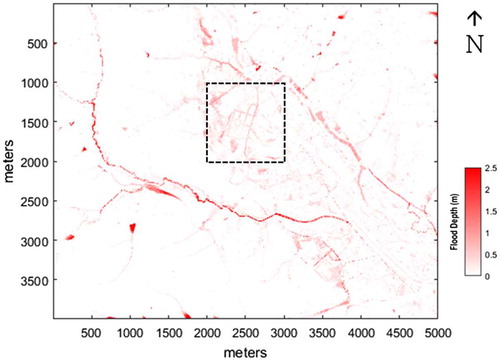
Isolated ponding is also seen distributed across the catchment. It is assumed that disruption associated with this flooding will be minimal in comparison with the effect on the densely populated urban area, and so further analysis is focused on the highlighted region.
Comparison of intervention effects on peak flooding in the urban area
is focused on the urban area identified in . Intervention subplots highlight the difference in peak flood depth relative to the ‘do nothing’ depth. The absolute flood depth of the ‘do nothing’ scenario is shown in blue, and differences relative to this for each intervention are shown in green (reduction) and red (increase).
Figure 3. Relative maximum flood depth for intervention scenarios in the urban area.
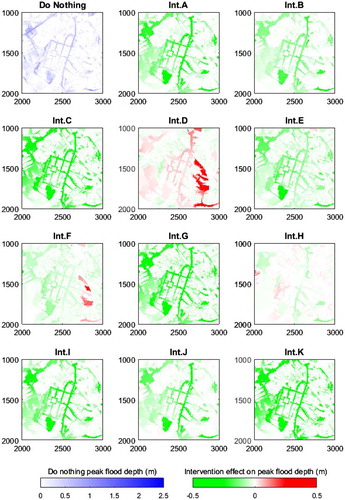
Flood depth and extent differ between each intervention. Maximum depth and extent of flooding occur in Intervention D, Intervention H and the ‘do nothing’ scenarios. Minimum flooding is observed in Interventions C, G, I and K. Flooding predominantly occurs along the road network in all interventions, and this supports the earlier observation that this is a key conveyance mechanism for surface-water flooding in this catchment.
Interventions C and K show the largest reduction in peak flood depth across the catchment. These interventions capture 20 mm of rainfall and set the infiltration rate to 20 mm h−1 whilst maintaining (C) or increasing (K) the surface roughness. Intervention G also shows a large reduction in peak flood depth, but this is less pronounced than Interventions C and K, likely due to the decreased roughness (0.010) increasing the runoff speed and allowing water to pond.
Nine of the 11 interventions show a consistent increase or reduction in depth across the majority of the urban area. The two remaining interventions (F and H) show a spatial trade-off in changes to peak depth, with some areas benefitting from interventions and others showing an increase. This is attributed to the uniformity across a large spatial extent of all the intervention strategies examined. More spatial variation may be observed where interventions are applied in small, discrete schemes.
Flood-damage cost comparison
Spatial differences in flood depth associated with each intervention mean that interventions that have the greatest impact on flood depth reduction may not cause the greatest reduction in flood damage costs. It is therefore important that these be presented alongside the flood-depth figures.
shows interventions ranked according to the property damage costs. Interventions K, C and G show the largest reduction in damage costs. These interventions save between 79 and 86% of costs relative to the do nothing approach. Each of these interventions consists of rain capture and increasing infiltration rates. Interventions that capture rain and change surface roughness (I, E, A) perform better than those that increase the infiltration rate and change surface roughness (J, B, F).
Table 3. Building-damage cost comparison in the highlighted urban area.
All interventions where rainfall and infiltration rates are altered perform better with a higher surface roughness, evident through a 9.5% cost difference between Intervention J (roughness of 0.11) and Intervention F (roughness 0.01). Interventions that change roughness parameters demonstrate up to a 10% reduction in cost; in comparison, increasing infiltration shows up to 44%, and reducing rainfall shows up to 64%.
Intervention D is the only intervention that shows a different performance when assessed by depth versus a cost-based comparison. The intervention causes deeper peak flood depths than the ‘do nothing’ scenario (), but damage costs are 3% less (). This is due to fast conveyance preventing deep flooding against buildings in the northwest quadrant of the catchment. Deeper flooding in the rest of the catchment does not coincide with building locations. The change in intervention performance ranking highlights selection of applicable metrics when assessing options.
Discussion
Comparison of intervention performance
Both the damage cost and flood extent analysis rank the best-performing interventions in the same group. A small difference is observed in the worst-performing interventions (‘do nothing’ and Intervention D), due to the location of deeper flooding not coinciding with buildings in the study area. Visualisation of flooding using the maps allows a quick overview of schemes, but does not capture the significance of flood locations (Merz et al. Citation2004; Hammond et al. Citation2015). It is recommended that flood damage cost be used as the primary metric for gauging intervention performance.
Interventions that captured rainfall and increased infiltration showed the largest reduction in peak flood depth and damage costs relative to the ‘do nothing’ scenario. Interventions with these traits exhibited a catchment wide flood depth reduction alongside a 79–86% decrease in damage costs. Rainfall capture was a more effective strategy for flood reduction than increasing infiltration. Rainfall capture strategies accounted for a 55–64% decrease in damage costs, whereas infiltration strategies accounted for 35–44%.
Strong performance of interventions based on rainfall capture is exaggerated by no limit being placed on storage. In reality, storage capacity for captured rainfall will limit the effectiveness of an intervention, particularly during a prolonged storm or with wet antecedent conditions. Further over-estimation occurs due to the same surface area being specified for capture and infiltration. Roofs feature as the primary site for rainfall capture, but not all roofs are suitable for construction, and so assuming an equal area for rainfall capture as infiltration will exaggerate the reduction effect (Ellis and Viavattene Citation2013).
This study investigated uniform intervention strategies. Analysis of spatial variation in intervention placement may highlight combinations of interventions that provide superior performance. An example is low surface roughness conveying runoff to a storage area quickly. Interventions in key locations may also provide comparable damage reduction to widespread application at a lower installation cost. The road network acted as a key conveyance mechanism for runoff and may provide an opportunity to site interventions (Pregnolato et al. Citation2016).
Limitations of simplified representation of physical processes
Although simplicity of the model is a result of architecture designed for speed, this creates several limitations regarding representation of physical factors that should be acknowledged (Gibson et al. Citation2016). CADDIES lacks the capability for 1D sewer network modelling in tandem with the 2D domain, resulting in difficulty simulating interactions between the existing conventional drainage system and interventions, such as surcharge.
In the case of soils, CADDIES applies a set infiltration rate that does not simulate the underlying physical processes controlling water movement through a substrate (Beven and Germann Citation2013). This was accommodated through conservative infiltration rates in the case study, typically 20 mm h−1 including an allowance of 12 mm h−1 for drainage infrastructure. There is scope to increase this to represent the combined effect of storm sewers on a drainage catchment in combination with the infiltration potential of surfaces.
Rainfall capture was treated as a constant value during the 1 h event. CADDIES can also support temporally and spatially variable rainfall, which can be calibrated to simulate storage spilling at a certain point. This would represent a physical storage system more accurately but would negatively impact the model setup time.
Future application of this method can advance on the simplified representations of land use used in this example through application of finer resolution categorisation, in terms of both the number of land use types and the scale of grid cells assessed. This is of particular importance when assessing the impacts of numerous small and dispersed interventions, such as the effects of nature based solutions (Schanze Citation2017).
Maximum flood depth
Maximum flood depth was a useful metric for identifying the peak impact caused by surface-water flooding and provided adequate data for a damage-cost assessment. Limiting simulation outputs to one maximum depth file saves computational space where many model runs are required and provides decision-makers with simple visualisation of an interventions effects. However, a maximum flood depth map does not represent the total volume or extent of flooding at any particular moment. This metric is unsuitable for uses where accurate representations are required at a time step, such as in the case of emergency evacuation planning. If this use is required, the records at each time step can be adjusted in the simulation.
Damage costs
The damage assessment was focused on direct and tangible damage in properties (Hammond et al. Citation2015). Damage-cost calculations were adequate for a strategic assessment, but relying on an average cost for all building misses detail required for a comprehensive assessment. Where further detail is required, the current framework could support this by applying multiple classifications for structures alongside provision for strategic buildings and infrastructure during the intervention performance assessment. This would require detailed knowledge of the building use within a catchment and so would lead to an increase in model setup time.
This research found the road network to be the main conveyance route for surface water. Recent literature has identified disruption to road networks as a significant cost caused by extreme weather (Pregnolato et al. Citation2016). The cost method applied could be extended through addition of costs associated with this disruption.
Conclusions
This research has developed a framework to assess the performance of surface-water flood-management interventions. The framework is able to quantify the performance of many interventions using easily accessible data to rapidly screen options. This is achieved through the application of computationally efficient models and a simplified representation of interventions.
Application of the framework to an example case study highlights ease of comparison between 12 simplified intervention scenarios. Analysis of parameter effects over an identical area highlighting interventions that captured rainfall demonstrated the largest reduction in flood extent and damage when compared with interventions that infiltrated rainfall or slowed runoff. However, in practice, opportunities for rainfall capture and storage may be less extensive than for infiltration. Antecedent conditions are also likely to significantly impact the storage potential of rainfall capture.
Several limitations associated with simplification of physical processes are present due to a model architecture aimed at speed. This is due to the need for efficient simulation and supports the intention of this framework to guide and evidence optioneering, rather than conducting detailed design.
Future research will develop the broad-scale assessment presented by refining parameters to represent the costs and benefits of specific interventions at a high resolution. Application of the framework for quantitative performance analysis using specific interventions will build towards applicable general guidance on intervention selection.
Disclosure statement
No potential conflict of interest was reported by the authors.
Funding
This research was supported by three UK research council funded programmes: the EPSRC Centre for Doctoral Training in Water Informatics Science and Engineering [grant number EP/L016214/1], the EPSRC research fellowship Safe & SuRe water management [grant number EP/K006924/1], and the NERC project SINATRA - Susceptibility of catchments to INTense RAinfall and flooding [grant number NE/K008765/1]. LiDAR was provided by the Environment Agency and mapping was provided through OS Mastermap data on the Digimap service.
References
- Ana, E. V., and W. Bauwens. 2010. “Modelling the Structural Deterioration of Urban Drainage Pipes: The State-of-the-Art in Statistical Methods.” Urban Water Journal 7 (1): 47–59.10.1080/15730620903447597
- Barbosa, A. E., J. N. Fernandes, and L. M. David. 2012. “Key Issues for Sustainable Urban Surface Water Management.” Water Research 46 (20): 6787–6798.10.1016/j.watres.2012.05.029
- Bettess, R. 1996. Infiltration Drainage: Manual of Good Practice. London: Construction Industry Research and Information Association.
- Beven, K., and P. Germann. 2013. “Macropores and Water Flow in Soils Revisited.” Water Resour Res 49: 3071–3092.10.1002/wrcr.20156
- Birgani, Y. T., F. Yazdandoost, and M. Moghadam. 2013. “Role of Resilience in Sustainable Urban Surface Water Management.” Hydraulic Structures: Scientific Professional Quarterly 1 (1): 42–50.
- Butler, D., and J. Davies. 2010. Urban Drainage 3rd ed. Abingdon: CRC Press.
- CEH (Centre for Ecology and Hydrology). 2013. “Flood Estimation Handbook.” www.fehweb.ceh.ac.uk
- Chen, A. S., M. J. Hammond, S. Djordjevic, D. Butler, D. M. Khan, and W. Veerbeek. 2016. “From Hazard to Impact: Flood Damage Assessment Tools for Mega Cities.” Natural Hazards 82 (2): 857–890.10.1007/s11069-016-2223-2
- Chocat, B., R. Ashley, J. Marsalek, M. R. Matos, W. Rauch, W. Schilling, and B. Urbonas. 2007. “Toward the Sustainable Management of Urban Storm-Water.” Indoor and Built Environment 16 (3): 273–285.10.1177/1420326X07078854
- CIRIA. 2015. SuDS Manual C753.
- Data.gov.uk. 2016. “UK Government Data Archive.” www.data.gov.uk.
- Department for Communities and Local Government. 2010. “English Housing Survey. Housing Stock Report 2008.” Office for National Statistics.
- Douglas, I., S. Garvin, N. Lawson, J. Richards, J. Tippett, and I. White. 2010. “Urban Pluvial Flooding: A Qualitative Case Study of Cause, Effect and Nonstructural Mitigation.” Journal of Flood Risk Management 3 (2): 112–125.10.1111/jfrm.2010.3.issue-2
- Elliott, A. H., and S. A. Trowsdale. 2007. “A Review of Models for Low Impact Urban Surface Water Drainage.” Environmental Modelling & Software 22 (3): 394–405.10.1016/j.envsoft.2005.12.005
- Ellis, J. B., and D. M. Revitt. 2010. “The Management of Urban Surface Water Drainage in England and Wales.” Water and Environment Journal 24 (1): 1–8.10.1111/tid.2010.24.issue-1
- Ellis, J. B., and C. Viavattene. 2013. “Sustainable Urban Drainage System Modelling for Managing Urban Surface Water Flood Risk.” CLEAN–Soil, Air Water 42 (2): 153–159.
- Ellis, J. B., J. C. Deutsch, J. M. Mouchel, L. Scholes, and M. D. Revitt. 2004. “Multicriteria Decision Approaches to Support Sustainable Drainage Options for the Treatment of Highway and Urban Runoff.” Science of the Total Environment 334: 251–260.10.1016/j.scitotenv.2004.04.066
- Ellis, J. B., L., Lundy, and M. Revitt. 2011. “An Integrated Decision Support Approach to the Selection of Sustainable Urban Drainage Systems (SUDS).” In SWITCH Conference: The Future of Urban Water; Solutions for Liveable and Resilient Cities.
- Emanuelsson, M. A. E., N. McIntyre, C. F. Hunt, R. Mawle, J. Kitson, and N. Voulvoulis. 2014. “Flood Risk Assessment for Infrastructure Networks.” Journal of Flood Risk Management 7 (1): 31–41.10.1111/jfr3.12028
- Environment Agency. 2007. Review of 2007 summer floods.
- Environment Agency. 2009. “Flooding in England: A National Assessment of Flood Risk.” https://www.gov.uk/government/uploads/system/uploads/attachment_data/file/292928/geho0609bqds-e-e.pdf
- Environment Agency. 2013. “What is the Updated Flood Map for Surface Water?” https://www.gov.uk/government/uploads/system/uploads/attachment_data/file/297432/LIT_8988_0bf634.pdf
- Gibson, M. J., D. A. Savic, S. Djordjevic, A. S. Chen, S. Fraser, and T. Watson. 2016. “Accuracy and Computational Efficiency of 2D Urban Surface Flood Modelling Based on Cellular Automata.” 12th International Conference on Hydroinformatics, (154), 801–810.
- Golding, B. W. 2009. “Long Lead Time Flood Warnings: Reality or Fantasy?” Meteorological Applications 16 (1): 3–12.10.1002/met.v16:1
- Guidolin, M., A. Duncan, B. Ghimire, M. Gibson, E. Keedwell, A. Chen, S. Djordjevic and D. Savic. 2012. “CADDIES: A New Framework for Rapid Development of Parallel Cellular Automata Algorithms for Flood Simulation.” Proceedings of the 10th International Conference on Hydroinformatics, Hamburg, Germany.
- Guidolin, M., A. S. Chen, B. Ghimire, E. C. Keedwell, S. Djordjević, and D. A. Savić. 2016. “A Weighted Cellular Automata 2D Inundation Model for Rapid Flood Analysis.” Environmental Modelling & Software 84: 378–394.10.1016/j.envsoft.2016.07.008
- Hammond, M. J., A. S. Chen, S. Djordjević, D. Butler, and O. Mark. 2015. “Urban Flood Impact Assessment: A State-of-the-Art Review.” Urban Water Journal 12 (1): 14–29.10.1080/1573062X.2013.857421
- HM Government. 2016. National flood resilience review.
- Howard, G., K. Charles, K. Pond, A. Brookshaw, R. Hossain, and J. Bartram. 2010. “Securing 2020 Vision for 2030: Climate Change and Ensuring Resilience in Water and Sanitation Services.” Journal of Water and Climate Change 1 (1): 2–16.10.2166/wcc.2010.205
- IPCC. 2014: Pachauri, R.K., Allen, M.R., Barros, V.R., Broome, J., Cramer, W., Christ, R., Church, J.A., Clarke, L., Dahe, Q., Dasgupta, P. and Dubash, N.K., 2014. “Climate Change 2014: Synthesis Report.” Contribution of Working Groups I, II and III to the Fifth Assessment Report of the Intergovernmental Panel on Climate Change, Geneva.
- Landis. 2016. “Soilscapes.” Cranfield Soil and Agrifood Institute. Cranfield University. www.landis.org.uk/soilscapes
- Makropoulos, C., S. Liu, K. Natsis, F. A. Memon, and D. Butler. 2006. “Supporting the Choice, Siting and Evaluation of Sustainable Drainage Systems in New Urban Developments.” Proceedings of the Urban Drainage Modelling and Water Sensitive Urban Design Conference, Melbourne, Australia, 95–103.
- Makropoulos, C., K. Natsis, S. Liu, K. Mittas, and D. Butler. 2008. “Decision Support for Sustainable Option Selection in Integrated Urban Water Management.” Environmental Modelling and Software 23 (12): 1448–1460.10.1016/j.envsoft.2008.04.010
- Martin, C., Y. Ruperd, and M. Legret. 2007. “Urban Surface Water Drainage Management: The Development of a Multicriteria Decision Aid Approach for Best Management Practices.” European Journal of Operational Research 181 (1): 338–349.10.1016/j.ejor.2006.06.019
- Merz, B., H. Kreibich, A. Thieken, and R. Schmidtke. 2004. “Estimation Uncertainty of Direct Monetary Flood Damage to Buildings.” Natural Hazards and Earth System Science 4 (1): 153–163.10.5194/nhess-4-153-2004
- Parker, D. J., S. J. Priest, and S. S. McCarthy. 2011. “Surface Water Flood Warnings Requirements and Potential in England and Wales.” Applied Geography 31 (3): 891–900.10.1016/j.apgeog.2011.01.002
- Penning-Rowsell, E., C. Viavattene, J. Pardoe, J. Chatterton, D. Parker and J. Morris. 2010. “The Benefits of Flood and Coastal Management: A Handbook of Assessment Techniques.” Flood Hazard Research Centre. http://www.envia.bl.uk/handle/123456789/4797
- Pitt, M. 2008. “Pitt Review: Lessons Learnt from the 2007 Floods.” http://webarchive.nationalarchives.gov.uk/20100812084907/, http://archive.cabinetoffice.gov.uk/pittreview/_/media/assets/www.cabinetoffice.gov.uk/flooding_review/pitt_review_full%20pdf.pdf
- Pregnolato, M., A. Ford, C. Robson, V. Glenis, S. Barr, and R. Dawson. 2016. “Assessing Urban Strategies for Reducing the Impacts of Extreme Weather on Infrastructure Networks.” Royal Society Open Science 3 (5): 160023.10.1098/rsos.160023
- Pyke, C., M. P. Warren, T. Johnson, J. LaGro Jr, J. Scharfenberg, P. Groth, R. Freed, W. Schroeer, and E. Main. 2011. “Assessment of Low Impact Development for Managing Surface Water with Changing Precipitation due to Climate Change.” Landscape Urban Plan 103 (2): 166–173.10.1016/j.landurbplan.2011.07.006
- Schanze, J. 2017. “Nature-Based Solutions in Flood Risk Management – Buzzword or Innovation?” Journal of Flood Risk Management 10 (3): 281–282.10.1111/jfr3.2017.10.issue-3
- Susdrain. 2015. Benefits of SuDS Tool (BeST).
- Syme, W. J. 2008. “Flooding in Urban Areas-2D Modelling Approaches for Buildings and Fences.” 9th National Conference on Hydraulics in Water Engineering: Hydraulics 2008 25.
- UNFAO (United Nations Food & Agriculture Organization). 2016. “Irrigation Water Management.” Annex 2 Infiltration Rate and Infiltration Rate. http://www.fao.org/docrep/s8684E/s8684e0a.htm
- University of Exeter. 2016. “CADDIES Framework.” emps.exeter.ac.uk/engineering/research/cws/resources/caddies-framework/.
- USGS (United States Geological Society). 1989. “Guide for Selecting Manning’s Roughness Coefficients for Natural Channels and Flood Plains.” USGS Water-Supply Paper 2339.
- Weng, Q. 2001. “Modelling Urban Growth Effects on Surface Runoff with the Integration of Remote Sensing and GIS.” Environmental Management 28 (6): 737–748.10.1007/s002670010258
- Young, K. D., T. Younos, R. L. Dymond, D. F. Kibler, and D. H. Lee. 2010. “Application of the Analytic Hierarchy Process for Selecting and Modelling Surface Water Best Management Practices.” J Contemp Water Res Educ 146 (1): 50–63.10.1111/jcwr.2010.146.issue-1