
 ?Mathematical formulae have been encoded as MathML and are displayed in this HTML version using MathJax in order to improve their display. Uncheck the box to turn MathJax off. This feature requires Javascript. Click on a formula to zoom.
ABSTRACT
It is necessary to understand Sustainable urban Drainage Systems (SuDS) sediment retention efficiencies to fully comprehend SuDS pollution removal properties and urban sediment movement from source-to sink. This research presents the detention and transport of a single tagged sediment release through four SuDS devices over 12 months, with the aim of quasi-quantifying these selected SuDS devices sediment detention efficiencies. Field monitoring and mass balance analysis of deposited sediment shows that tagged sediment from the single sediment release moves through the monitored SuDS, with deposition declining over the 12-month monitoring period. Initial retention is high (>80% during the first week of monitoring) but falls below 80% after multiple consecutive rainfall-runoff events (events ≤50% ARI). The field monitoring illustrates retention to generally remain above 50%, suggesting that SuDS are highly efficient at retaining urban sediment pollution but that deposition of a single sediment release may resuspend due to cumulative rainfall-runoff events.
1. Introduction
Field or physically based studies often consider the deposition and retention of sediment within Sustainable urban Drainage Systems (SuDS) devices over multiple rainfall-runoff events (International BMP database, Citation2016). Fewer studies have analysed or quantified the cumulative, sequential rainfall-runoff influence on the deposition of a single release of urban sediment within SuDS devices. Once deposited, sediment within SuDS devices are either permanently retained (retention) or resuspended and conveyed (temporarily detained). Published studies consider urban sediment deposition in ponds and wetlands with perennial flow (Krishnappan and Marsalek Citation2002; Heal Citation2000; Heal, Hepburn, and Lunn Citation2006; McNett and Hunt Citation2011; Merriman and Hunt Citation2014; Yousef et al. Citation1994) while others (e.g. Deletic Citation2005; Barrett et al. Citation1998; Nara and Pitt Citation2005) analysed sediment retention of ephemerally flowing filter strips and swales. The temporal focus of published studies has been individual flow events (i.e. multiple individual flow event analysis); or longer-term studies where detention or retention of total sediment load (total, cumulative influx and retention of sediment) and mitigation of total suspended solids (TSS, indicating deposition) is the focus. The retention and conveyance of an individual (i.e. tagged) sediment release over cumulative, multiple, sequential rainfall-runoff flows have been less frequently calculated due to the difficulty in defining the quantity of sediment deposited and retained form individual sediment influx events (e.g. Merriman and Hunt Citation2014; Allen Citation2017).
There is a wide range of field and laboratory data describing the change in stormwater quality due to SuDS implementation (Krishnappan and Marsalek Citation2002). This study aims to supplement this dataset by providing a single sediment release deposition trend through field monitored SuDS. Uncertainty exists in the quantification of urban sediment deposition within SuDS devices (Taylor and Owens, Citation2009; Heal, Hepburn, and Lunn Citation2006). Local authority guidelines and design guidance provide an indication of expected or acceptable water quality improvement. Within the UK, the reference focus of this study, the guidance is generally focused on a single design rainfall-runoff event with an event mean concentration; for example the UK SuDS Manual suggests Total Suspended Solid (TSS) improvement by swale: 50–60%; linear wetland: 75–85%; wetland: 80–82%; pond: 75–80% (Woods Ballard et al. Citation2015). Internationally, SuDS device achievements are considered over extended periods (greater than 12 months) thus incorporating the deposition and resuspension due to multiple rainfall-runoff events (e.g. USA, Australia SuDS guidance and analysis (Caltrans Citation2015; Department of Environment Citation2004)). Solute pollution change or water quality improvement provided by SuDS is well understood and reflected in current design guidance (Water by Design Citation2014; Woods Ballard et al., Citation2015). Within the UK, while this information is generally compiled from single event monitoring and analysis, they are often assumed to represent longer-term SuDS sediment removal efficiency. The international long-term monitoring and analysis of SuDS presents a positive example of best practice which the UK may follow in future.
This research aims to quasi-quantify the sediment the retention of a single sediment release in SuDS devices over 12 months (past the initiating sediment influx rainfall-runoff event). Key to examining this short-term (12 month) sediment retention is the identification of whether tagged sediment is retained permanently or detained and conveyed within SuDS devices after initial deposition. For the purposes of this study fine sediment (monitored tagged sediment) is defined as urban sediment <2 mm, d50 ~ 63–150 µm and density ~2600–2780 kg/m3; this is a typical urban particle size distribution (Zanders Citation2005). To define a single sediment release deposition and retention within the monitored SuDS devices over cumulative, consecutive rainfall-runoff events a sediment tracer methodology was used.
2. Methods
Four SuDS device designs (wetland, linear wetland, swale and pond) were selected for the focus of this study. Each SuDS device was considered in isolation. A fine sediment tracer methodology using rare earth oxides (REO) (described in Allen et al. Citation2015, Allen Citation2017) was employed at selected established SuDS device field sites to allow the natural movement of urban sediment to be recorded in conjunction with rainfall, flow characteristics and mass deposition within monitored SuDS.
2.1. The field sites
The selected established SuDS devices, located in Bathgate, Scotland and Newcastle, England, were monitored for 12 months. These SuDS were chosen due to access, establishment and collection of urban runoff from residential and commercial urbanised development. The rainfall and flow characteristics were continuously monitored at all SuDS locations for the total monitoring duration using Tempcon RG3-M rain gauges and Greyline Stingray depth velocity meters. (and Appendix 1) present the SuDS device characteristics.
To calculate a general representation of flow, cross section survey was completed at the location of the depth velocity monitor placement and flow was calculated using standard depth-velocity-area equation, taking into consideration vegetation (Mannings ‘n’) (similar methodology used by Stevens and Ogunyoye Citation2012; Heal Citation2000; Kadlec Citation1990; the ultrasonic method described in Caltrans Guidance Manual: Stormwater Monitoring Protocols (Citation2000) (details provided in Allen Citation2017)).
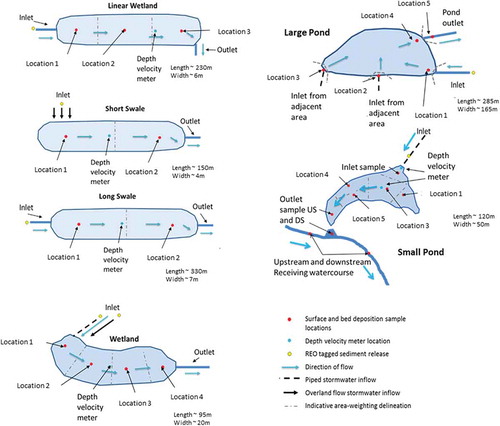
Indicative areas (described in table of Appendix 1) reflect the spatial extent of each SuDS device represented by each sediment deposition monitoring location. It is acknowledged that this presents an indication rather than a definitive quantification but due to the nature of the experiments (ongoing movement of tagged sediment over multiple, consecutive rainfall-runoff events) sampling of the total tagged sediment deposition in the SuDS devices was not possible.
2.2. Sediment conveyance and deposition monitoring
Fine sediment loading on the contributing catchment surfaces was sampled (road and car park). 1 m2 area of each representative road and car park surface within each contributing catchment was sampled (sampling occurred 48 hrs after rainfall-runoff) following vacuum sampling methodology described in Vase, Francis, and Chiew (Citation2002) and Egodawatta and Goonetilleke (Citation2006). Sampling was undertaken in triplicate. The vacuum sampling was completed prior to tagged sediment release to provide existing sediment characterisation (particle size distribution presented in Appendix 7). This provided a representation of site specific urban sediment loading and characterisation, but it is acknowledged that the loading is not necessarily representative of the wash-off. An equivalent of a 1 × 1 m2 surface area (comprised of four 0.25 × 0.25 m2 samples) was vacuum sampled each month after tagged sediment release. The quantity of tagged sediment in each vacuum sample was analysed to provide a representation of the tagged sediment remaining on the urban surface (not transported by rainfall-runoff wash-off). By comparing the known quantity of tagged sediment initially released to that remaining on the urban surface, quasi-quantification of the amount of tagged sediment entering the SuDS devices was possible (total tagged sediment initially released ̴ tagged sediment remaining on the surface + tagged sediment influx into the SuDS device).
The quantity of tagged sediment in suspension and depositing within the SuDS devices were monitored fortnightly (monthly for the small pond due to access) to provide a time-stepped dataset indicating sediment deposition over the 12 month period. Sampling was completed to allow a fortnightly mass balance of sediment deposited rather than rainfall-runoff event specific calculations. Fixed sample points, time-stepped sampling methodology has been illustrated by McCarthy et al. (Citation2017) to be more effective in presenting SuDS pollutant removal efficiency than grab samples or random sampling, but less so than runoff volume proportional sampling (Caltrans Citation2015). Stormwater (collected at the surface) and sediment deposition samples were collected from fixed locations throughout the monitoring period, at locations central to the representative SuDS device area (indicative area weighting illustrated in , Appendix 1). Surface samples were collected to allow simple mass balance analysis of tagged sediment in the SuDS device at the specific time of bed deposition sampling. It is acknowledged that sediment deposition may be laterally inconsistent, however due to the physical limitations of this study lateral or composite sampling was not possible. Central thalweg sample locations have therefore been used to provide a representation of SuDS device tagged sediment retention. Surface flow samples were collected from directly above the bed sampling locations using an ISCO 3700 sampler (10 mm diameter sample hoses anchored to fixed positions for the duration of the monitoring period, Appendix 4 (Allen Citation2017)).
Figure 1. Schematic diagrams of established, field monitored SuDS. A linear wetland, within the Scottish contest, is a large swale densely vegetated with wetland plants but without permanent ponding areas provided within a wetland or wetland flow depth. Note that sampling intern deposition across the large pond was not possible due to pond depth and health and safety regulations. The large pond deposition is estimated using sample points 1 and 4 (in the pond), 5, within the outlet flow path and known inflows (inlet, samples 2 and 3).
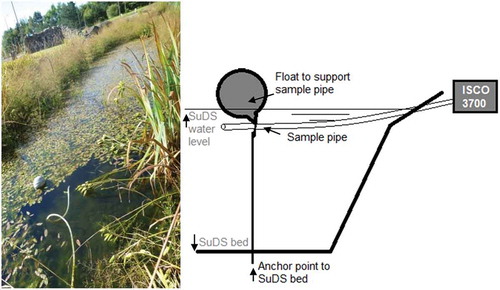
Surface flow, indicative of tagged suspended sediment quantity, was sampled from the swales and linear wetland when flow depth ≥20 mm to insure sample integrity. 500 ml samples were collected at marked locations from the upper 20 mm of flow for a period of 60 seconds. Surface flow of equivalent volume was sampled from wetland and pond SuDS devices (Appendix 4). Sampling hoses were attached to anchored floats within these SuDS devices to ensure consistency in sampling location. Surface flow tagged suspended sediment was monitored to provide a snap-shot visualisation of tagged total suspended solid (TSS) quantity within the SuDS and to enable more accurate accounting of the total (mass balance) of tagged sediment.
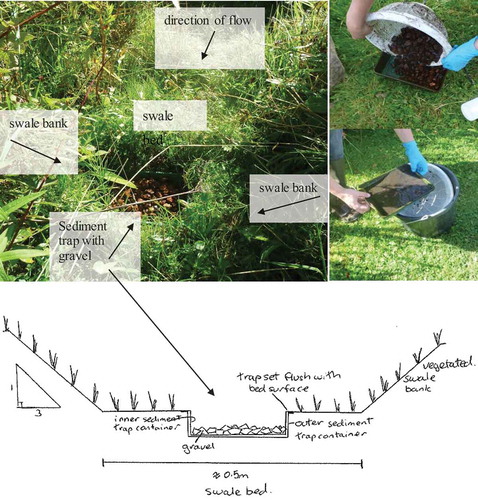
Bed deposition was sampled using sediment traps located flush with the SuDS device bed surface (Appendix 5). Each sediment trap was comprised of two 300 × 200 mm 5L containers, a static underlying plastic box installed to limit disturbance during sample retrieval, and an inner plastic box (the sediment trap) weighted with 500 g of 100 mm diameter gravel, designed similar to Kayanian et al. (Citation2012) and Lawler (Citation2006). The inner box was retrieved fortnightly (monthly in the small pond) and collected sediment removed for analysis. The cleaned inner box was replaced within the static anchored outer box. Limited localised resuspension occurred on replacement of the inner box, and after 15 minutes no visible sediment accumulation was noted.
Core sampling, similar to IAEA (Citation2003) and Fraley (Citation2004), was completed adjacent to the bed sediment traps. Core samples (50 mm diameter, maximum 100 mm depth) were collected from unique locations within a 1 m radius adjacent to the bed sediment trap to define the rare earth oxide (REO) tagged sediment deposition. No location was repeatedly sampled. Coring frequency corresponded directly with the bed load sampling.
For all samples, sediment from the urban surface (tagged sediment release) was differentiated from underlying or native soil sediment using the REO tag chemical signature (Allen et al. Citation2015). The focus of this study was to monitor sediment deposition and movement and the use of REO tagging allowed for this differentiation.
Fine urban sediment particle size distribution is noted to have a significant proportion of clay and silt (≥50% particle size ≤ 63 µm) (Selbig et al. Citation2016; Drapper Citation2014) and may therefore include a proportion of cohesive particulates (material ≤ 63 µm) (Berlamont et al. Citation1993). The focus of this field research was to consider total tagged sediment deposition and movement, both individual particles and cohesive (flocculated) particulates. It is acknowledged that occurrence and cohesion of fine sediment plays an important part in the deposition and transport of fine urban sediment pollution. However, the depth of detail available from the field experiment was limited to total tagged sediment retention and thus cohesive sediment was not explicitly considered.
2.3. The fine sediment tracer
A fine sediment tracer methodology using rare earth oxides (REO) was implemented in this study. This method has been piloted in a swale test case (Allen et al. Citation2015) and previously used in agricultural erosion and sediment transport studies (Zhang et al. Citation2001, Citation2003; Polyakov and Nearing Citation2004; Deasy and Quinton Citation2010).
REOs were selected for urban fine sediment monitoring due to their provision of the following key criteria, supporting extended field monitoring of sediment transport or settling within each of the monitored SuDS devices:
Persistence – sediment supplied to the upstream boundary should be tagged via a conservative tracer persisting (adsorbed to the sediment) over a range of spatial (m-km scale) and temporal (up to 12 month) scales.
Non-toxic – as the blue-green drainage network has environmental value and importance, the tracer must result in no detrimental impact on the receiving environment.
Particle characteristics – the tracer must be effective in mimicking natural sediment movement; hence, particle size, grain size distribution and density must be considered.
Multiple signatures – several unique forms of tracer must be available to enable the monitoring of individual sediment releases (time-lapse repetitions and source-specific identifiers) within the same receiving SuDS.
Fine sediment, the equivalent of approximately 1/12th of the annual urban sediment load (Haster and James Citation1994; Taylor and Owens Citation2009; Egodawatta and Goonetilleke Citation2006) and representative in particle size distribution to site specific surface samples, was tagged (10 g REO/1 kg clean sediment) and released onto the contributing catchments impervious urban surfaces. Unique REOs, providing individual signatures, were used for each release to allow repetition of the sediment monitoring experiment without loss of integrity (e.g. delineation between deposited sediment from release 1 and release 3 at a single sample point). Tagging was undertaken following the methodology described in Kimoto, Nearing, Shipitalo, and Polyakov (Citation2006), Polyakov et al. (Citation2009), Allen et al. (Citation2016) and Zhang et al. (Citation2001), using clean sieved sediment and adsorption of selected REO tracer through a cycle of wetting and drying.
Tagged sediment was released over selected impervious contributing catchment areas directly adjacent to the relative SuDS devices and was evenly distributed using sieving and grid spaced quantity release (i.e. a selected kg/m2 REO tagged sediment released consistently across the contributing catchment area). The pathway for sediment movement between release surface and SuDS device was direct, either through overland flow (into swales and wetland) or through piped/channel conveyance (ponds, linear wetland). No pre-treatment measures existed for the monitored SuDS devices. The tagged sediment was then monitored through suspended sediment and bed deposition sampling. REO tags allow the quantity of tagged sediment material within each suspended and bed deposition sample to be quantified using Inductively Coupled Plasma Mass Spectrometry (ICPMS). Samples were prepared for ICPMS analysis in accordance with Allen et al. (Citation2015, Citation2017), using strong acid digestion and filtration prior to analysis using an Agilent 7500ce ICMPS. ICPMS analysis of each flow and bed deposition sample provided unique REO tracer signatures (indication of occurrence and quantity within the sample). The quantity of tagged sediment was then calculated using the known REO:tagged sediment ratio used for released tagged sediment. REO characterisation and ICPMS detection limits are presented in Appendix 2 and 3.
2.4. Simple mass balance calculation methodology for quasi-quantification of REO tagged fine sediment deposition and retention
A simple mass balance analysis (Equation 1) was used to identify the overall change in tagged sediment retention over time.
Where:
| Cin = | = | total mass of tagged sediment entering the SuDS; |
| Clost = | = | the total mass of tagged sediment unaccounted for in tagged sediment monitoring; |
| Cdetained = | = | total tagged sediment detained in the SuDS; |
| Cenriched = | = | enrichment of REO trace on tagged sediment (increase in REO tag, reported as a maximum of 4% by concentration); |
| Cdegraded = | = | loss of REO trace on tagged sediment (decrease of REO on sediment due to environmental conditions, reported as a maximum of 4% by concentration); |
| Cout = | = | total tagged sediment discharged from the SuDS. |
C is the total mass of tagged sediment (in suspension at the time of sampling (TSS, g/ml) and deposited (g/m2)). As expected, background levels of REO in all SuDS devices were below detection (<1 ppt, Appendix 3). REO enrichment of sediment is low, reported up to 4%, due to the strong adsorption to fine particles and no significant bias (up to 4% error) or redistribution of REO within the suspended – 2 mm particle size range (Kimoto et al. Citation2006; Zhang et al. Citation2003; Deasy and Quinton Citation2010; Polyakov and Nearing Citation2004). The simple mass balance was calculated for every sample time step. For each sample (e.g. week 2, 4, 6, …) the total quantity of tagged sediment entering into, deposited within and detained in suspension was quantified and an estimation of retention was made.
Sample locations were considered representative of a respective cell of each SuDS device (identified by the indicative area-weighting delineation in ). The total REO tagged sediment deposited or in suspension within each of the SuDS devices was calculated. This provided a time-stepped total SuDS device tagged sediment retention, allowing temporal analysis of SuDS specific tagged sediment conveyance or retention. The REO tracer experiment was repeated 4 times, at 3 month intervals, for each SuDS device to ensure that any trends identified were consistent (rather than an isolated environmental or anthropically influenced occurrences).
For each SuDS device the amount of tagged sediment (deposited and in suspension at the time of sampling) was compared to: the rainfall (total rainfall since release, rainfall since the last sample period, characteristics of the rainfall including number of rainfall events occurring); flow velocity and depth (average, minimum, maximum and event occurrence for the previous two weeks and total monitoring period); corresponding discharge; and the antecedent dry days (prior to sampling, over the previous two weeks and cumulatively since monitoring commencement). The fortnightly and total tagged sediment retained in the SuDS devices were correlated against these rainfall-runoff characteristics to identify possible drivers or correlating occurrences that might help explain the tagged sediment retention and movement. Analysis was completed in R Studio. The strongest correlations, with significant p-values (p-value <0.05) were included in regression analysis to examine if the rainfall-runoff characteristics could effectively represent or explain the tagged sediment retention and movement (rainfall characteristics presented in Appendix 8, Allen Citation2017).
3. Results and discussion
The tagged sediment mass balance retention results for each time step for all monitored SuDS devices have been presented in . In conjunction with the four releases, the average trend is presented (black points) and the respective cumulative rainfall (lines coloured respectively). In conjunction with the mass balance retention, values of the preferential fortnightly tagged sediment deposition locations are presented (as a percentage of tagged deposited sediment) for each SuDS device.
3.1. Wetland REO tagged sediment retention
Tagged fine sediment retention of a single sediment release was illustrated to decline over multiple events through the monitored wetland ()). The initial temporary retention efficiency, week 0–2, was high (≥90% of the supply) with >80% sediment retention efficiency for the first 15 weeks (average). Over 52 weeks, the tagged sediment retention efficiency of the wetland was found to fall between 73% and 27% of the total tagged sediment inflow. While there is variation in monitored results (≤29%, standard error ≤10%) all data show a gradual decrease in deposition or retention of tagged material over multiple events.
Figure 2. SuDS device REO tagged sediment retention curves (from mass balance calculations and field monitoring) and preferential fortnightly deposition locations (as a representation of total tagged sediment deposition).
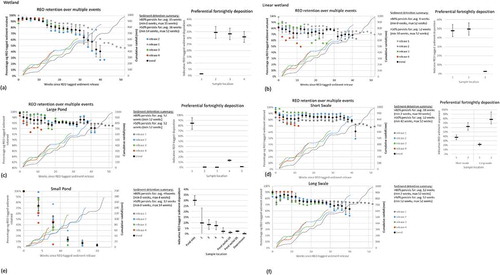
The variation between results (comparison of release 1, 2, 3 and 4 results) may be primarily due to rainfall occurrence. Strong correlation was found between tagged sediment retention within the wetland and temporal rainfall and flow characteristics: the cumulative number of rainfall events; rainfall quantity; duration and period of antecedent dry days (ADD); average monitoring period flow depth; velocity and discharge (m3/s) (correlation values of ≥ ±0.8, p-value <0.01). The cumulative impact of multiple rainfall events showed a stronger influence on tagged sediment retention in the wetland than the most recent rainfall-runoff events suggesting cumulative rainfall and multiple events may be more important in tagged sediment deposition than the last event prior to sampling. Simple linear regression analysis suggests that the decline (and variation) in wetland tagged sediment retention may be a function of: cumulative number of rainfall events, rainfall depth, rainfall duration, ADD and the cumulative number of hydrograph peaks recorded within the wetland flow (r2 < 0.8, p-values <0.01).
Tagged sediment deposition and retention occurs across all cells of the wetland, with lower deposition close to the inlet. This is most likely due to sampling from a zone of significant fluid mixing where turbulent shear stresses are sufficiently high so as to keep fine tagged material in suspension, thus precluding deposition into the bed. Location 2 shows the highest sediment deposition results, with locations 2, 3 and 4 performing comparably (slight decrease moving downstream) in terms of tagged sediment detention, suggesting that within this wetland shear stress was relatively uniform away from the inlet. The higher deposition at location 2, 3 and 4 may also be due to flocculation of cohesive material occurring along the wetland flow path, resulting in greater tagged sediment material settling within the latter wetland extent. It may also be a result of the increased residency time within the wetland at the downstream locations. Deposition results suggest the incorporation of multiple cells in a wetland design helps achieve greater wetland potential retention efficiency. These results are dissimilar to those reported by Hathaway and Hunt (Citation2009) where wetland ‘cell 1’ was reported to detain approximately 80% of sediment. The Piedmont wetland study illustrated sediment to be primarily detained within the first cell (a total wetland) with the following total wetlands (identified as cell 2 and 3) detaining less than 20% of monitored sediment. Therefore, while multiple consecutive wetlands (as discussed in the Piedmont study by Hathaway and Hunt (Citation2009)) may not provide significant sediment detention benefit, the result of this study suggests multiple cells within a single wetland may be beneficial.
3.2. Linear wetland REO tagged sediment retention
The initial tagged sediment retention in the linear wetland was >90%, 80% of tagged sediment was retained (on average) after 4 weeks with the average linear wetland results achieving tagged sediment retention efficiency >50% for the 12 month monitored period ()). The linear wetland results show variance in deposition over the total monitoring period (≤28%, standard error ≤10%) but with all release datasets illustrating a declining retention trend. The overall declining tagged sediment detention trend is smaller within the linear wetland compared to wetland results, however the decline appears to be continual over the monitored period. The linear wetland differs from the wetland in that it contains no significant open water elements in its design. The greater sediment detention in the linear wetland may be a result of the vegetation density across the entire linear wetland with this vegetation acting as a major sediment trapping mechanism.
Correlation analysis of rainfall and runoff characteristics relative to the linear wetland presented a complex dataset. Unlike the wetland, the linear wetland tagged sediment retention results do not show any strong correlation results to any individual factors, but multiple moderate (0.5 ≥ r ≤ 0.8, p-value <0.05) correlating factors. This moderate, more complex correlation result may be due to high roughness within the asset mitigating flow velocity and shear stress on (re)suspension or deposited tagged sediment movement. Simple regression analysis of the rainfall and runoff factors suggests linear wetland tagged sediment retention decline (and variation) to: cumulative number of rainfall events, rainfall duration, flow depth (average and maximum), flow velocity, calculate Froude and Reynolds numbers (Fr and Re) (r2 < 0.5, p-values <0.05) (i.e. the turbulence and flow energy occurring within this SuDS device).
Tagged fine sediment was found to deposit across the entire linear wetland, indicating its transport to and through the linear wetland over multiple rainfall-runoff events. The greatest tagged sediment deposition occurred at the linear wetland inlet and central sections, decreasing at the linear wetland outlet. Tagged sediment deposition in the early section of the linear wetland may be due to aggregated floc particulates, allowing the finer sediment fraction to settle (after aggregation or coalescence) in the moderately turbulent inlet location (cohesion influence on deposition has been seen in estuarine environs (McAnally and Mehta Citation2002) and wetland and urban runoff controls (Sholz Citation2006)). The linear wetland appears to maximise tagged sediment detention through the use of dense and emergent vegetation growth. This vegetation appears to actively filter particles, lower flow velocity and minimise the quantity of tagged sediment reaching the linear wetland discharge point.
3.3. Swale REO tagged sediment retention
Tagged sediment moved through both monitored swales over multiple rainfall-runoff events resulting in a decline in tagged sediment retention over the 1 year monitoring period ((d–f)). In the short swale ()), sediment retention is noted to decline most in the initial 10 weeks and final weeks (week 34 onwards). The long swale ()) initially shows a shallow decline in tagged sediment retention efficiency, with retention >80% over the first 12 weeks (average). Sediment retention was noted to decline after this initial period, with retention <80% for all REO tagged sediment experiments (release 1–4) after week 16, but with >50% retention at the end of the monitoring period (52 weeks). The short swale shows a similar retention efficiency, retention >50% across the monitored 52 weeks. Overall, the initial tagged sediment retention efficiency of the swales, week 0–2, was high – greater than 80%, followed by a general shallow decline over cumulative rainfall-runoff events.
The long and short swales both illustrate strong (r ≥ ±0.8, p-value <0.01) correlations to rainfall and runoff factors. The short swale tagged sediment retention correlated most strongly to rainfall intensity and the cumulative number of hydrograph peaks; long swale results strongly correlated with cumulative number of rainfall events, event duration, maximum rainfall, ADD and flow velocity trends (r ≥ ±0.8, p-value <0.01). Regression analysis of swale rainfall-runoff factors highlighted: cumulative rainfall events, event duration, total rainfall depth, duration, ADD, flow velocity, Fr and Re to be informative in describing sediment retention (r2 ≤ 0.8, p-values <0.01).
Sediment retention occurred at all monitored locations within the swales, with notable deposition in the latter reach of the swales (short and long swale location 2). The monitored swale retention efficiency results suggest tagged sediment deposition to increase moving downstream through the swale. This is contrary to the findings of Nara and Pitt (Citation2005) who noted declining TSS moving downstream through a swale (and therefore greater deposition or detention upstream) and Barrett Walsh, Malina, and Charbeneau (Citation1998) who noted TSS to be relatively consistent along the swale length. The increase in tagged sediment deposition may occur due to swale design and the potentially cohesive properties of fine urban sediment (greater cohesion and therefore deposition with greater residency time in the swale and therefore deposition further downstream in the swale). Long swale vegetation is less dense and shorter (mown grass) than the short swale (moderately grassed swale with mixed shrub vegetation planted within the flow path) and this may explain the more notable difference between upstream and downstream tagged sediment deposition seen in this long swale (similar to vegetation density finding for a wetland by Hernandez-Crespo et al. Citation2017). The short swale potentially provides greater flow resistance and higher retention potential due to its design and planting (therefore closer upstream and downstream deposition results). It is also noted that both swales have limited maintenance, and the long swale especially has limited vegetation density within the main flow path. Both swales also have discharge points that are on an angle (>45 degrees) so have the potential, during high flow periods, to undergo backup/back-flooding and therefore have an elevated downstream boundary condition that may support higher tagged sediment deposition at the downstream sections of these swales. The long swale is also greater than twice the length of the short swale, providing a longer flow path over which to retain and allow aggregation of tagged sediment. The design of the swale, both vegetation density and flow path length, may be significant influential factors in their short-term tagged sediment retention.
3.4. Pond REO tagged sediment retention
Tagged sediment retention efficiency of the small pond ()) is initially functional (≥20%, but <80%) but declines significantly over multiple events (week 8 onwards) to below 20%. The pond surface: contributing catchment area ratio is 1:125 m2 ((substantially greater than the large pond). Tagged sediment retention results suggest this pond may be undersized if the findings of this short-term tagged sediment retention are considered indicative of total sediment movement. The outlet design uses a porous media (rock gabion) uncontrolled outflow. It is suggested that fine sediment may pass through this form of outlet easily (visually observed at this site), potentially allowing tagged fine sediment to be conveyed to the downstream waterway without significant intervention.
The large pond shows high retention (all results >80%) but indicates a slow decline over the monitoring period (3% decline after 12 months) ()). This pond is significant in size and volume (16,240 m2 surface area, 1:20 m2 ratio of pond surface to contributing catchment area); negligible sediment was expected to pass through this pond (photographs provided in Appendix 6). The small decline in sediment retention efficiency is consistent in all experimental repetitions. This suggests this large SuDS pond to be highly efficient in tagged sediment retention.
Correlation and simple linear regression analysis suggests the small SuDS pond tagged sediment retention over monitoring period correlates with both intermediate (between sample time steps, i.e. 2 weeks for the large pond, 4 weeks for the small pond) and cumulative rainfall-runoff characteristics. Rainfall-runoff characteristics showing strong (r ≥ ±0.8, p-value <0.01) correlation to pond retention results include: intermediate rainfall total, cumulative rainfall intensity, duration and number of events, Re, flow discharge and the cumulative number of hydrograph peaks.
The large pond’s internal tagged sediment deposition pattern was not sampled in detail due to access (pond depth >1.0 m) but comparison of tagged sediment deposition near the inlet and outlet of the pond illustrates a decline in tagged sediment deposition. Minimal tagged sediment was found to deposit downstream of the pond (location 5) suggesting limited tagged sediment conveyance through the pond. Preferential tagged sediment deposition within the small pond occurred at the inlet and open water sections (location 3). This pond does not rely on vegetation to detain or filter sediment but on residency time, flocculation through mixing and boundary effect sediment settling. Tagged sediment deposition is noted to decline through the pond, along the pond flow path, resulting in lower deposition adjacent to the pond outlet (pond outlet US).
4. Conclusions
An REO tracer methodology and tagged sediment dataset have been used to identify a single sediment release movement through four monitored SuDS devices over a 12 month monitoring period. Initial tagged sediment retention was high, >80% for all monitored devices. Short-term results show a shallow declining trend in tagged sediment retention, suggesting that cumulative rainfall-runoff may influence the deposition, movement and potentially retention of tagged sediment from this single release within these monitored SuDS devices.
Fassman (Citation2012) found bioretention and grass swales to be the most effective TSS removal SuDS devices (60–90% TSS removal for events), followed by constructed wetland and detention basins (comparative to pond function). The tagged sediment monitoring aligns with these results, suggesting the linear wetland and swales to show a deposition trend >60% after 12 months (with exception of the large pond). The initial detention (>80%) of tagged sediment in the monitored SuDS supports published findings of high sediment mitigation by SuDS devices, while the final monitored tagged sediment detention (>50% with exception of the small pond) generally aligns within multiple event mean concentration and deposition results (Fassman Citation2010, Heal, Hepburn, and Lunn Citation2006). The correlation and regression analysis suggest the number of rainfall events (cumulative), ADD and total rainfall occurring are key meteorological factors in understanding the tagged sediment deposition and movement, similar to findings in Brodie and Dunns’ (Citation2010) review of rainfall characteristics on TSS wash-off concentrations from urban surfaces.
The purpose of this study was to increase the understanding of sediment deposition of a single sediment release through four selected SuDS devices. It is acknowledged that the tagged sediment retention trends are not indicative of total sediment retention over the long-term. The study does highlight the influence of cumulative rainfall-runoff events on the deposition of a single (tagged) sediment release, suggesting that the tagged sediment deposition is not static after the initial influx but potentially moves (to some degree) within and through the monitored SuDS devices.
Disclosure statement
No potential conflict of interest was reported by the authors.
Additional information
Funding
References
- Adachi, K. and Tainosho, Y. 2004. “Characterization of heavy metal particles embedded in tire dust.” Environment International 30: 1009–1017. doi:10.1016/j.envint.2004.04.004.
- Allen, D. 2017 “Beyond the design event: Sediment pollution movement in SuDS,” unpublished thesis, Heriot Watt University, Edinburgh (unpublished thesis).
- Allen, D., Olive, V., Arthur, S. and Haynes, H. 2015. “Urban Sediment Transport through an Established Vegetated Swale: Long Term Treatment Efficiencies and Deposition.” Water 7: 1046–1067. doi:10.3390/w7031046.
- Allen, D., V. Olive, H. Haynes, and H. Arthur. 2016. “Multiple Rainfall Event Pollution Transport by Sustainable Drainage Systems: The Fate of Fine Sediment Pollution.” International Journal of Environmental Science and Technology 14 (3): 639–652. doi:10.1007/s13762-016-1177-y.
- Barrett, M., P. Walsh, J. Malina, and R. Charbeneau. 1998. “Performance of Vegetative Controls for Treating Highway Runoff.” Journal of Environmental Engineering 124 (11): 1121–1128. doi:10.1061/(ASCE)0733-9372(1998)124:11(1121).
- Berlamont, J., Ockenden, M., Toorman, E. and Winterwerp, J. 1993. “The Characterisation of Cohesive Sediment Properties.” Coastal Engineering 21: 105–128. doi:10.1016/0378-3839(93)90047-C.
- Brodie, I. M., and O. K. Dunn. 2010. “Commonality of Rainfall Variables Influencing Suspended Solids Concentrations in Storm Runoff from Three Different Urban Impervious Surfaces.” Journal of Hydrology 387: 202–211. doi:10.1016/j.jhydrol.2010.04.008.
- Caltrans. 2015. Caltrans Guidance Manual: Stormwater Monitoring Protocols. USA: State of California Department of Transportation.
- Deasy, C., and J. N. Quinton. 2010. “Use of Rare Earth Oxides as Hillslope Sediment Tracers.” Soil Earth 2: 195–212.
- Deletic, A. 2005. “Sediment Transport in Urban Runoff over Grassed Areas.” Journal of Hydrology 301: 108–122. doi:10.1016/j.jhydrol.2004.06.023.
- Department of Environment. 2004. Stormwater Management Manual for Western Australia. Perth, Western Australia: Department of Environment.
- Drapper, D. 2014. Particle Size Distribution of Urban runoff-Australia Vs International: Ten Years On, Stormwater 2014. Adelaide.
- Egodawatta, P., and A. Goonetilleke 2006. “Characteristics of Pollution Build-Up on Residential Road Surfaces.” Proceedings of 7th International conference on hydroscience and engineering, Philadelphia, PA.
- Fassman, E. 2010. “Urban Runoff Mitigation by Permeable Pavement System over Impermeable Soils.” Journal of Hydrologic Engineering, 15 (6). doi: 10/1061/(ASCE)HE.1943-5584.0000238.
- Fassman, E. 2012. “Stormwater BMP Treatment Performance Variability for Sediment and heavy Metals.” Separation and Purification Technology,84. doi: 10.1016/j.seppur.2011.06.033.
- Fraley, L. 2004. Methods of Measuring Fluvial Sediment, Centre for Urban Environmental Research and Education. USA: University of Maryland.
- Haster, T. W., and W. P. James. 1994. “Predicting Sediment Yield in Storm-Water Runoff from Urban Areas.” Journal of Water Resources Planning and Management 120: 630–650. doi:10.1061/(ASCE)0733-9496(1994)120:5(630).
- Hathaway, J. M., and W. F. Hunt. 2009. “Evaluation of Storm-Water Wetlands in Series in Piedmont North Carolina.” Journal of Environmental Engineering 136: 140–146. doi:10.1061/(ASCE)EE.1943-7870.0000130.
- Heal, K. 2000. “Sediment quality in sustainable urban drainage structures in Scotland.” Proceedings of SUDS Monitoring Workshop, 26 January 2000, Edinburgh University, Scotland.
- Heal, K., D. Hepburn, and R. Lunn. 2006. “Sediment Management in Sustainable Urban Drainage System Ponds.” Water Science and Technology 53 (10): 216–227. doi:10.2166/wst.2006.315.
- Henderson, P. 1984. “General geochemical properties and abundances of the rare earth elements.” In Rare earth element geochemistry 2(1): 32. Amsterdam: Elsevier.
- Hernandez-Crespo. C, S. Gargallo, V. Benedito-Durá, B. Nácher-Rodríguez, M. A. Rodrigo-Alacreu, and M. Martín. 2017. “Performance of Surface and Subsurface Flow Constructed Wetlands Treating Eutrophic Waters.” Science of the Total Environment 595: 584–593 doi:10.1016/j.scitotenv.2017.03.278.
- IAEA. 2003. Collection and Preparation of Bottom Sediment Samples for Analysis or Radionuclides and Trace Elements. Vienna: IAEA. ISBN 92-0-109003-X.
- International Stormwater BMP Database. 2016 Version 2016 11 17, Developed by Wright Water Engineers, Inc. and Geosyntec Consultants for the Water Environment Research Foundation (WERF), the American Society of Civil Engineers (ASCE)/Environmental and Water Resources Institute (EWRI), the American Public Works Association (APWA), the Federal Highway Administration (FHWA), and U.S. Environmental Protection Agency (EPA), accessed May 23 2018. www.bmpdatabase.org.
- Kadlec, R. 1990. “Overland Flow in Wetlands: Vegetation Resistance.” Journal of Hydraulic Engineering 116 (5): 691. doi:10.1061/(ASCE)0733-9429(1990)116:5(691).
- Kayhanian, M., E. R McKenzie, J. E. Leatherbarrow, and T. M. Young. 2012. “Characteristics of Road Sediment Fractionated Particles Captured from Paved Surfaces, Surface Runoff and Detention Basins.” The Science of the Total Environment 439: 172–186. doi:10.1016/j.scitotenv.2012.08.077.
- Kimoto, A. A. Nearing, M. J. Shipitalo, and V. O. Polyakov. 2006. “Multi-Year Tracking of Sediment Sources in a Small Agricultural Watershed Using Rare Earth Elements.” Earth Surf Proceedings Land 31 (14): 1763–1774. DOI:10.1002/esp.1355.
- Krishnappan, B. G., and J. Marsalek. 2002. “Modelling of Flocculation and Transport of Cohesive Sediment from an On-Stream Stormwater Detention Pond.” Water Research 36: 3849–3859.
- Lawler, D. M. 2006. “The Measurement of River Ban Erosion and Lateral Channel Change: A Review.” Earth Surface Processes and Landforms 18 (9): 777–821. doi:10.1002/esp.3290180905.
- McAnally, W. H., and A. J. Mehta. 2002. “Significant of Aggregation of Fine Sediment Particles in Their Deposition.” Estuarine, Coastal and Shelf Science 54: 643–653.
- McCarthy, D.T., K. Zhang, C. Westerlund, M. Viklander, J. L. Bertrand-Krajewski, T. D. Fletcher, and A. Deletic 2017. “Assessment of Sampling Strategies for Estimation of Site Mean Concentrations of Stormwater Pollutants.” Water Research. doi:10.1016/j.watres.2017.10.001.
- McNett, J. K., and W. F. Hunt. 2011. “An Evaluation of the Toxicity of Accumulated Sediments in Forebays of Stormwater Wetlands and Ponds.” Water, Air, & Soil Pollution 218 (1): 529–538. doi:10.1007/s11270-010-0665-9.
- Merriman, L. S., and W. F. Hunt. 2014. “Maintenance Vs. Maturation: A Constructed Stormwater Wetland’s Fifth Year Water Quality & Hydrologic Assessment.” Journal of Environmental Engineering 140: 10. doi:10.1061/(ASCE)EE.1943-7870.0000861.
- Nara, Y., and R. Pitt 2005. Alabama Highway Drainage Conservation Design Practices – Particulate Transport in Grass Swales and Grass Filters. No. UTCA Report 04117.t
- Polyakov, V. O., and M. A. Nearing. 2004. “Rare Earth Element Oxides for Tracing Sediment Movement.” Catena 55 (3): 255–276. doi:10.1016/S0341-8162(03)00159-0.
- Polyakov, V.O., A. Kimoto, M.A. Nearing and M.H. Nichols. 2009. “Tracing Sediment Movement on a Semiarid Watershed Using Rare Earth Elements.” Soil Sci. Soc. Am.j. 73 (5): 1559–1565. doi:10.2136/sssaj2008.0378.
- Selbig, W., M. N. Fienen, J. A. Horwatich and R. T. Bannerman. 2016. “The Effect of Particle Size Distribution on the Design of Urban Stormwater Control Measures.” Water 8: 1–17. doi:10.3390/w8010017.
- Sholz, M. 2006. Wetland Systems to Control Urban Runoff. UK: Elsevier.
- Stevens, R., and F. Ogunyoye. 2012. Lambs Drove Sustainable Drainage Systems (Suds) Monitoring Project. UK: Cambridge County Council and Royal Haskoning.
- Taylor, K. G., and P. N. Ownes. 2009. “Sediments in Urban River Basins: A Review of Sediment-Contaminant Dynamics in an Environmental System Conditioned by Human Activities.” Journal of Soils Sediments 9: 281–303. doi:10.1007/s11368-009-0103-z.
- Vaze, J., H. Francis, and S. Chiew. 2002. “Experimental Study of Pollutant Accumulation on an Urban Road Surface,” Urban Water 4: 379–389.
- Water by Design. 2014. Water Sensitive Designs. Healthy Waterways.
- Woods Ballard, B., S. Wilson, H. Udale-Clarke, S. Illman, T. Scott, R. Ashley, and R. Kellagher. 2015. The SuDS Manual(C753). London: CIRIA.
- Yousef, Y. A., T.Hvitved-Jacobsenb, J.Sloata and Win Lindemanc. 1994. “Sediment Accumulation in Detention or Retention Ponds.” Science of the Total Environment 146: 451–456. doi:10.1016/0048-9697(94)90268-2.
- Zanders, J. M. 2005. “Road Sediment: Characterisation and Implications for Performance of Vegetated Strips for Treating Road Runoff.” Science of the Total Environment 399: 41–47. doi:10.1016/j.scitotenv.2004.07.023.
- Zepf, V. 2013. “Rare Earth Elements: What and where they are.” In Rare Earth Elements, 11-39. Berlin: Springer.
- Zhang, X.C., M. Friedrichb, M. A. Nearingc and L. D. Nortonc. 2001. “Potential Use of Rare Earth Oxides as Tracers for Soil Erosion and Aggregation Studies.” Soil Sciences American Journal 65: 1508–1515. doi:10.2136/sssaj2001.6551508x.
- Zhang, X.C., Nearingb, M. A., Polyakovb, V. O. and J. M. Friedrich. 2003. “Using Rare-Earth Oxide Tracers for Studying Soil Erosion Dynamics.” Soil Social American Journal 67: 279–288. doi:10.2136/sssaj2003.2790.
Appendix 1. Representative SuDS device areas relative to sample point
Appendix 2. REO characteristics, for REO used in this study (Adachi et al. Citation2004; Zepf Citation2013; Henderson Citation1984)
Appendix 3. REO elements and ICP-MS analysis parameters as relevant to the REO methodology used in the present thesis
Appendix 4
Sketch of sample hoses and floats for perennially wet SuDS asset sampling. Hoses were 10 mm diameter. Hoses were flushed before and after each sample occurrence. The hoses were placed in the wet assets as static sampling measures to ensure samples were collected from the same location and depth at every sample occurrence.
Appendix 5
Sketch of sediment traps in the field. Left hand photo shows the sediment trap flush with the swale bed. Right hand photos show the sediment trap full (bottom) and being reset with clean gravel (top). Similar designs of trap (300 × 200 × 100 mm) are also used in e.g. Lawler (2006), IAEA (2003) and Fraley (2004).
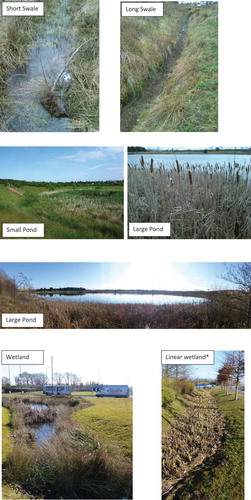
Appendix 6. Photographs of monitored SuDS devices
*The linear wetland photograph was taken after vegetation maintenance (reed and grass cutting). The reeds were approximately + 0.5 m in growth during the monitoring period.
Appendix 7
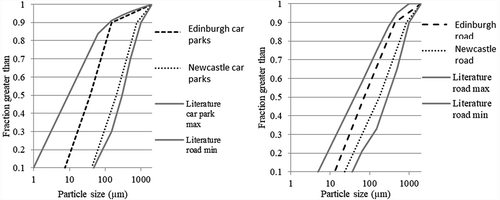
Particle size distributions for car park and road samples from the Edinburgh and Newcastle study sites.
Appendix 8. Rainfall characteristics for the Edinburgh and Newcastle general locations
Edinburgh.
Newcastle