
 ?Mathematical formulae have been encoded as MathML and are displayed in this HTML version using MathJax in order to improve their display. Uncheck the box to turn MathJax off. This feature requires Javascript. Click on a formula to zoom.
ABSTRACT
There is an increasing interest in modelling and control of integrated urban wastewater systems (UWS). Nevertheless, given the multiple interactions between the sub-systems – catchment, sewer system, wastewater treatment plant (WWTP) and receiving water system – the selection of effective control handles for improving receiving water quality is a major challenge. In this paper, a systematic study to identify the most important control handles in an UWS is presented. The Benchmark Simulation Model for Urban Wastewater Systems (BSM-UWS) is selected as a virtual case-study. Morris screening is used to perform global sensitivity analysis. Results indicate that, for the BSM-UWS layout, while river dissolved oxygen quality (Texc,DO) is influenced by multiple control handles both in the sewer system and WWTP, river un-ionized ammonia quality (Texc,NH3) is mainly influenced by WWTP control handles. The study highlights the need to perform simulations for at least 1 year when determining key control handles for UWS.
1. Introduction
Integrated modelling of urban wastewater systems (UWS) is increasingly being recognized as a valuable tool to understand and thereby improve the performance of urban wastewater infrastructure (Bach et al. Citation2014; Benedetti et al. Citation2013). Many authors (e.g. Harremoës et al. Citation1993; House et al. Citation1993; Beck Citation1976) identified the multiple interactions between different sub-systems (catchment, sewer network, wastewater treatment plant (WWTP) and receiving waters) when studying UWS. Indeed, it is advantageous to consider holistic approaches to improve the quality of receiving waters, instead of focusing on the sewer system or WWTP performance individually. Various case studies demonstrating the potential of integrated modelling and control to optimize the performance of UWS are available in the literature (Weijers et al. Citation2012; Nielsen and Nielsen Citation2005; Sharma et al. Citation2013; Seggelke et al. Citation2013; Kroll et al. Citation2016). In addition, several publications highlight the great potential of integrated modelling tools to effectively improve receiving water quality by analysing the entire UWS as a single unit (Muschalla Citation2008; Rauch and Harremoës Citation1999; Vanrolleghem, Benedetti, and Meirlaen Citation2005).
Recognizing the importance and growing interest in integrated modelling and control, the Benchmark Simulation Model for Urban Wastewater Systems (BSM-UWS) was developed (Saagi et al. Citation2017). It consists of a model library for all the sub-systems (catchment, sewer system, WWTP and receiving water system) and a pre-defined hypothetical UWS layout. This enables interested users to study various control and operational measures without having to build the UWS from scratch. However, such models are highly complex with numerous interactions making it difficult to determine the most influential control handles and design parameters that will lead to substantial improvements in the receiving water quality. In this context, we propose the use of global sensitivity analysis (GSA) to identify influential operational/control handles (to maximize performance using the existing infrastructure) towards improving receiving water quality as well as the sewer system and WWTP performance.
A survey of the existing literature on GSA for integrated UWS models highlighted that such an analysis is rarely performed. Fu, Butler, and Khu (Citation2009) and Astaraie-Imani et al. (Citation2012) employed GSA on a semi-hypothetical case study in the UK to determine the effects of urbanization, climate change and operational parameters on receiving water quality. Only a limited set of control handles are evaluated in these studies and a short-term rainfall time series (six days) is used for the simulations. Langeveld et al. (Citation2013) employed a more thorough GSA to determine different control handles that have influence on river ammonia and DO concentrations. Three different rain events (with different return periods) are used to study the response of the modelled river system with an 11-day evaluation period for each scenario. While global sensitivity analysis studies and modelling guidelines in the areas of sewer system (Schütze et al. Citation2008) and wastewater treatment plant modelling (Rieger et al. Citation2012) use long-term simulations, it can be noticed from the above examples that short-term rainfall data is used as an alternative to long-term simulations in various GSA studies related to UWS modelling, mainly to reduce computational costs. However, such short-term evaluation periods may lead to underestimating the importance of processes that have long time constants (e.g. biological processes in WWTPs). In order to overcome these limitations, this study assesses the influence of evaluation period (15 days vs 1 year) and rainfall intensity on the results of the GSA specifically for UWS models.
The paper presents an overview of the BSM-UWS layout and the evaluation criteria used for the analysis. Morris screening (Morris Citation1991; Campolongo, Cariboni, and Saltelli Citation2007) is used as the GSA method of choice owing to its low computational footprint. Various control handles in the sewer system and WWTP and their uncertainty ranges are described. GSA is performed to determine the influential control handles using a 1 year rainfall evaluation period. Additionally, a comparison is made between the GSA results for control handles using: i) three different short-term rainfall time series (15 days) with varying intensities; and ii) the 1 year evaluation. The results from this study provide valuable information to future BSM-UWS users interested in developing integrated control strategies and system modifications. The knowledge obtained can further strengthen our understanding of the multiple interactions between the different sub-systems (catchment, sewer, WWTP and river water system). It again stresses the need to consider holistic evaluation methods when river water quality is to be improved (instead of focusing on optimizing the sub-systems).
2. Methods
2.1. Urban wastewater system layout
The BSM-UWS layout () consists of: i) an urban catchment (with different sub-catchments) that generates sewage as well as stormwater; ii) a sewer system; iii) a WWTP; and finally iv) a river system into which sewer overflows and treated effluent from the WWTP are discharged.
Figure 1. BSM-UWS layout identifying different control strategies (in orange) used for the GSA study (modified from Saagi et al. (Citation2017)). Note that the diagram for the valve after the rainwater storage tank (just before the primary clarifier) represents two valves (throttle valve for the storage tank and the bypass valve) and DO control includes three control handles (SPDO2, KLa1gain, KLa3gain).
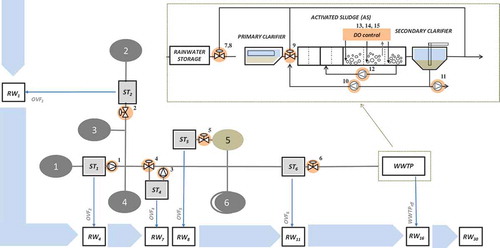
The hypothetical urban catchment (adapted from ATV (Citation1992); Schütze, Butler, and Beck (Citation2011)) consists of six sub-catchments (SC1…SC6) with a total area of 540 hectares and a load corresponding to 80 000 population equivalents. The UWS layout broadly represents a mid-sized Scandinavian city. However, potential users can easily modify the layout to suit their specific needs. describes the characteristics of the individual sub-catchments. During dry weather, the daily average wastewater generation is 19,000 m3.d−1 with the contribution from domestic and industrial sources being 12,000 m3.d−1 and 2500 m3.d−1, respectively. Daily average infiltration to sewers is assumed to be 4500 m3.d−1. While all sub-catchments generate domestic wastewater, SC2 has an industrial source releasing pre-treated effluent into the sewer system.
Table 1. Catchment characteristics and sewer storage volumes for the BSM-UWS layout.
The sewer network consists of a combination of combined as well as separated sewer systems (individual pipes for storm water and wastewater). Five sub-catchments (SC1, SC2, SC3, SC4 and SC6) are connected to a combined sewer system, whereas SC5 is connected to a separated sewer network. Five storage tanks are located in different sub-catchments (SC1, SC2, SC4, SC5 and SC6). Total storage volume available is 22,100 m3 (approx. 40 m3.ha−1 of catchment area). The storage volume mentioned is only for the different storage tanks in the network. In-pipe storage volume is not modelled explicitly. Online pass-through tanks are used at four locations (ST1, ST2, ST5 and ST6) whereas ST4 is an offline bypass tank. The outflow from online tanks is regulated by throttle valves/pumps and from an offline tank is regulated by a pump with fixed pumping capacity. However, there is no active control of pumping rates and throttle valve levels in the default layout. Sewer overflows from all the storage tanks are discharged into the river. Individual storage volumes for each tank are given in .
The WWTP consists of a modified BSM1-ASM2d plant layout (Flores-Alsina et al. Citation2012). The biological section includes: i) two anaerobic tanks (ANAER1, ANAER2) (2 x 1000 m3); ii) two anoxic tanks (ANOX1, ANOX2) (2 x 1500 m3); and iii) three aerobic tanks (AER1, AER2, AER3) (3 x 3000 m3). A primary clarifier (PC) (900 m3) and a secondary clarifier (Sec.C) (area = 2500 m2) are used for separation of sludge and particulates before and after the biological reactors. A rainwater storage tank (RST) (8000 m3) before the primary clarifier helps balance peak loads and store excess rainwater. In order to protect the WWTP from peak wet weather flows, two bypass facilities (BP1, BP2) (before and after the primary clarifier) are included. BP1 has a threshold of 90,000 m3.d−1 (any flow in excess of the threshold is bypassed) and BP2 has a threshold of 70,000 m3.d−1. The default control strategy is DO control – proportional integral (PI) control for AER2 based on measurements in AER2 (set point – 2 mg.l−1) and correspondingly higher and lower oxygen transfer coefficient (KLa) values (KLa1gain, KLa3gain) for reactors AER1 and AER3. The model also incorporates changes in influent temperature due to seasonal changes as well as precipitation events.
A 30 km long shallow river runs across the urban catchment and receives sewer overflows (OVF1-RW1, OVF2-RW4, OVF4-RW7, OVF5-RW8, OVF6-RW11) and WWTP effluent (WWTPeff-RW16). The river has a mean annual base flow rate of 72,500 m3.d−1. Additional runoff from an upstream catchment (area = 500 ha) reaches the river during rain events. The river has a uniform bottom width of 7 m and is trapezoidal in shape.
2.2. Evaluation criteria
Several evaluation criteria exist for the different sub-systems of the UWS. In this case-study, a selected list of two criteria each for the sewer system, WWTP and receiving water quality performance are used.
Sewer system
Total overflow volume (Vovf, m3): This is the total overflow volume from all the overflows in the catchment.
Overflow quality index (OQI, kg poll. units.d−1): This is an aggregated pollution index that represents the pollution load from sewer overflows. It considers seven different pollutants (total suspended solids (TSS), chemical oxygen demand (COD), five-day biochemical oxygen demand (BOD5), total Kjeldahl nitrogen (TKN), nitrate (NO3), organic phosphorus (Porg) and inorganic phosphorus (Pinorg). OQI is the weighted sum of the individual pollution loads.
While other criteria for the sewer system exist (duration of overflow, number of overflow events), these are not used owing to the BSM-UWS layout. As the layout contains a sub-catchment connected to a separate sewer system (SC5), all rain events will lead to an overflow event in this sub-catchment. Hence, control handles do not have any influence on the number and duration of overflows as the two indicators are dominated by the performance in SC5.
WWTP
Effluent quality index (EQI, kg poll units.d−1): This represents the pollutant load from the WWTP reaching the river water system. It is calculated in the same manner as OQI. The EQI considers the pollutant loads from the bypass and the effluent from the secondary clarifier.
Operational cost index (OCI, -): It represents a combination of all the potential costs involved in a wastewater treatment facility – aeration, pumping, mixing, sludge disposal and chemicals. A cumulative index is calculated by multiplying each of the above factors with a pre-defined weight.
Exact weights for OQI, EQI and OCI calculations are provided in the Appendix.
Receiving water
Exceedance duration for NH3 (Texc,NH3, hrs): This is the duration for which the un-ionized ammonia (NH3) concentration is above a particular threshold value (= 0.018 g N.m−3).
Exceedance duration for DO (Texc,DO, hrs): This is the duration for which the dissolved oxygen (DO) concentration is below a particular threshold value (= 6 g.m−3).
The threshold concentrations for DO and NH3 are based on the fundamental intermittent standards for salmonid fishery with a return period of 1 month as specified by the Urban Pollution Management Manual (FWR Citation2012).
2.3. Global sensitivity analysis
2.3.1. Morris screening
Morris screening (Morris Citation1991; Campolongo, Cariboni, and Saltelli Citation2007) is a computationally efficient tool to perform GSA studies, especially for large input factor sets. It offers the advantage of a global analysis at a cost similar to local one-at-a-time sensitivity analysis. The method uses the concept of ‘elementary effects’ to analyse the impact of various input factors on the outputs. The measure µ*, which is the mean of the distribution of absolute values for elementary effects, is used to rank the different input factors. Other GSA methods commonly employed are: i) variance decomposition (Sobol Citation2001); and ii) regression-based methods (Saltelli et al. Citation2008). While these methods offer an additional ability to quantify the influence of different input factors on the outputs, they have higher computational costs when compared to Morris screening. Hence, Morris screening is an ideal choice for a preliminary screening study with less computational effort. Further details about the method are provided in the Appendix.
2.3.2. Input factors and uncertainty framing
The list of input factors for the Morris screening is presented in . It is assumed that the control handles have a high uncertainty (±50%) as it should be possible to operate them with a wide range of variation although an even higher uncertainty range was used for control handles in the earlier studies (Astaraie-Imani et al., Citation2012; Langeveld et al. Citation2013). A uniform uncertainty range is used for all the input factors in order to avoid any differences in the GSA results due to variation in the input uncertainty ranges. Ideally, for a real case-study, a more accurate uncertainty range for each input factor can be chosen based on the constraints of the equipment. With 15 control handles (k) and 50 repetitions (r), 800 simulations (r × (k + 1)) are performed for GSA. Finally, only input factors with µ* values higher than 0.1 are considered as influential. The value of 0.1 for µ* is defined heuristically in order to limit the number of influential input factors to a maximum of 10. In this way, only the most important factors can be isolated and analysed. A high number of repetitions are chosen to avoid any potential convergence issues (Vanrolleghem et al. Citation2015). The framing is developed based on the objective of this study, which is to determine important control handles. Hence, the number and list of input factors varies in comparison to other studies focusing on uncertainty analysis of model parameters (Freni, Mannina, and Viviani Citation2009, Citation2011) or identification of locations for data collection towards model calibration (Kleidorfer et al. Citation2009).
Table 2. List of input factors (control handles) for the GSA study.
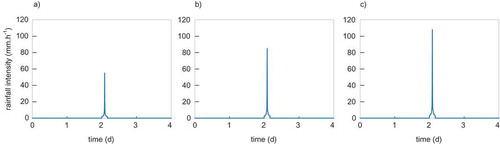
Additionally, in order to compare the impact of the duration of the evaluation period on the sensitivity analysis results, three different rainfall time series (15 days evaluation period) are chosen. GSA is performed for identifying the most influential control handles for each rainfall time series and the results are compared with the 1 year evaluation. Each 15-day rainfall time series consists of a synthetic single rain event (4 hour duration on day 2) with varying total rainfall (20 mm, 31 mm and 40 mm), which corresponds to 0.5, 1 and 5 year return periods based on historic data from Copenhagen, Denmark. Refer to in Appendix for a graphical representation of the rainfall time series.
3. Results
3.1. Control handles
In the sewer system, the influential control handles (1-year simulation period) for both overflow volume (Vovf) and overflow quality index (OQI) are Qmax,ST6 and Qthrottle,ST4 (). Also, the µ* values are similar for both cases indicating a correlation between Vovf and OQI. For the chosen uncertainty range, the control handles available for manipulating sewer performance are limited. Storage tanks located downstream (closer to WWTP) have high influence on sewer system performance for the chosen sewer system layout. Given that, pipes connected to ST6 and ST4 receive the highest flow rates, their high influence is expected. However, it is still possible that these control handles provide significant improvements in sewer system performance (Saagi et al. Citation2017).
Figure 2. Influential control handles for sewer and WWTP performance criteria (1-year evaluation period) – Vovf (a), OQI (b), EQI (c) and OCI (d). Sewer control handles in blue and WWTP control handles in green.
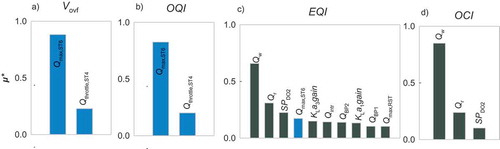
The WWTP criteria EQI and OCI are affected by different sets of input factors (). EQI is influenced by a wide number of WWTP control handles but only one sewer control handle (Qmax,ST6). However, it is important to note that WWTP control handles manipulating influent flow rate to the WWTP (Qmax,RST, QBP1 and QBP2) are influential. This indicates that control handles that can lead to variation in influent flow rate, especially during wet weather conditions, either in the sewer system or at the WWTP can have an influence on WWTP effluent quality. Hence, a potential to improve effluent quality by manipulating influent flow rate exists for this particular layout. However, the analysis using µ* values does not indicate the direction of change in influent flow rate for an improvement in effluent quality. This has to be obtained from existing process knowledge and/or further simulations. OCI is understandably mainly influenced by pumping (Qw and Qr) and oxygen set point (SPDO2) in the WWTP. The pumping rates are defined as fixed values for the entire simulation without any active control. Hence, variations in sewer system control handles do not lead to changes in pumping rates.
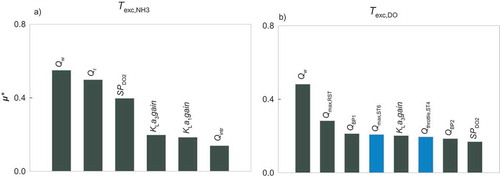
In terms of river water quality, Texc,NH3 () is strongly influenced by WWTP control handles (Qw, Qr, SPDO2, KLa3gain, KLa1gain and Qintr). As WWTP effluent is the major input for ammonia load to the river water system, WWTP control handles (which influences effluent NH4 quality) are the most important parameters for river NH3 quality. On the other hand, both sewer control handles (Qmax,ST6 and Qthrottle,ST4) and WWTP control handles (Qw, Qmax,RST, QBP1, KLa3gain, QBP2 and SPDO2) impact the river DO criterion (Texc,DO) (). DO quality in the river deteriorates mainly due to the organic load to the river. During dry weather conditions, the organic load to the river system is normally minimal for a well-operated WWTP. Hence, sewer overflows and bypass flows at a WWTP (both occurring during wet weather conditions) have a strong impact on river DO quality. Therefore, while WWTP control handles mainly affect river ammonia quality, both sewer system and WWTP control handles influence the river DO quality. However, it can be said that for the BSM-UWS layout, WWTP control handles exert a stronger influence on receiving water quality (in terms of both Texc,NH3 and Texc,DO) than sewer system control handles.
Figure 3. Influential control handles for river water quality using 1-year evaluation period in terms of Texc,NH3 (a) and Texc,DO (b). Sewer control handles in blue and WWTP control handles in green.
In summary, while the sewer system has limited influential control handles (these control handles can still lead to significant improvement in sewer system performance), there are multiple opportunities to design control strategies towards improving WWTP performance and receiving water quality. It has been clearly demonstrated that important control handles for the different sub-systems are not the same (Lau, Butler, and Schütze Citation2002), indirectly emphasizing that optimizing individual sub-systems does not necessarily lead to improved river water quality. Efforts to improve receiving water quality should take into consideration the possible improvements in both sewer system and WWTP in order to reap the maximum benefits from the existing infrastructure. These results also make a strong case for the use of integrated modelling approaches to optimize the UWS. Such models not only make it possible to see the effect of one sub-system on the other but also make it feasible to develop integrated control strategies (e.g. controlling sewer system operation in order to improve river water quality) as well as local control strategies using the same modelling platform.
3.2. Comparison between 15-days and 1-year evaluation
In order to highlight the differences between the influential control handles for short-term event-based simulations and longer time series evaluations, a comparison is made between GSA results for 15-days and 1-year evaluation periods. For the sewer evaluation criteria, the cumulative list of influential control handles identified from using all the three rain events is identical to the active control handles determined using a 1-year simulation (Qmax,ST6 and Qthrottle,ST4) (). While there are marginal differences between the µ* values for the different input factors, the order of magnitude of these values is similar and the ranking of the input factors is identical for 1-year and 15-days simulations. Hence, the sewer evaluation criteria have identical influential control handles and they can be determined using a combination of different rain events instead of using a 1-year evaluation.
Figure 4. Comparison of GSA results for sewer performance criteria (Vovf (a) and OQI (b)). The µ* values from three different 15-days evaluation are compared with 1-year evaluation.
For the WWTP performance criteria in terms of EQI, firstly, the results from the different 15-days simulations are very similar () in terms of ranking. However, when compared to the results from 1-year simulations, the list of influential control handles cumulatively from all 15-days simulations is similar to that from long-term simulations but the ranking is significantly different. WWTP control handles Qw and Qr are very important in the long-term (1-year) while the short-term (15-days) results indicate that sewer control handle Qmax,ST6 and bypass limits (QBP1 and QBP2) are critical. The effect of control handles like Qw and Qr can only be seen in the 1-year simulation due to their long time constants in comparison to sewer system control handles. For OCI, the ranking and the most significant parameters are identical for all rainfall events and also the 1-year simulation (only exception is SPDO2 – which is the third most influential parameter for 15-days rainfall events as well but is not represented in the figures as the sensitivity index is less than 0.1) (). Since there are no active control strategies that affect Qw and Qr based on incoming wastewater flow rate/load to the WWTP, their sensitivities do not change due to variations in rainfall and simulation periods.
Figure 5. The GSA results for WWTP performance (EQI (a) and OCI (b)) from 1-year evaluation compared with those from three 15-days simulations.
For the river quality criteria, the difference between sensitivity rankings for 15-days and 1-year simulations is very clear with multiple parameters identified as important only in one of them (15-days or 1-year) and completely missing in the other. For Texc,NH3, only two parameters (Qr and SPDO2) are identified both by 15-days and 1-year simulations (). Even for these two parameters, the ranking is entirely different. While the 15-days simulations indicate that bypass volumes (QBP1 and QBP2) and storage tank throttle flow rates (Qmax,ST6 and Qmax,RST) mainly affect Texc,NH3, 1-year simulations emphasize the dominance of WWTP control handles (Qw, Qr, SPDO2, KLa3gain, KLa1gain and Qintr). As the determined WWTP control handles are known to have a strong effect of nitrification, their presence in the list of key parameters in 1-year simulations is expected. In the case of Texc,DO, the variation is more limited although a similar trend is observed (). 15-days simulations identify five of the eight influential parameters that are determined from 1-year evaluations in spite of the rankings being different. While the 15-days simulations emphasize the importance of throttle flow rates (Qthrottle,ST4, Qmax,ST6 and Qmax,RST) and bypass limits (QBP1 and QBP2), 1-year simulations also indicate the strong influence of wastage rates (Qw) and aeration control handles (KLa3gain and SPDO2). For the river system, the importance of WWTP control handles has increased when 1-year evaluation is used while the 15-days scenarios over-estimate the influence of the sewer control handles.
Figure 6. GSA results comparison for river water quality criteria Texc,NH3 (a) and Texc,DO (b).
In conclusion, it should be stressed that replacement of the 1-year scenario by a limited number of short-term (15-days) rainfall events does not always reflect the list of influential control handles identified using the 1-year evaluation. This is the case because a few short rain events do not represent the characteristics of a longer rainfall time series for the entire year. In the case of sewer system evaluation, this assumption seems to hold but does not in the case of the WWTP and especially the receiving water system. Hence, any integrated modelling and control study should consider at least 1-year simulations in order to determine optimal control strategies/operational modifications aimed at enhancing the receiving water quality.
Determining the control handles without any further optimization does not lead to any benefits to the receiving water quality. Hence, influential control handles determined from the study will form the starting point for future development of integrated control strategies for the BSM-UWS layout. Finally, while the results from the study can be directly used by future BSM-UWS users, the detailed methodology can be used for other layouts developed using the BSM-UWS platform or any other modelling tool (Mannina, Cosenza, and Viviani Citation2017; Schütze et al. Citation2018).The use of Morris screening has resulted in performing a global sensitivity analysis with reduced computational effort. The method can also be applied to other system aspects (e.g. identifying the most important sections for future expansion of the UWS – should the sewer storage volume or WWTP aeration basin volume be increased to improve the river water quality?).
4. Conclusions
The key findings of the presented study are summarized below:
Dissolved oxygen quality in the river (Texc,DO) is influenced by control handles both in the sewer system and WWTP while un-ionized ammonia quality (Texc,NH3) is primarily influenced by control handles in the WWTP.
For the BSM-UWS layout, multiple effective control handles are available for influencing river water quality (Texc,DO, Texc,NH3) and WWTP performance (EQI, OCI). However, control handles for the sewer system (Vovf, OQI) are limited.
A combination of different short-term (15 days) simulation events is not sufficient to replace a longer simulation period (1 year) for evaluating integrated urban wastewater systems.
Sub-system optimization based on identification of key control handles to improve sewer system (Vovf, OQI) and WWTP performance (EQI, OCI) will not necessarily improve river water quality (Texc,DO, Texc,NH3).
Acknowledgements
Dr Flores-Alsina and Dr Saagi gratefully acknowledge the financial support provided by the People Program (Marie Curie Actions) of the European Union’s Seventh Framework Programme FP7/2007-2013 under REA agreement 329349 (PROTEUS) and 289193 (SANITAS), respectively. Dr Flores-Alsina is grateful for the financial support from the REWARD project, funded by the Innovation Fund Denmark (project 1308-0027B) and the collaborative international consortium WATERJPI2015 WATINTECH of the Water Challenges for a Changing World Joint Programming Initiative (Water JPI) 2015 call (project ID 196). The computations were performed on resources provided by Swedish National Infrastructure for Computing (SNIC) through the Center for Scientific and Technical Computing at Lund University (LUNARC) under projects SNIC 2017/1-125 and LU 2018/2-9. The authors gratefully acknowledge the feedback provided by Professor Peter A. Vanrolleghem, Canada Research Chair in Water Quality Modelling, Université Laval, Québec, Canada, during the development of the model.
Disclosure statement
No potential conflict of interest was reported by the authors.
Additional information
Funding
References
- Astaraie-Imani, M., Z. Kapelan, G. Fu, and D. Butler. 2012. “Assessing the Combined Effects of Urbanisation and Climate Change on the River Water Quality in an Integrated Urban Wastewater System in the UK.” Journal of Environmental Management 112: 1–9. doi:10.1016/j.jenvman.2012.06.039.
- ATV. 1992. A 128-Richtlinien für die Bemessung und Gestaltung von Regenentlastungsanlagen in Mischwasserkanälen. ATV-Arbeitsblatt A128. St. Augustin, Germany: Gesellschaft zur Förderung der Abwassertechnik. (in German).
- Bach, P. M., W. Rauch, P. S. Mikkelsen, D. T. McCarthy, and A. Deletic. 2014. “A Critical Review of Integrated Urban Water Modelling – Urban Drainage and Beyond.” Environmental Modelling & Software 54: 88–107. doi:10.1016/j.envsoft.2013.12.018.
- Beck, M. B. 1976. “Dynamic Modelling and Control Applications in Water Quality Maintenance.” Water Research 10 (7): 575–595. doi:10.1016/0043-1354(76)90139-1.
- Benedetti, L., J. G. Langeveld, A. Comeau, L. Corominas, G. Daigger, C. Martin, P. S. Mikkelsen, L. Vezzaro, S. Weijers, and P. A. Vanrolleghem. 2013. “Modelling and Monitoring of Integrated Urban Wastewater Systems: Review on Status and Perspectives.” Water Science and Technology 68 (6): 1203–1215. doi:10.2166/wst.2013.397.
- Campolongo, F., J. Cariboni, and A. Saltelli. 2007. “An Effective Screening Design for Sensitivity Analysis of Large Models.” Environmental Modelling & Software 22: 1509–1518. doi:10.1016/j.envsoft.2006.10.004.
- Flores-Alsina, X., L. Corominas, M. B. Neumann, and P. A. Vanrolleghem. 2012. “Assessing the Use of Activated Sludge Process Design Guidelines in Wastewater Treatment Plant Projects: A Methodology Based on Global Sensitivity Analysis.” Environmental Modelling & Software 38: 50–58. doi:10.1016/j.envsoft.2012.04.005.
- Freni, G., G. Mannina, and G. Viviani. 2009. “Uncertainty Assessment of an Integrated Urban Drainage Model. Journal of Hydrology, 373, 392-404.Fu, G. And Butler, D. (2012). Frequency Analysis of River Water Quality Using Integrated Urban Wastewater Models.” Water Science and Technology 65 (12): 2112–2117.
- Freni, G., G. Mannina, and G. Viviani. 2011. “Assessment of Data and Parameter Uncertainties in Integrated Water-Quality Model.” Water Science and Technology 63: 1913–1921.
- Fu, G., D. Butler, and S.-T. Khu. 2009. “The Impact of New Developments on River Water Quality from an Integrated System Modelling Perspective.” Science of the Total Environment 407 (4): 1257–1267. doi:10.1016/j.scitotenv.2008.10.033.
- FWR. 2012. Urban Pollution Management Manual. 3rd ed. Marlow, UK: Foundation for Water Research.
- Harremoës, P., A. G. Capodaglio, B. G. Hellström, M. Henze, K. N. Jensen, A. Lynggaard-Jensen, R. Otterpohl, and H. Søeberg. 1993. “Wastewater Treatment Plants under Transient Loading – Performance, Modelling and Control.” Water Science and Technology 27 (12): 71–115. doi:10.2166/wst.1993.0292.
- House, M. A., J. B. Ellis, E. E. Herricks, T. Hvitved-Jacobsen, J. Seager, L. Lijklema, H. Aalderink, and I. T. Clifforde. 1993. “Urban Drainage – Impacts on Receiving Water Quality.” Water Science and Technology 27 (12): 117–158. doi:10.2166/wst.1993.0293.
- Kleidorfer, M., M. Möderl, S. Fach, and W. Rauch. 2009. “Optimization of Measurement Campaigns for Calibration of a Conceptual Sewer Model.” Water Science and Technology 59: 1523–1530. doi:10.2166/wst.2009.154.
- Kroll, S., G. Dirckx, B. M. R. Donckels, M. van Dorpe, M. Weemaes, and P. Willems. 2016. “Modelling Real-Time Control of WWTP Influent Flow under Data Scarcity.” Water Science and Technology 73 (7): 1637–1643. doi:10.2166/wst.2015.641.
- Langeveld, J. G., L. Benedetti, J. J. M. De Klein, I. Nopens, Y. Amerlinck, A. F. van Nieuwenhuijzen, T. Flameling, O. van Zanten, and S. Weijers. 2013. “Impact-Based Integrated Real-Time Control for Improvement of the Dommel River Water Quality.” Urban Water Journal 10 (5): 312–329. doi:10.1080/1573062X.2013.820332.
- Lau, J., D. Butler, and M. Schütze. 2002. “Is Combined Sewer Overflow Spill Frequency/Volume a Good Indicator of Receiving Water Quality Impact?.” Urban Water 4: 181–189. doi:10.1016/S1462-0758(02)00013-4.
- Mannina, G., A. Cosenza, and G. Viviani. 2017. “Micropollutants Throughout an Integrated Urban Drainage Model: Sensitivity and Uncertainty Analysis.” Journal of Hydrology 554: 397–405. doi:10.1016/j.jhydrol.2017.09.026.
- Morris, M. D. 1991. “Factorial Sampling Plans for Preliminary Computational Experiments.” Technometrics 33: 161–174. doi:10.1080/00401706.1991.10484804.
- Muschalla, D. 2008. “Optimization of Integrated Urban Wastewater Systems Using Multi-Objective Evolution Strategies.” Urban Water Journal 5 (1): 59–67. doi:10.1080/15730620701726309.
- Nielsen, B., and M. K. Nielsen 2005. From Pumping Station Monitoring to Integrated System Control: 30 Years of Practical Experience with RTC of Wastewater Systems, with Implications. In 10th International Conference on Urban Drainage, Copenhagen, Denmark, August 21–26, 2005.
- Rauch, W., and P. Harremoës. 1999. “Genetic Algorithms in Real Time Control Applied to Minimize Transient Pollution from Urban Wastewater Systems.” Water Research 33 (5): 1265–1277. doi:10.1016/S0043-1354(98)00304-2.
- Rieger, L., S. Gillot, G. Langergraber, T. Ohtsuki, A. Shaw, I. Takács, and S. Winkler (2012). Guidelines for Using Activated Sludge Models. IWA Scientific and Technical Report No. 22. London, UK: IWA Publishing.
- Saagi, R., X. Flores-Alsina, S. Kroll, K. V. Gernaey, and U. Jeppsson. 2017. “A Model Library for Simulation and Benchmarking of Integrated Urban Wastewater Systems.” Environmental Modelling & Software 93: 282–295. doi:10.1016/j.envsoft.2017.03.026.
- Saltelli, A., M. Ratto, T. Andres, F. Campolongo, J. Cariboni, D. Gatelli, M. Saisana, and S. Tarantola. 2008. Global Sensitivity Analysis: The Primer. Chichester, UK: John Wiley & Sons.
- Schütze, M., D. Butler, and B. M. Beck. 2011. Modelling, Simulation and Control of Urban Wastewater Systems. London, UK: Springer Science & Business Media.
- Schütze, M., V. Erbe, U. Haas, M. Scheer, and M. Weyand. 2008. “Sewer System Real-Time Control Supported by the M180 Guideline Document.” Urban Water Journal 5: 67–76. doi:10.1080/15730620701754376.
- Schütze, M., M. Lange, N. Pabst, and U. Haas. 2018. “Astlingen – A Benchmark for Real Time Control (RTC).” Water Science and Technology 2017 (2): 552–560. doi:10.2166/wst.2018.172.
- Seggelke, K., R. Löwe, T. Beeneken, and L. Fuchs. 2013. “Implementation of an Integrated Real-Time Control System of Sewer System and Waste Water Treatment Plant in the City of Wilhelmshaven.” Urban Water Journal 10 (5): 330–341. doi:10.1080/1573062X.2013.820331.
- Sharma, A. K., T. Guildal, H. A. R. Thomsen, P. S. Mikkelsen, and B. N. Jacobsen. 2013. “Aeration Tank Settling and Real Time Control as a Tool to Improve the Hydraulic Capacity and Treatment Efficiency during Wet Weather: Results from 7 Years Full-Scale Operational Data.” Water Science and Technology 67 (10): 2169–2176. doi:10.2166/wst.2013.129.
- Sobol, I. M. 2001. “Global Sensitivity Indices for Nonlinear Mathematical Models and Their Monte Carlo Estimates.” Mathematics and Computers in Simulation 55 (1–3): 271–280. doi:10.1016/S0378-4754(00)00270-6.
- Vanrolleghem, P. A., L. Benedetti, and J. Meirlaen. 2005. “Modelling and Real-Time Control of the Integrated Urban Wastewater System.” Environmental Modelling & Software 20 (4): 427–442. doi:10.1016/j.envsoft.2004.02.004.
- Vanrolleghem, P. A., G. Mannina, A. Cosenza, and M. B. Neumann. 2015. “Global Sensitivity Analysis for Urban Water Quality Modelling: Terminology, Convergence and Comparison of Different Methods.” Journal of Hydrology 522: 339–352. doi:10.1016/j.jhydrol.2014.12.056.
- Weijers, S. R., J. De Jonge, O. van Zanten, L. Benedetti, J. G. Langeveld, H. W. Menkveld, and A. F. van Nieuwenhuijzen. 2012. “KALLISTO: Cost Effective and Integrated Optimization of the Urban Wastewater System Eindhoven.” Water Practice and Technology 7 (2): 1–9. doi:10.2166/wpt.2012.036.
Appendix
1. Evaluation criteria
Table A1. Weights used for the calculation of criteria OQI, EQI and OCI.
2. Morris screening
Consider k input factors (X1….Xk) leading to an output Y. The elementary effect for input factor Xi at a point Xi0 in the input space is given by:
where Δ is the change in Xi between two different model runs. The input factor space for each input Xi is varied across p levels. Assuming that p is even, a value of guarantees uniform sampling across the input space. After r such repetitions (which require r×(k + 1) simulations), a distribution of elementary effects (EEi) for the input factor Xi is obtained by randomly sampling the input space for Xi. The mean (µ) and standard deviation (σ) of this distribution are the sensitivity measures for the given input Xi towards the output Y. A higher mean indicates that the parameter is important and a higher standard deviation shows that there are interactions and non-linearities affecting the input factor. In general, µ and σ are plotted against each other. A wedge is plotted on the graph for
. Any factor outside the wedge is influential. The factors inside the wedge are non-influential.
Figure A1. An example wedge plot using the µ and σ values obtained from Morris screening.
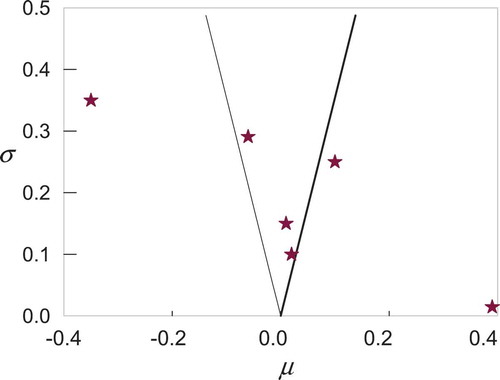
Figure A2. Rainfall data for the three different return periods (0.5 year (a), 2 years (b) and 5 years (c)).
A modification of the measure is to use µ*, which is the mean of the distribution of absolute values for elementary effects. The advantages of using µ* are: i) parameters can now be ranked; ii) it will avoid type II errors which can be caused by two elementary effects of opposite signs cancelling each other out and resulting in a small mean value. In general, a combination of µ vs σ and µ* values can provide insights into the ranking of the factors and any non-linearities and interactions in the factors.
3. Short-term rainfall data
4. Complete list of sensitivity indices
Table A2. Complete list of sensitivity indices for all the input factors using 1-year evaluation period. Influential control handles in bold text.
Table A3. Complete list of sensitivity indices for all the input factors using a 5-year return period rainfall event. Influential control handles in bold text.
Table A4. Complete list of sensitivity indices for all the input factors using a 2-year return period rainfall event. Influential control handles in bold text.
Table A5. Complete list of sensitivity indices for all the input factors using a 0.5-year return period rainfall event. Influential control handles in bold text.