
 ?Mathematical formulae have been encoded as MathML and are displayed in this HTML version using MathJax in order to improve their display. Uncheck the box to turn MathJax off. This feature requires Javascript. Click on a formula to zoom.
ABSTRACT
Urbanization modifies the natural water cycle particularly by reducing the water storage capacity. We analysed the storage capacity of three stormwater management designs in south-western Finland to demonstrate how an urban catchment releases stormwater and how storage contributes to flood resilience. The analysis relies on EPA SWMM5.1 simulations of water balance for a seven-month period including two extreme rain events during the summer and autumn. The enhanced storage capacity provided by the designs increased resilience against flooding and released stormwater with slower rates leading to reduced peak flows. Even the design with the least storage (10% LID coverage) was efficient at regulating floods due to controlled flow in a vegetated swale, whereas the design with the highest storage capacity (60% LID coverage) demonstrated the possibility of restoring nearly natural water cycle in urban catchments. The study suggests storage capacity can act as a flood resilience indicator directly linked with the physical catchment characteristics.
1. Introduction
Urbanization has adverse effects on hydrological functions of a catchment (Burns et al. Citation2012; Fletcher, Andrieu, and Hamel Citation2013; Guan et al. Citation2015b; Salvadore, Bronders, and Batelaan Citation2015). The natural hydrological cycle is modified through the introduction of impervious surfaces and artificial flow paths, resulting in decreased infiltration and reduced water storage capacity (Fletcher, Andrieu, and Hamel Citation2013; Golden and Hoghooghi Citation2017; Vogel et al. Citation2015). To reduce the human impact on components of the hydrological cycle in urban areas, a paradigm shift in drainage-based urban design towards nature-based solutions has emerged in the recent decades. Accordingly, stormwater is more often considered as a resource that is stored, infiltrated, and re-used on site (Burns et al. Citation2012; Fletcher, Andrieu, and Hamel Citation2013; Vogel et al. Citation2015). The shift is referred with different terms in different parts of the world, e.g. Low Impact Development (LID) in USA or Water Sensitive Urban Designs (WSUD) in Australia (Fletcher et al. Citation2015). In practice, stormwater management designs are a subset of WSUD and LID refer to small-scale stormwater management techniques such as bioretention cells, green roofs, permeable pavements, vegetated swales and rain gardens, which are located at or near the source of runoff (Fletcher et al. Citation2015). The focus of this study is on LID designs aiming to restore the natural water cycle of a development site.
Water balance analysis has been widely utilized in the hydrological studies on rural catchments, e.g. for the purposes of streamflow regulation (Sayama et al. Citation2011; Spence et al. Citation2010) and natural catchment characterization (McNamara et al. Citation2011). Kirchner (Citation2009) applied water balance analysis in estimating temporal development of the catchment storage and its sensitivity to the initial storage value. The same study stated that the storage component of the water balance, in particular, provides important insight on the catchment’s resilience against flooding and its water retention capacity. In this study, ‘storage capacity’ is defined as the ability of a catchment to store stormwater and ‘resilience’ as the capability of a catchment to resist pluvial flooding and to lose stored stormwater to recover its storage capacity.
On urban catchments, one of the main goals of LID techniques is to reduce direct runoff from impervious surfaces (Miles and Band Citation2015). Although there is an abundance of studies assessing the impact of LID techniques on stormwater outflow (Guan et al. Citation2015a, Citation2015b; Sillanpää and Koivusalo Citation2015) and urban flooding (Burns et al. Citation2015; Qin, Li, and Fu Citation2013; Xu et al. Citation2017), quantitative assessment of the storage of an urban catchment with LID techniques has received limited attention. Qin, Li, and Fu (Citation2013) presented a water balance approach as a theoretical framework for assessing storage capacity of individual LID techniques (i.e. permeable pavement, bioretention cell and vegetated swale) in the regulation of urban flooding. However, they along with Guan et al. (Citation2015b) noted that a combination of various LID techniques would be more effective than a single LID for urban flood control when the entire spectrum of storm events is considered. Burns et al. (Citation2012) emphasized that the urban stormwater management should focus on restoration of the natural water cycle at smaller upstream catchments, leading to benefits in flow regimes of larger scale downstream systems. The same study also suggested that there is a possibility to restore the natural water cycle in urban areas, i.e. to enhance infiltration and evapotranspiration, by a combination of interception-, storage- and conveyance-based LID techniques.
The lack of insight into storage capacity of urban catchments motivated us to analyze stormwater management designs with different densities of interception-, storage- and conveyance-based LID techniques. The analysis was facilitated by the water balance analysis tools of the US EPA Storm Water Management Model 5.1.012 (SWMM) (Rossman et al. Citation2016a). Simulations for a seven-month period, including an extreme rain event during the summer and another intense rain event in the autumn, were used to test the hypothesis that the catchment storage provides insights on its resilience against pluvial flooding and its ability to recover storage space through losses. Thus, the objectives of the study were: (1) to assess the impacts of stormwater management designs on water balance expressed in terms of the relative shares of input rainfall, and (2) to explore the relationships between the storage and the flow dynamics in order to understand how the designs release stormwater and how they contribute to catchment’s resilience against pluvial flooding.
2. Materials and methods
2.1. Study area
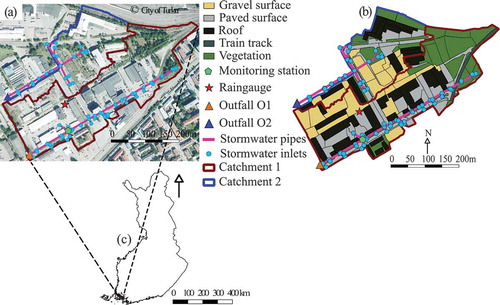
The Kirstinpuisto study area (14.8 ha) is located in the city of Turku, Finland (60°26ʹ53”N, 22°14ʹ15”E, ). In its current state with industrial and commercial land use, the area consists of two catchments: Catchment 1 (10 ha) and Catchment 2 (4.8 ha). The area is flat with an average slope of 3% and elevation ranging from 3 to 5 m.a.s.l. The total length of stormwater pipes is 833 m with their diameters ranging from 0.25 to 0.4 m. Currently, the land cover consists of roofs as well as paved, gravel and vegetated surfaces resulting in total imperviousness of 63% (). Most of the area is covered with artificial fill to make it suitable for construction with the dominant underlying soil being clay (Rautiainen Citation2016). The area is planned to undergo considerable construction in the future, as it will be developed into a sustainable residential area.
Figure 1. An aerial image of the study area with the two catchments (a), the sub-catchment division according to homogeneous surface types (b), and the location of the study site on the map of Finland (c).
2.2. Rainfall and discharge data
Rainfall and stormwater discharge were measured at Catchment 1 from 7 November 2017 to 9 January 2018 (). One-minute resolution records were collected using a tipping bucket rain gauge and an ultrasonic flowmeter for rainfall and discharge, respectively. From the three rain events observed during the period, two were selected for calibration (C1, C2) whereas one (V1) was reserved for validation ().
Table 1. Rainfall-runoff events used for model parameterization and simulations.
Data from a City of Turku operated weather station about 1.5 km northeast of the study area was used for studying the proposed stormwater management designs. Rainfall data for the 7-month period (E1) were from May to November 2012 and included two distinctively intensive rain events (E2 and E3) (). E2 was an extreme rain event measured in August 2012 with a return period of ca. 100 years. E3 was an intensive rain event measured in October 2012 with a return period of ca. 30 years. In addition to the observed events, a synthetic event E4 was generated to study the role of initial storage conditions at the catchment. Event E4 was prescribed to have the initial conditions preceding E3, followed by the occurrence of an extreme event similar to E2. Finally, the maximum storage capacity of the studied stormwater management designs was assessed using a continuous rain of 1 mm/min and observing when the storage maximum was reached.
2.3 Model parameterization
SWMM is a widely used model for simulating water balance components, i.e. runoff, infiltration, and evaporation, in a system of heterogeneous urban subcatchments as well as flow and flooding in pipe systems in urban areas (Rossman et al. Citation2016a). Recent versions of SWMM (Rossman et al. Citation2016b) allow for simulating water balance components for LID techniques and their combined hydrological effects in urban areas. For a more extensive analysis of the performance and gap analysis of the SWMM model, the reader is referred to Niazi et al. (Citation2017).
Following Krebs et al. (Citation2014), the catchment was divided into small homogeneous subcatchments sharing the same land cover types. This facilitated adopting parameter values from earlier urban hydrological studies. Infiltration was simulated using the Green-Ampt equation and the flow routing in the pipe system using the dynamic wave theory. The node ponding was not allowed in the model.
Subcatchment characteristics, i.e. area, mean slope and flow width were computed from a digital elevation model (DEM) provided by the City of Turku. The flow width (m) for each subcatchment was computed using EquationEquation (1)
(1)
(1) .
where is the subcatchment area (m2) and
was selected as a calibration parameter.
Krebs et al. (Citation2014) identified the depression storage (), the Manning’s roughness coefficient for the overland flow (
) and the closed conduit flow (
), and the imperviousness (IMP) of land cover as the key parameters affecting SWMM model performance. Therefore, these four parameters were selected for automatic calibration using PEST software (Doherty Citation2018) and
was manually calibrated afterwards. The remaining parameters, i.e. infiltration parameters for clay soil, the soil initial moisture deficit
, the wetting front soil suction head
and the saturated hydraulic conductivity
were adopted from Rawls et al. (Citation1993).
2.4. Model calibration and validation
The SWMM model was calibrated against two events (C1 and C2) and validated against one event (V1) () by comparing the measured and simulated runoff depths. The performance of the model was evaluated using the coefficient of determination () e.g. (Hirsch et al. Citation1992) and the Nash-Sutcliffe efficiency (
) (Nash and Sutcliffe Citation1970), where
is the observed discharge (l/s) and
is the simulated discharge at time t,
is the mean observed discharge and
is the mean simulated discharge.
Table 2. Areal coverage (ha) and proportions (%) of different surface types for current state (0) and designs (A–C) at the study area.
2.5. Water balance analysis
Water balance analysis was used to estimate the total storage for the study area in its current state and the future state with the proposed stormwater management designs. The SWMM simulations were performed for the 7-month period (E1).
Water stored within a system at time , i.e. storage
, was reconstructed from the simulated water balance components (EquationEquation 2
(2)
(2) ).
where is the storage at time
,
is the rainfall,
is the stormwater lost from the drainage network as flooding,
is the discharge from the outfalls,
is the stormwater infiltrating into the underlying soil,
is the stormwater lost as evapotranspiration, and
is the time step. The initial storage
in early May set as the wilting point moisture content of the soil layer. For events E2-E4, the E1 simulation provided the initial storage.
2.6. Stormwater management designs
The catchment in its current state (0), and three future stormwater management designs (A, B, C) outlined as part of alternative landscape architectural plans were examined in the study area (). All designs promote treating the stormwater near its origin via storage and slow but continuous infiltration of surface waters into the underlying soil. This is achieved by installing different combinations of interception-based LID techniques, i.e. green roofs (GR) and rain gardens (RG), storage-based LID techniques, i.e. permeable pavements (PP) and bioretention cells (BC), as well as a natural conveyance system, i.e. a vegetated swale (VS) to reinvent the natural hydrological processes in the study area. The changes in the proportions of different land cover types and LID techniques between the designs and the current state are shown in .
Figure 2. The three studied stormwater management designs A (a), B (b) and C (c) and the studied area in current state 0 (d).
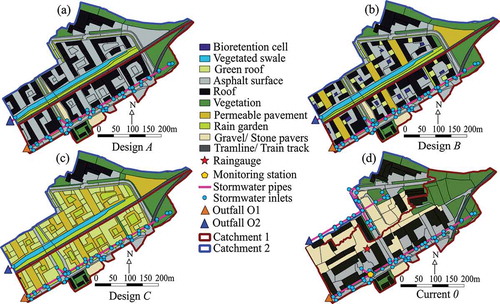
Design A with limited use of LID techniques represents the current actual plan for the development of the study area (). It aims to create a multi-functional landscape for various urban functions, with an efficient stormwater drainage using above-ground stormwater conveyance in a vegetated swale supplemented by existing pipe drainage network. On-site treatment of stormwater is promoted by allocating an area representing ca. 7% of the total study area for rain gardens. Yards and parking lots are paved with asphalt and no green roofs or permeable pavements are used. Thus, in design A ca. 10% of the total area is covered with stormwater management techniques.
Design B is an upgrade of design A, where additional LID techniques are introduced to increase on-site storage and infiltration of stormwater, without compromising other urban functions such as emergency services access, playgrounds, and walkways ()). The LID techniques in design B are placed in series with interception-based techniques at the upstream, storage-based techniques in the middle and conveyance-based techniques at the downstream. The additional LID techniques are primarily storage-based (ca. 10% of the total area), such as bioretention cells and permeable pavements, and interception-based techniques (4%), such as green roofs and rain gardens. The yards are still asphalt to allow easy access for emergency services, but bioretention cells are constructed at corners of yards for stormwater treatment. The bioretention cells have a storage layer to enhance continuous infiltration and underdrain connected to the existing pipe network to prevent ponding of stormwater. Paved parking lots are replaced with permeable pavement. Similar to bioretention cells, permeable pavements have both storage layer and underdrain system. As per the current convention in the City of Turku, roofs of only one-storey buildings are replaced with green roofs (ca. 3% of the total area). Thus, in design B ca. 24% of the total area is covered with stormwater management techniques.
Design C is an ambitious upgrade of design A based on maximizing stormwater storage and losses (infiltration and evapotranspiration) (). In design C, stormwater regulation precedes all other urban functions and as a result, 60% of the study area is covered by LID techniques. All roofs are replaced with green roofs and all yards and parking lots are covered with permeable surfaces. The corners of yards in design C are replaced with rain gardens larger in area than bioretention cells in design B to promote continuous connectivity of green areas in the catchment. Design C has larger areal coverage of interception-based than storage-based LID techniques.
While for all designs A-C the total extent of the study area is the same as in the current state, the ratio between Catchment 1 and Catchment 2 varies between the current state and the designs. The area of Catchment 1 is 10 ha in the current state but is reduced to 6.7 ha in designs A-C. Correspondingly, Catchment 2 with an area of 4.8 ha in the current state will increase to 8.1 ha. These changes result from the outfall of Catchment 2 (O2) moving southwards so that in designs A-C it collects all the water from the vegetated swale as well as water north of the swale (). The outfall of Catchment 1 (O1) remains in the same location as in the current state. As a result of these changes, stormwaters of Catchment 2 in designs A-C are managed using nature-based solutions with LID techniques only.
The calibrated parameter values from the current state were used to construct parameterizations for stormwater management Designs A-C () for the events E1-E4. The parameter values for LID techniques () were collected from literature (Holt et al. Citation2018; Krebs et al. Citation2016).
Table 3. Parameters used for LID simulations.
3. Results
3.1. Model calibration and validation
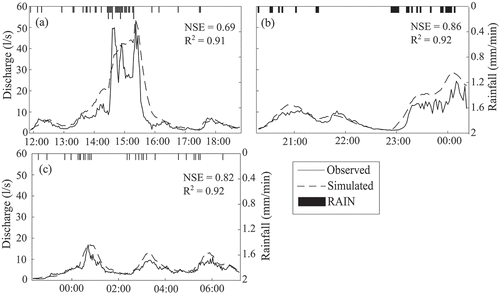
SWMM was calibrated against on-site measured discharge produced by events C1 and C2 at Catchment 1 in its current state. Subsequently, the model was validated for event V1. After calibration, the model showed good performance in reproducing the observed discharge with and
for C2 and V1 (). For C1, the coefficient of determination was also high (
), but the Nash-Sutcliffe efficiency was lower than for C2 and V1 (
). shows the calibrated parameter values used in this study as well as parameter values adopted from Krebs et al. (Citation2014). The calibrated value of the flow width
was
.
Table 4. Parameter values used in model simulations.
Figure 3. Observed and simulated discharge for calibration events C1 (a) and C2 (b) and for validation event V1 (c) for Catchment 1 in its current state.
3.2. Water balance
summarizes the water balance components for the current state (0) and the designs A-C as percentage values of precipitation for all events. In 0, the capacity of the drainage network was exceeded leading to flooding in all events. When the catchment storage capacity increased from design A to B to C, the flooding correspondingly was reduced. Among the designs, design C showed the highest storage capacity and the strongest resilience against pluvial flooding, with small flooding only during the extreme events E2 and E4.
Figure 4. Water balance components for current state (0) and for designs A-C in events E1-E4.
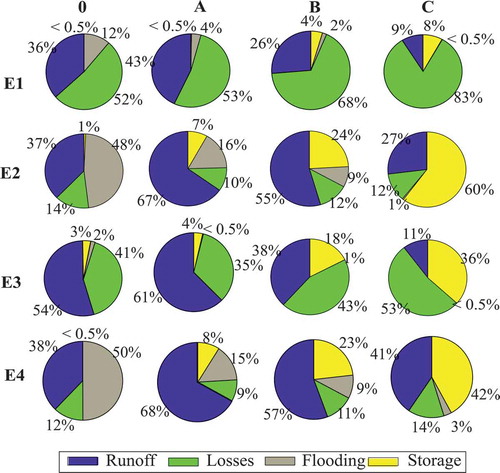
The designs reduced total runoff (runoff and flooding) from 2–4% for design A to 22–43% for design B, and to 49–82% for design C when compared to 0. However, for design A in E3, the total runoff was increased by 9%. This was due to the swale conveying stormwater more efficiently and in a more controlled manner in designs A-C than in 0 where runoff was quickly generated on larger areas of impervious surfaces. Likewise, the designs increased infiltration and evapotranspiration, as seen from increased losses for long-term simulations, i.e. 1% in design A, 31% in B and 58% in C.
All designs A-C were more efficient than 0 for rain events of lower intensity, as seen from the share of runoff being lower for the intense event E3 than for the extreme event E2 (). For E3, even design A produced no flooding whereas some flooding was noticed for 0. In E4 for design C, the storage capacity was lower than in E2 due to wet initial condition, and as a result, the share of runoff was higher in E4 than in E2.
3.3. LID contributions to water balance
The stormwater management designs (A, B, and C) combined different proportions of various LID techniques as seen in . The contributions of each LID technique and non-LID surface on the water balance were studied by examining the relative shares of storage and losses for designs A-C for all events as a percentage of event rainfall (). The contributions of each LID technique to storage and losses represented their storage capacity and their ability to recover and drain the storage over time.
Figure 5. Contributions of Rain garden (RG), Vegetated swale (VS), Bioretention cell (BC), Green roof (GR), Permeable pavement (PP), and non-LID surfaces (Others) to storage capacity and losses for events E1-E4 as a percentage of event rainfall.
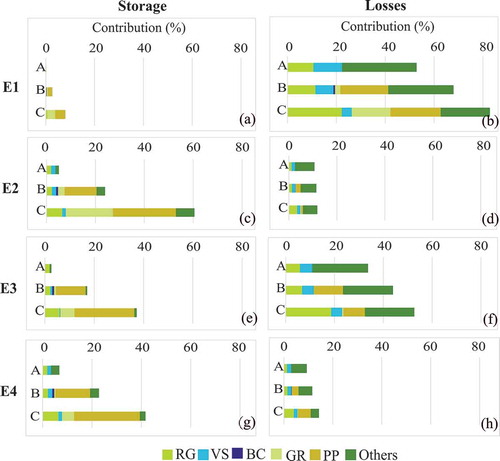
In design A with the least amount of LID techniques, the small storage capacity was almost entirely due to rain gardens and vegetated swales. The non-LID surfaces (‘Others’ in ) contributed the most to the losses from the catchment for all events. Those surfaces also provided the most storage for the synthetic extreme event E4.
When the coverage of LID techniques was increased at the catchment, the storage capacity increased, both because of the greater number of rain gardens in B and C compared to A but also because of introducing new LID techniques. In design B, the increased storage capacity was mostly due to the introduced permeable pavements. Introduction of permeable pavements in B also increased infiltration and evaporation, but the majority of losses still occurred from non-LID surfaces for all events. Increasing the coverage of LID techniques in design C further increased the storage capacity at the catchment, mainly because of a greater number of green roofs and permeable pavements.
Individual LID techniques were more effective in providing resilience for the less intense event E3 than for the extreme event E2. For example in design C, permeable pavements in E2 constituted 43% of the total storage and 6% of total losses whereas in E3 the contributions were 65% and 17%, respectively. However, green roofs were an exception by contributing more to storage in E2 than in E3 in both designs B and C. In E4 with more initial storage capacity, the storage for green roofs was again decreased when compared to E2.
Bioretention cells were used in design B, but since they only covered 1% of catchment area, their contribution to catchment water balance was the least significant of all LID techniques for E1, E2 and E4. However, in the intense event E3, bioretention cells provided the same amount of storage as the vegetated swale and non-LID surfaces despite having a much smaller areal coverage.
3.4. Storage and runoff dynamics
To gain understanding about the temporal changes in the water balance of the catchment, we studied time series of total storage and total runoff (including flooding) for designs A-C in events E1-E4 ().
Figure 6. Time series of storage (top) and runoff (bottom) for designs A, B, and C for E1 (a and e), E2 (b and f), E3 (c and g), and E4 (d and h).
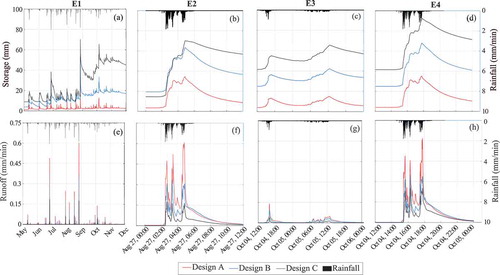
The long-term assessment E1 illustrated the lack of storage capacity in design A, where the storage remained close to zero throughout the simulation ()). The LID intensive designs B and C had more storage capacity, which resulted in reduced volumes of stormwater runoff ()) and smaller peak flows in events E2-E4 (–h)) as compared to design A. During the summer, the water stored in LID techniques was lost predominantly by evapotranspiration (29% of E1 for design C) and less as infiltration (4%) during inter-event periods ()). In colder months, the depletion of water storage was slightly dominated by infiltration (15%) over evapotranspiration (12%) due to reduced evapotranspiration compared to summer months. For design B, the stored water in LID techniques was lost almost equally by infiltration and evapotranspiration (13% and 10%) during the summer. Similar to design C, the losses in design B were dominated by infiltration (16%) over evapotranspiration (4%) during colder months. Because the decrease in evapotranspiration during colder months was much higher for design C, the seasonal difference in storage was more pronounced compared to design B.
The seasonal differences played a major role in prescribing the initial moisture and water storage conditions of LID techniques for individual events (). During the extreme event E2 at the end of the summer period, the amount of initially stored water in designs A, B and C was relatively small (). Even though the amount of stored water increased in B and C, causing higher initial storage for the intense E3 event in early October, the storage capacity was not exceeded for any of the designs. However, during the synthetic extreme event E4, the maximum storage capacity of design B (approximately 65 mm) was exceeded. Storage capacity of design C (approximately 120 mm) was not completely filled even during E4. Design A, on the other hand, had the maximum storage capacity of approximately 35 mm, which was exceeded during both E2 and E4. The effect of initial moisture and water storage conditions on runoff volume in E4 compared to E2 was negligible for design A, but the runoff volume was 3% and 57% higher during E4 for designs B and C, respectively.
4 Discussion
Catchment water storages and losses can be quantified and performance of LID techniques can be assessed in urban areas using similar water balance analysis tools as outlined earlier in applications to natural areas (McNamara et al. Citation2011; Sayama et al. Citation2011; Spence et al. Citation2010). Instead of focusing on runoff alone, as is often the case in stormwater management studies in urban areas (Qin, Li, and Fu Citation2013; Guan et al. Citation2015a, Citation2015b; Xu et al. Citation2017), the water balance analysis of this study supported a more holistic evaluation of the storage dynamics at the catchments in different stormwater management designs. Prerequisites for the analysis were the detailed parameterization of the study area by the division of the catchment into small homogenous subcatchments following Krebs et al. (Citation2014). This fine spatial detail in model description facilitated representing LID techniques at their designed locations and adopting model parameter values from previous studies conducted in similar urban areas.
The reductions in runoff volume in response to increasing LID coverage were similar to reductions reported in the literature. Guan et al. (Citation2015b) reported for various LID practices on a 12.3 ha catchment for a 2 h period 24 – 78% runoff reductions, which were comparable to the simulation results from designs B and C for 6 − 12 h periods (25 – 82%). Likewise, Avellaneda et al. (Citation2017) showed 9% reduction in runoff volume and a corresponding 9% increase in evapotranspiration and infiltration on a 12 ha catchment with LID techniques covering 0.7% of the area during a 6-year period. The runoff reductions in Avellaneda et al. (Citation2017) were greater than the results for design A in the long-term simulation E1 (2%) but smaller than for designs B and C (43% and 80%, respectively). The differences between the simulation results in this study and Avellaneda et al.’s (Citation2017) results are likely due to differences in LID techniques used and their areal coverage. In addition, the introduction of the vegetated swales in designs A-C transformed the previously uncontrolled surface runoff in the current state scenario into a controlled runoff in the swale, even though the introduction of swale did not significantly reduce runoff volume.
Although runoff reduction in design A was only 2% from the current state, the design clearly increased resilience against flooding. The share of flooding in the water balance was reduced considerably by design A for all events () and especially for in the intense event with a return period of ca. 30 years. This suggests that for common rain events, even designs such as A with a limited density of LID techniques can be resilient enough in controlling flooding. Design B was a more ambitious design with an increased LID coverage (24%), and it reduced the flooding more than A, 9% for B and 16% for A. Design C was considered as a highly ambitious uppermost threshold in terms of both resilience against flooding and the need for resources to implement it in the field. C demonstrated the large potential of restoring the key features of the natural water cycle in urban areas in the local conditions by depleting stored water due to losses particularly during the summer conditions at the catchment. However, the density of LID techniques in C was so high that it may be impractical to realize in practice and would also decrease the practical value of public green areas.
Different combinations of interception-, storage- and conveyance-based LID techniques in urban designs were able to restore storage capacity, increase infiltration and evapotranspiration, and consequently improve resilience against flooding. Especially, permeable pavements as a storage-based LID were effective during extreme events. The designs with enhanced storage capacities released stormwater at slower rates leading to diminished flow peaks similar to results shown by Guan et al. (Citation2015b) and by Qin, Li, and Fu (Citation2013), where the permeable pavements were the most effective flood control measure. The bioretention cells as another storage-based LID, were not as effective as permeable pavements in either storing or losing stormwater because in the proposed designs their coverage was small (). The conveyance-based vegetated swale (covering 4% of the study area) had a large impact on reducing flooding by regulating the previously uncontrolled surface runoff into a controlled runoff in the swale. The functioning of the swale was therefore different to that of Qin, Li, and Fu (Citation2013), where the main function of the swale was to provide storage capacity whereas here the swale-provided storage was minimal. The interception-based LID, especially green roofs, were affected by the seasonality, and therefore they contributed the most to the overall storage capacity during the summer months. Their efficiency was greatly reduced in the autumn and winter due to reduced evapotranspiration. Roehr and Kong (Citation2010) noticed similar behavior for green roofs in Vancouver, Canada, where the green roofs reduced 95% of runoff during the summer and only 8% of runoff during the winter.
Even though the infiltration capacity in the study catchment is low (approximately 2 mm/h) due to the underlying clay soil, the increased LID-provided storage led to significant losses resulting from slow but continuous infiltration and evapotranspiration. Infiltration was the dominant mechanism for losses during colder months due to reduced evapotranspiration rates. The study suggests that storage-based LID techniques can enhance infiltration losses even in the clay soil conditions. In this study, the difference between the antecedent moisture conditions in synthetic extreme events E4 and E2 had little effect on the runoff for design B. The small impact in design B was explained by the maximum storage capacity (65 mm) being exceeded for E4 as the initial state of the storage was only 5 mm higher compared to E2. The larger impact on the runoff in design C can be explained by a higher increase in the antecedent moisture condition (about 25 mm) for the synthetic autumn extreme event E4 compared to E2. In design A, however, the storage capacity was so small (35 mm) that the amount of stored water was practically lost before the onset of the event, and consequently there was no difference in the initial state between E2 and E4. However, from ) it was evident that in particular for design C the level of storage kept increasing towards the end of the study period. It needs to be noted that the present study is limited to the simulation of seven snow-free months. A longer simulation involving also the winter season would be required to assess to which extent the storage returns to lower values when evapotranspiration rises again during the following summer season.
Both observed stormflow and precipitation data are subject to uncertainties. While the reliability of the data is essential in verifying the model performance, it is expected that potential inhomogeneities in the data do not significantly distort the results on differences between alternative management scenarios sharing the same input data. In this study, the combinations of different LID techniques in varying intensities were studied to improve the resilience against pluvial flooding during extreme events. One step further would be to optimize the specifications of the selected LID techniques, as demonstrated by Ahmed et al. (Citation2017), where SWMM parameters defining specifications of single LID units were optimized using the Water Management Analysis Module of Song, Chung, and Kim (Citation2018). In addition, the parameterization of vegetated areas based only on soil parameters is known to overly simplify evapotranspiration estimation (Hörnschemeyer, Henrichs, and Uhl Citation2019). Therefore, catchment-scale evaporation and infiltration were combined in this study as a total loss. Earlier studies have developed improved ET routines for SWMM (e.g. Feng and Burian Citation2016; Hörnschemeyer, Henrichs, and Uhl Citation2019), which could allow for a more reliable separation between evapotranspiration and infiltration in natural vegetated areas in urban regions.
5 Conclusions
Detailed parameterization of stormwater management designs within an urban catchment facilitated studying the combined impacts of LID techniques on the water balance. Stormwater management designs with increasing coverage of LID techniques had positive impacts on urban water balance in two main ways. Firstly, this was achieved through the reduction of runoff and flooding during extreme events. Secondly, the losses were increased in the longer period due to conversion of temporary storage to losses, as stored water was available for evapotranspiration during the summer months and for infiltration during the autumn months even in the presence of clay as the underlying soil layer.
Although not capable of storing excessive amounts of stormwater, the stormwater design with the least storage (10% total LID coverage) with a conveyance-based vegetated swale as the main function was able to safely convey two thirds of uncontrolled floodwater from current catchment during the extreme event (E2), which had a return period of 100 years. The design with an additional interception- and storage-based LID techniques, and with 24% total LID coverage, provided more storage and resilience with only 9% of flooding even for the extreme event E2. The most ambitious stormwater design with 60% total LID coverage nearly removed flooding even for the extreme event (E2). While the long-term simulation for the current state produced losses of 52% from the total amount of precipitation, the design with a feasible amount of 24% total LID coverage could increase these losses by one third. The most ambitious design with 60% total LID coverage demonstrated the potential for restoring key features of the natural water cycle through its ability to lose 83% of stored water during the long-term period. However, the design was perhaps an upper threshold of LID usage in an urban catchment and thus not easily realisable in practice.
This study thus demonstrated the importance of maintaining catchment storage during the urbanization process to enhance resilience against flooding and to retain more natural water cycle. In addition, the study suggested that the storage capacity is an important flood resilience indicator directly linked with the physical catchment characteristics.
Acknowledgements
Authors are grateful for the funding from the Ministry of Agriculture and Forestry, Finland, the Schlumberger Foundation, and Maa-ja vesitekniikan tuki ry. The study was conducted as a part of the UrbanStormwaterRisk 2016-2019 and EU WaterJPI Multi-scale urban flood forecasting (MUFFIN) projects. Rainfall and discharge data for calibration and validation were provided by Luode Consulting Ltd, Finland. Rainfall data for design simulations came from rain gauge operated by the City of Turku.
Disclosure statement
No potential conflict of interest was reported by the authors.
Additional information
Funding
Related Research Data
References
- Ahmed, K., E. S. Chung, J. Y. Song, and S. Shahid. 2017. “Effective Design and Planning Specification of Low Impact Development Practices Using Water Management Analysis Module (WMAM): Case of Malaysia.” Water (Switzerland) 9: 1–14. doi:10.3390/w9030173.
- Avellaneda, P. M., A. J. Jefferson, J. M. Grieser, and S. A. Bush. 2017. “Simulation of the Cumulative Hydrological Response to Green Infrastructure.” Water Resources Research 53: 3087–3101. doi:10.1002/2016WR019836.
- Burns, M. J., T. D. Fletcher, C. J. Walsh, A. R. Ladson, and B. E. Hatt. 2012. “Landscape and Urban Planning Hydrologic Shortcomings of Conventional urban Stormwater Management and Opportunities for Reform.” Landscape and Urban Planning 105: 230–240. doi:10.1016/j.landurbplan.2011.12.012.
- Burns, M. J., J. E. Schubert, T. D. Fletcher, and B. F. Sanders. 2015. “Testing the Impact of At-source Stormwater Management on Urban Flooding through a Coupling of Network and Overland Flow Models.” Wiley Interdisciplinary Reviews: Water 2: n/a–n/a. doi:10.1002/wat2.1078.
- Doherty, J. 2018. PEST: Model-Independent Parameter Estimation (User Manual, Part I). Brisbane, Australia: Watermark Numerical Computing.
- Feng, Y., and S. Burian. 2016. “Improving Evapotranspiration Mechanisms in the U.S. Environmental Protection Agency’s Storm Water Management Model.” Journal of Hydrologic Engineering 21: 06016007. doi:10.1061/(asce)he.1943-5584.0001419.
- Fletcher, T. D., H. Andrieu, and P. Hamel. 2013. “Advances in Water Resources Understanding, Management and Modelling of Urban Hydrology and Its Consequences for Receiving Waters : A State of the Art.” Advances in Water Resources 51: 261–279. doi:10.1016/j.advwatres.2012.09.001.
- Fletcher, T. D., W. Shuster, W. F. Hunt, R. Ashley, D. Butler, S. Arthur, S. Trowsdale, et al. 2015. “SUDS, LID, BMPs, WSUD and More – The Evolution and Application of Terminology Surrounding Urban Drainage.” Urban Water Journal 12: 525–542. doi:10.1080/1573062X.2014.916314.
- Golden, H. E., and N. Hoghooghi. 2017. “Green Infrastructure and Its Catchment-scale Effects: An Emerging Science.” Wiley Interdisciplinary Reviews: Water 5: e1254. doi:10.1002/wat2.1254.
- Guan, M., N. Sillanpaa, and H. Koivusalo. 2015b. “Assessment of LID Practices for Restoring Pre- Development Runoff Regime in an Urbanized Catchment in Southern Finland.” Water Science and Technology 71 (10): 2015–2017. doi:10.2166/wst.2015.129.
- Guan, M., N. Sillanpää, and H. Koivusalo. 2015a. “Modelling and Assessment of Hydrological Changes in a Developing Urban Catchment.” Hydrological Processes 29: 2880–2894. doi:10.1002/hyp.10410.
- Hirsch, R. M., D. R. Helsel, T. A. Cohn, and E. J. Gilroy. 1992. “Statistical Analysis of Hydrologic Data.” In Handbook of Hydrology, edited by D. E. Maidment, 1–55. New York, USA: McGraw-Hill.
- Holt, E., H. Koivusalo, J. Korkealaakso, N. Sillanpää, and L. Wendling. 2018. Filtration Systems for Stormwater Quantity and Quality Management: Guideline for Finnish Implementation, VTT Technology, 82. Finland: VTT Technical Research Centre.
- Hörnschemeyer, B., M. Henrichs, and M. Uhl. 2019. Setting up a SWMM-integrated Model for the Evapotranspiration of Urban Vegetation, Conference abstract, 1–4, NOVATECH, Lyon, France.
- Kirchner, J. W. 2009. “Catchments as Simple Dynamical Systems: Catchment Characterization, Rainfall-runoff Modeling, and Doing Hydrology Backward.” Water Resources Research 45: 1–34. doi:10.1029/2008WR006912.
- Krebs, G., T. Kokkonen, M. Valtanen, H. Setälä, and H. Koivusalo. 2014. “Spatial Resolution Considerations for Urban Hydrological Modelling.” Journal of Hydrology 512: 482–497. doi:10.1016/j.jhydrol.2014.03.013.
- Krebs, G., K. Kuoppamäki, T. Kokkonen, and H. Koivusalo. 2016. “Simulation of Green Roof Test Bed Runoff.” Hydrological Processes 30: 250–262. doi:10.1002/hyp.10605.
- McNamara, J. P., D. Tetzlaff, K. Bishop, C. Soulsby, M. Seyfried, N. E. Peters, B. T. Aulenbach, and R. Hooper. 2011. “Storage as a Metric of Catchment Comparison.” Hydrological Processes 25: 3364–3371. doi:10.1002/hyp.8113.
- Miles, B., and L. E. Band. 2015. “Green Infrastructure Stormwater Management at the Watershed Scale: Urban Variable Source Area and watershed Capacitance.” Hydrological Processes 29: 2268–2274. doi:10.1002/hyp.10448.
- Nash, J. E., and J. V. Sutcliffe. 1970. “River Flow Forecasting through Conceptual Models Part I — A Discussion of Principles.” Journal of Hydrology 10: 282–290. doi:10.1016/0022-1694(70)90255-6.
- Niazi, M., C. Nietch, M. Maghrebi, N. Jackson, B. R. Bennett, M. Tryby, and A. Massoudieh. 2017. “Storm Water Management Model: Performance Review and Gap Analysis.” Journal of Sustainable Water in the Built Environment 3: 04017002. doi:10.1061/JSWBAY.0000817.
- Qin, H. P., Z. X. Li, and G. Fu. 2013. “The Effects of Low Impact Development on Urban Flooding under Different Rainfall Characteristics.” Journal of Environmental Management 129: 577–585. doi:10.1016/j.jenvman.2013.08.026.
- Rautiainen, M. 2016. “Hulevesimallinnus Ja Tulvariskin Arviointi Turun Sataman Valuma-alueella (Storm Water Modelling and Flood Risk Assessment in Turku Harbor Catchment).” Master’s Thesis, Aalto University, Espoo, Finland. http://urn.fi/URN:NBN:fi:aalto-201611025308
- Rawls, W. J., L. R. Ahuja, D. L. Brakensiek, and A. Shirmohammadi. 1993. “Infiltration and Soil Water Movement.” Handbook of Hydrology 5: 1–5.51. doi:10.1097/TA.0b013e31816348a8.
- Roehr, D., and Y. Kong. 2010. “Runoff Reduction Effects of Green Roofs in Vancouver, BC, Kelowna, BC, and Shanghai, P.R. China.” Canadian Water Resources Journal 35: 53–68. doi:10.4296/cwrj3501053.
- Rossman, L. A., and W. C. Huber. 2016a. “Storm Water Management Model Reference Manual Volume I – Hydrology.” U.S. Environmental Protection Agency I 231. doi:10.1016/S0021-9290(00)00018-X.
- Rossman, L. A., and W. C. Huber. 2016b. “Storm Water Management Model Reference Manual Volume III – Water Quality.” U.S. Environmental Protection Agency I. https://doi.org/EPA/600/R-15/162A
- Salvadore, E., J. Bronders, and O. Batelaan. 2015. “Hydrological Modelling of Urbanized Catchments: A Review and Future Directions.” Journal of Hydrology 529: 62–81. doi:10.1016/j.jhydrol.2015.06.028.
- Sayama, T., J. J. Mcdonnell, A. Dhakal, and K. Sullivan. 2011. “How Much Water Can a Watershed Store?” Hydrological Processes 25: 3899–3908. doi:10.1002/hyp.8288.
- Sillanpää, N., and H. Koivusalo. 2015. “Urban Development Impacts on Runoff Event Characteristics and Unit Hydrographs across Warm and Cold Seasons in High Latitudes.” Journal of Hydrology 2015–2017. doi:10.1016/j.jhydrol.2014.12.008.
- Song, J. Y., E. S. Chung, and S. H. Kim. 2018. “Decision Support System for the Design and Planning of Low-impact Development Practices: The Case of Seoul.” Water (Switzerland) 10. doi:10.3390/w10020146.
- Spence, C., X. J. Guan, R. Phillips, N. Hedstrom, R. Granger, and B. Reid. 2010. “Storage Dynamics and Streamflow in a Catchment with a Variable Contributing Area.” Hydrological Processes 24: 2209–2221. doi:10.1002/hyp.7492.
- Vogel, J. R., T. L. Moore, R. R. Coffman, S. N. Rodie, S. L. Hutchinson, K. R. McDonough, A. J. McLemore, and J. T. McMaine. 2015. “Critical Review of Technical Questions Facing Low Impact Development and Green Infrastructure: A Perspective from the Great Plains.” Water Environment Research 87: 849–862. doi:10.2175/106143015X14362865226392.
- Xu, T., H. Jia, Z. Wang, X. Mao, and C. Xu. 2017. “SWMM-Based Methodology for Block-scale LID-BMPs Planning based on Site-scale Multi-objective Optimization: A Case Study in Tianjin.” Frontiers of Environmental Science & Engineering 11. doi:10.1007/s11783-017-0934-6.